

Kluwer - Handbook of Biomedical Image Analysis Vol
.2.pdf


Segmentation Issues in Carotid Artery Atherosclerotic Plaque |
435 |
abnormality are measured from one BB weighting. An operator draws lumen contours on both TOF and BB images by a Snake algorithm with appropriate weightings for the image energy term [100]. This step is the only semiautomatic step and the remaining steps do not require manual intervention.
In this approach, the algorithm classifies all points around the lumen contour, although the FC technically covers only the lipid core. With this approach, the human operator does not need to identify the body of the plaque and hence allows for easier automation. This is at most a minor limitation because normal wall is also associated with a dark rim. Hence, the algorithm classifies both types of stable walls, thick caps and normal vessel, as a single category. On the other hand, unstable fibrous caps that are thinned, eroded, or ruptured are separated by the algorithm.
8.5.5 Detection of Dark Rim
For each point along the contour, the gradient along the normal to the contour at that point is calculated. The TOF image is Wiener filtered to remove noise before gradient calculation. The actual gradient used is calculated as an average in a small (3 pixel) neighborhood of the normal. The gradient calculation extends 2 pixels into the lumen and 5–6 pixels outside the lumen (Fig. 8.26). This extent seems to cover most dark rims and also provide enough coverage to distinguish between a rim and a dark region next to the lumen.
Gradient |
averaged |
three pixels wide along |
|
the normal |
Local curvature |
TOF |
BB |
Figure 8.26: Feature vector calculation: Gradient along the normal to the TOF lumen contour and ratio of local curvature to global curvature on the registered BB lumen contour.
436 |
Xu et al. |
8.5.6 Detection of Focal Contour Abnormality
A focal contour abnormality is said to occur when the local curvature is large compared to the average lumen curvature. The curvature,
c |
= |
|
x˙y¨ − y˙x¨ |
(8.60) |
|
(x˙ 2 + y˙ 2)3/2 |
|||||
|
|
||||
is calculated for a small segment of the lumen and its ratio to the average curvature for the whole lumen is assigned to the point in the center of that segment. In order to obtain gradient and curvature parameters for the same point, the TOF contour and BB contour are brought into correspondence by registering the centroids of their convex hulls. With this definition any sharp change in curvature is detected. It becomes significant only when associated with the absence of a dark rim. However, it has to be noted that this could lead to some false classifications especially around the bifurcation.
8.5.7 Classification
The parameters for dark rim and focal abnormality were measured from a set of images identified by radiologists and confirmed by histology. Two sets each were used for thick, thin, and ruptured caps. Several measurements along the contour were thus available for each set. The mean and covariance of each parameter for thick, thin, and ruptured caps was then calculated. These templates were used for classification by the feature distance of a candidate point from a template for thick, thin, and ruptured classes. The Mahalanobis distance of the dark rim parameter was used to differentiate thick caps from the other two classes. The thin and ruptured classes were differentiated from the remaining points based on the curvature parameter again using the Mahalanobis distance metric,
r2 = (x − m)C−1(x − m) |
(8.61) |
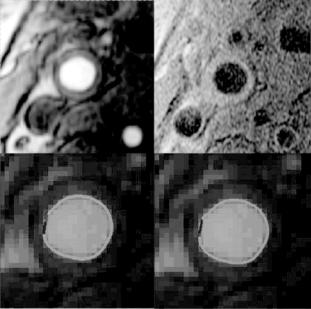
where m and C are mean and covariance matrices, respectively. This decision is based on the observation that both thin and ruptured caps do not have a dark rim but the ruptured can be differentiated by the presence of a focal contour abnormality. Figure 8.27 shows an example of the algorithms classification compared to ground truth by histology.
Segmentation Issues in Carotid Artery Atherosclerotic Plaque |
437 |
3D TOF |
T1 |
Segments by histology |
Segments by algorithm |
Figure 8.27: Example of FC classification with corresponding MR images and ground truth by histology. (A color version of this figure can be found on the CD. Green: thick cap; blue: thin cap; red: ruptured cap.)
8.5.8 Postprocessing
The classified pixels are then postprocessed to remove isolated classifications. These pixels are merged into those of surrounding pixels by a morphological opening operation (an element size of 5 was used). This makes the classification similar to what is outlined by a human operator so that classification by the algorithm can be compared to ground truth outlined by a pathologist.
8.5.9 Validation
A pathologist outlined the contour classifications from six endarterectomy patients. These sections were centered on the bifurcation with an average of 8–9 slices per patient. Fifty three sections out of these with matched MR image slices were chosen for analysis. The classification by the algorithm was then compared to the ground truth by histology. Each cap status per slice compared point by point for classification accuracy was used to calculate Pearson’s correlation coefficients. The algorithm performs well in classifying thick and thin caps with

Segmentation Issues in Carotid Artery Atherosclerotic Plaque |
439 |
8.5.10 Conclusion
This preliminary algorithm shows promise in separating stable (thick) and unstable (thin) fibrous caps. Future work is aimed at improving the detection of ruptured cap and differentiating it from thin caps. Actual identification of ruptured caps is a more complicated issue involving multicontrast MRI with up to 5 weightings (3D TOF, T1, T2, PD, and contrast enhanced T1). A human expert also uses presence of juxtaluminal calcification, intraplaque hemorrhage, and thrombus to detect a ruptured cap. An algorithm that takes into account all the above weightings and factors would be more likely to differentiate ruptured caps from thin caps.
8.6 Conclusions
In this chapter, we discussed some postprocessing techniques to provide reliable and practical solutions for carotid plaque study based on MR images. For the three categories of images, single contrast weighting gray level images, image sequences, and multiple contrast weighting images, we have developed algorithms to address their specific needs and integrated into a software package, quantitative vascular analysis system (QVAS).
For single contrast weighting gray level image, we use MAP criterion with MRF priors as a powerful tool to build up the image model. The inherent noiseresistant ability and explicit description of pixel relations guarantee the results reliability and robustness. Also, the QHCF algorithm provides a feasible solution for its implementation in practical applications.
The solutions for image sequence segmentation and object tracking are built on the MRF-based active contour model. This framework incorporates the accurate and reliable region segmentation of MRF with the optimal contour tracking ability of minimal path approach. To ensure the optimal combination of these two models, a new criterion, maximum reliability, is set up as a bridge. This framework is also very flexible and extensible to include additional prior knowledge for various applications. In this study, it has been successfully applied to carotid artery tracking and lumen segmentation in MR image sequences.
Our initial study on multiple contrasts weighting MR image segmentation extends the MRF to multiple dimensions. However, because of the intrinsic limitations of this model, we adopted and further enhanced a clustering-based
440 |
Xu et al. |
algorithm by employing mean shift as density estimator. The results of multiple contrast weighting MR image segmentation and the histology section validation demonstrate very successful performance.
Detection of FC status is crucial for understanding the disease status and prognosis of atherosclerosis. The preliminary algorithm introduced in section 8.5 shows promise in separating stable (thick) and unstable (thin) FCs. Future work is aimed at improving the detection of ruptured cap and differentiating it from thin caps.
Since the images in our study are of poor quality than are usual practical images, the algorithms for gray level images and image sequences segmentation can be applied as general solutions. The multiple contrast weighting approaches can also be used for color images segmentation because their general properties are shared.
Questions
1.What are the motivations and research directions in carotid artery atherosclerosis study?
2.Why is the study of constituents within carotid vessel wall very important?
3.Technically, what are the unique challenges in MRI obtained from advanced lesions in human carotid arteries?
4.What is the region segmentation method applied to single contrast MR image?
5.What is the advantage of using the MRF-based active contour model?
6.What are the criteria used in selecting the control points for active contour model?
7.How is dynamic weighting defined in multiple dimension MRF model?
8.What is dynamic mean shift density estimation in clustering multiple dimension data?
9.Why is automatic detection of fibrous cap status important?
10.What are the primary image features used in automatic fibrous cap detection?

Segmentation Issues in Carotid Artery Atherosclerotic Plaque |
441 |
Bibliography
[1]Yuan, C., Mitsumori, L. M., Beach, K. W., and Maravilla, K.M., Carotid atherosclerotic plaque: Noninvasive MR characterization and identification of vulnerable lesions, Radiology, Vol. 221, No. 2, pp. 285–300, 2001.
[2]Savies, M. J. and Thomas, A. C., Plaque fissuring: The cause of acute myocardial infarction, sudden ischaemic death, and crescendo angina, Br. Heart J., Vol. 53, pp. 363–373, 1985.
[3]Falk, E., Stable versus unstable atherosclerosis: Clinical aspects, Am. Heart J., Vol. 138, No. 5(Pt.2), pp. 421–425, 1999.
[4]Davies, M. J., Richardson, P. D., Woolf, N., Katz, D. R., and Mann, J., Risk of thrombosis in human atherosclerotic plaques: Role of extracellular lipid, macrophage, and smooth muscle cell content, Br Heart J., Vol. 69,
pp.377–381, 1993.
[5]Fuster, V., Stein, B., Ambrose, J. A., Badimon, L., Badimon, J. J., and Chesebro, J. H., Atherosclerotic plaque rupture and thrombosis, evolving concepts, Circulation, Vol. 82, pp. 1147–1159, 1990.
[6]Kang, X. et al., High resolution MRI of carotid atherosclerosis precision analysis of arterial lumen and wall area measurement, In: The 8th Scientific Meeting & Exhibition of the International Society for Magnetic Resonance in Medicine, Denver, CO, April 1–7, 2000.
[7]Yuan, C., Zhang, S., Polissar, N. L., Echelard, D., Ortiz, G., Davis, J. W., Ellington, E., Ferguson, M. S., and Hatsukami, T. S., Identification of fibrous cap rupture with magnetic resonance imaging is highly associated with recent transient ischemic attack or stroke, Circulation, Vol. 105, pp. 181–185, 2002.
[8]Toussaint et al., MRI lipid, fibrous, calcified, hemorrhagic, and thrombotic components of human atherosclerosis in vivo, circulation, Vol. 94,
pp.932–938, 1996.
[9]Fu, K. S. and Mui, J. K., A survey on image segmentation, Patt. Recogn., Vol. 13, pp. 3–16, 1981.