

Kluwer - Handbook of Biomedical Image Analysis Vol
.2.pdf312 |
Yang and Mitra |
the brain, Proc. SPIE Med. Imag. VI: Image Process., Vol. 1652, pp. 99–
106, 1992.
[43]Johnston, B. G., Atkins, M. S., and Booth, K. S., Partial volume segmentation in 3-D of lesions and tissues in magnetic resonance images, Proc. SPIE Med. Imaging, Vol. 2167, pp. 28–39, 1994.
[44]Gerig, G., Kubler,¨ O., Kikinis, R., and Jolesz, F. A., Nonlinear anisotropic filtering of MRI data, IEEE Trans. Med. Imaging, Vol. 11, pp. 221–232, 1992.
[45]Leemput, K. V., Maes, F., Vandermeulen, D., Colchester, A., and Suetens, P., Automated segmentation of multiple sclerosis lesions by model outlier detection, IEEE Trans. Med. Imaging, Vol. 20, No. 8, pp. 677–688, 2001.
[46]Kwan, R. K.-S., Evans, A. C., and Pike, G. B., MRI simulation-based evaluation of image-processing and classification methods, IEEE Trans. Med. Imaging. Vol. 18, No. 11, pp. 1085–97, 1999.
[47]Cocosco, C. A., Kollokian, V., Kwan, R. K.-S., and Evans, A. C., BrainWeb: Online Interface to a 3D MRI Simulated Brain Database, available at: http://www.bic.mni.mcgill.ca/brainweb/.
[48]Corona, E., Mitra, S., Wilson, M., and Soliz, P., Digital stereo optic disc image analyzer for monitoring progression of glaucoma, Proc. SPIE, Vol. 4684, pp. 82–93, 2002.
[49]Corona, E., Mitra, S., Wilson, M., Krile, T., Kwon, Y. H., and Soliz, P., Digital stereo image analyzer for generating automated 3-D measures of optic disc deformation in glaucoma, IEEE Trans. Med. Imaging, Vol. 2, No. 10, pp. 1244–1253, 2002.
[50]Yang, S., King, P., Corona, E., Wilson, M., Aydin, K., Mitra, S., Soliz, P., Nutter, B., and Kwon, Y. H., Feature extraction and segmentation in medical images by statistical optimization and point operation approaches, Proc. SPIE, Vol. 5032, pp. 1676–1684 , 2003.
[51]Mitra, S., Nutter, B. S., and Krile, T. F., Automated method for fundus image registration and analysis, Appl. Optics, Vol. 27, pp. 1107–1112, 1988.
Statistical and Adaptive Approaches for Optimal Segmentation |
313 |
[52]Lee, D. J., Krile, T. F., and Mitra, S., Power cepstrum and spectrum techniques applied to image registration, Appl. Optics, Vol. 27, pp. 1099– 1106, 1988.
[53]Sun, C., A fast stereo matching method, In: Proceedings of Digital Image Computing: Techniques and Applications, Massey University, Auckland, New Zeland, December 10–12, 1997, pp. 95–100.
[54]Ramirez, J., Mitra, S., and Morales, J., Visualization of the three dimensional topography of the optic nerve head through a passive stereo vision model, J. Electron. Imaging, Vol. 8, No. 1, pp. 92–97, 1999.
[55]Smith, P. W. and Nandhakumar, N., An improved power cepstrum based stereo correspondence method for textured scenes, IEEE Trans. Patt. Anal. Machine Intell., Vol. 18, No. 3, pp. 338–348, Mar. 1996.
[56]Pratt, W. K., Digital Image Processing, 2nd edn., Wiley-Interscience, New York, pp. 112–117, 1991.
[57]Kirbas, C. and Quek, F. K. H., Vessel extraction techniques and algorithms: A survey, In: 3rd Symposium on Bioinfomatics and BioEngineering, Bethesda, Maryland, March 2003, pp. 238–245.
[58]Kass, M., Witkin, A., and Terzoopoulos, D., Snakes: Active contour models, Int. J. Comp. Vision, Vol. 1, pp. 321–331, 1988.
[59]Osher, S. and Sethian, J. A., Fronts propagating with curvature dependent speed: Algorithms based on hamilton-jacobi formulation, JCP, Vol. 79, pp. 12–49, 1988.
[60]Chaudhuri, S. C., Katz, N., Nelson, M., and Goldbaum, M., Detection of blood vessels in retinal images using two dimensional blood vessel filters, IEEE Trans. Med. Imaging, Vol. 8, pp. 263–269, 1989.
[61]Wood, S. L., Qu, G., and Roloff, L. W., Detection and labeling of retinal vessels for longitudinal studies, In: IEEE International Conference on Image Processing, 1995, Vol. 3, pp. 164–167.
[62]Hoover, A., Kouznetsova, V., and Goldbaum, M., Locating blood vessels in retinal images by piecewise threshold probing of a matched filter response, IEEE Trans. Med. Imaging, Vol. 19, pp. 203–210, 2000.
314 |
Yang and Mitra |
[63]Zana, F. and Klein, J. C., Robust segmentation of vessels from retinal angiography, in IEEE International Conference on Digital Signal Processing, 1997, Vol. 2, pp. 1087–1090.
[64]Tolias, Y. and Panas, S. M., A fuzzy vessel tracking algorithm for retinal images based on fuzzy clustering, IEEE Trans. Med. Imaging, Vol. 17, pp. 263–273, 1998.
[65]Zhou, L., Rzeszotarski, M. S., Singerman, L. J., and Chokreff, J. M., The detection and quantification of retinopathy using digital angiograms, IEEE Trans. Med. Imaging, Vol. 13, pp. 619–626, 1994.
[66]Rosenfeld, A., On connectivity properties of grayscale pictures, Patt. Recogn., Vol. 16, No. 1, pp. 47–50, 1983.
[67]Wang, W., Sun, C., and Chao, H., Color image segmentation and understanding through connected components, In: Proceedings of 1997 IEEE Int’l Conf. on Systems, Man, and Cybernetics, Orlando, FL, Oct. 12–15, 1997, Vol. 2, pp. 1089–1093.
[68]Castellanos, R., Castillo, H., and Mitra, S., Performance of nonlinear methods in medical image restoration, SPIE Proc. Nonlinear Image Process., Vol. 3646, 1999.
[69]Jain, A. K. and Dubes, R. C., Algorithms for Clustering Data, Prentice Hall, Englewood Cliffs, NJ, 1988.
[70]Johnson, K. A., and Becker, J. A. The Whole Brain Atlas, available at: http://www.med.harvard.edu/AANLIB/.

Chapter 7
Automatic Analysis of Color Fundus Photographs and Its Application to the Diagnosis of Diabetic Retinopathy
Thomas Walter1 and Jean-Claude Klein1
7.1 Introduction
Medical image processing is the meeting of two sciences that behave in completely different ways. While medicine is a science where experience plays a majors role and where the practical use is evident, image processing—as a derivative of applied mathematics—is a more theoretical discipline. Hence, the conditions of this meeting need to be analyzed sophisticatedly; not everything possible to implement is useful, and not everything useful is possible to implement.
In this introductory part, we describe the biomedical context and the clinical motivation of the methods presented in this chapter.
7.1.1 The Anatomy of the Fundus
Diabetic retinopathy affects—as the name tells us—the retina, a layer of the back of the eyeball (also called fundus). In this section, we describe briefly its anatomy.
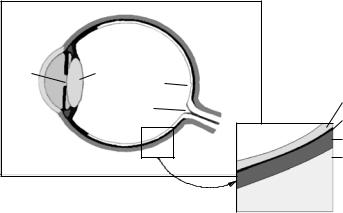
The fundus consists of three layers (see also Fig. 7.1):
1 Centre of Mathematical Morphology, Paris School of Mines, Fontainebleau, France
315
316 |
Walter and Klein |
Pupil |
Lens |
|
|
|
Macula |
|
Retina |
|
Optic disk |
Pigment epithelium
Choroid
Sclera
Figure 7.1: The anatomy of the eye.
Sclera: The tough outer part of the eye.
Choroid: A spongy layer filled with blood vessels. Its main function is to nourish the retina.
Retina: The innermost layer of the eyeball. Place where the image created by the lens is focused and transformed into nerve impulses which are then sent to the brain via the optic nerve.
The retina itself can be divided into two layers: The photoreceptor layer and the pigment epithelium (sometimes, the latter one is introduced not as a part of the retina, but as a layer of its own). The pigment epithelium has metabolic functions; it lies between the photoreceptor layer and the choroid and it is densely packed with pigment granules.
The cells responsible for the transformation of light into nerve impulses are the rods and the cones. They are not distributed uniformly on the retina: The concentration of the cones—responsible for daylight vision—is maximal in the macula, the center of vision.
Once the light has been transformed into a nerve impulse, the information has to be transported to the brain. This is done by the optic nerve that enters the eye by the optic disk (or papilla). The papilla does not contain any photoreceptor; it is also called the blind spot.
The retinal vessels that nourish the retinal tissue also enter by the optic disk: Only the macula is exclusively nourished by the choroidal layer and is therefore not vascularized.
Analysis of Color Fundus Photos and Its Application to Diabetic Retinopathy |
317 |
These three features—the macula, the papilla, and the vascular tree—are the main anatomical features of the retina.
The retina can be seen as an exterior part of the brain; it is highly specialized and complicated. There are many diseases that can affect this part of the eye and one of the most important is diabetic retinopathy.
7.1.2 Diabetic Retinopathy
Diabetic retinopathy is a severe and widespread eye disease. In fact, it is the leading cause of legal blindness for the working age population (between 20 and 64) in western countries. Diabetic retinopathy is a complication of diabetes mellitus and its prevalence increases with the duration of the disease. After 15 years of diabetes, the prevalence lies near 98%, so nearly all diabetic patients are affected by this disease after some time. Although not all the forms of the disease coincide with vision alteration, about 2% of the diabetic patients are blind and 10% suffer from vision loss after 15 years of diabetes [1].
This shows that diabetic retinopathy is a very frequent eye disease, but the situation shall become even worse in the future. The number of diabetics in the world is strongly increasing; a number of 300 millions of diabetic patients is expected for the year 2025. Hence, diabetic retinopathy is a major problem for an increasing number of persons, and also for the national health systems. According to [2], blindness due to diabetic eye disease produces costs of about 500 millions dollars a year in the United States.
7.1.2.1 The Evolution of Diabetic Retinopathy
Diabetic retinopathy is a silent disease, i.e. in its early stages, it is asymptomatic and vision is not altered. Vision impairment and blindness are the consequences of the complications of this disease, not of the disease itself. The starting point of the disease is the elevation of glucose in the blood which results in alterations of the vascular walls, like microaneurysms, the first unequivocal sign of the disease (see Fig. 7.2). This first abnormality causes two phenomena:
Capillary occlusions due to modifications in the capillary walls result in local ischemia (a region in the retina which is no longer supplied with blood) accompanied by hemorrhages. If this ischemia is relatively large, it may give rise to new vessels which proliferate on the surface of the
318 Walter and Klein
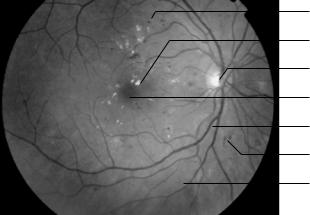
Microaneurysm
Exudate
Optic disk
Macula (centre de la vision)
Retinal Vessel
Hemorrhage
Choroidal vessel
Figure 7.2: Image of the fundus.
retina. These new vessels are normally weak and may cause vitreous hemorrhages, which are one of the main reasons for irreparable vision impairment and blindness due to diabetic retinopathy.
Because of alterations of the vascular walls, the vessels become hyperpermeable. As a consequence, extracellular liquid can pass the wall and may accumulate under the retina building a retinal edema. If situated in the macula, the center of vision, it is called macular edema; it is accompanied by exudates in the macular region (intraretinal deposits made of serum lipoproteins, see Fig. 7.2) and it represents one of the main reasons for vision loss.
Both of these two main complications can be prevented by an adapted treatment if the disease is detected early enough. Hence, early diagnosis of diabetic retinopathy is essential for the prevention of vision impairment and blindness threatening a large number of patients.
7.1.3Application of Image Analysis to the Diagnosis of Diabetic Retinopathy
From a medical point of view, there are three main domains of algorithms which can be conceived for the improvement of diagnosis of diabetic retinopathy:
Analysis of Color Fundus Photos and Its Application to Diabetic Retinopathy |
319 |
1.Image enhancement: Images taken at standard examinations are often noisy and poorly contrasted. Over and above that illumination is normally not uniform. Techniques improving contrast and sharpness and reducing noise are therefore required.
2.Mass screening: Computer-assisted mass screening is certainly the most important task to which image processing can contribute. We have already seen that the blinding complication of diabetic retinopathy can be inhibited by early treatment. However, as vision normally alters only in the later stages of the disease, many patients remain undiagnosed in the earlier stages of the disease. Hence, mass screening of all diabetic patients would help to diagnose this disease early enough. Unfortunately, this approach is not very realistic, taking into consideration the large number of diabetic patients compared to a lack to specialists. Computer assistance could make mass screening a lot more efficient.
3.Monitoring: Comparing images taken at different examinations allows one to evaluate a treatment or new therapeutics. However, it is a time-consuming task and open to human error. Computer-based comparison including automatic registration and evaluation of changes between images could deliver a precious tool for monitoring the disease.
We have seen in this introductory section that diabetic retinopathy is a real problem for a high number of diabetic patients and even for our health systems. We have also seen possible approaches of computer assistance that may help to overcome actual problems in its diagnosis.
Of course, giving detailed solutions to all these problems would go over the scope of this paper. After having analyzed the nature of color in fundus photographs and after having given a short introduction into mathematical morphology, a nonlinear image-processing technique our algorithms are mainly based on, we will describe in detail some algorithms within this framework: We will present an algorithm for image enhancement, algorithms for the detection of the vessels and the optic disk, and finally algorithms for the detection of characteristic lesions like microaneurysms and exudates. These segmentation algorithms are essential for computer-assisted screening and monitoring systems.
320 |
Walter and Klein |
7.2Interpretation of the Color of Retinal Images
Color images are becoming increasingly important for the diagnosis of diabetic retinopathy; their acquisition is cheap, noninvasive, and easy to perform. It is only in the last decade that they have become—due to considerable technical improvement of their acquisition—really important for the diagnosis of this disease. Before, fluorescein angiographies have been used for years. Although the latter ones still allow detection of microaneurysms—the lesion characteristic to diabetic retinopathy—with a greater sensitivity, they are invasive and costly and therefore not adapted for screening purposes.
In this section, we discuss the color content of fundus images, and we deduce a color representation which is adapted for automatic treatment.
7.2.1 The Spectral Response of the Fundus
The reflectance of the fundus strongly depends on the wavelength of the incident light. It is very high for the red light [3]; this is why fundus images seem to be “reddish.” However, this does not mean that the response to red light reveals most information about the retina. In order to analyze the information content of the color, we have to analyze, more precisely, the process of reflection at and absorption in the different layers of the inner eye (see [27] for a detailed discussion).
In [4] and [3], a radiation transport model is proposed that helps understanding the color content of fundus images. The light enters the eye by the pupil and transverses the layers of the inner eye. In all layers, there is a part of this incoming light which is absorbed, a part which passes the layer, and another part which is reflected. It is this last part of the light that characterizes the perceived color. The transmission, absorption, and reflection of light with a given wavelength depend mainly on the tissue properties, mainly on the concentration of the two pigments melanin and hemoglobin.
The light in the blue spectrum is strongly absorbed by both melanin and hemoglobin. This is one of the main reasons why the reflected light does not contain a lot of blue: It is nearly entirely absorbed in the pigment epithelium layer. Furthermore, the dispersion of the light depends on its wavelength and it
Analysis of Color Fundus Photos and Its Application to Diabetic Retinopathy |
321 |
L/Moles/mm) |
|
|
Hemoglobin |
|
|
|
Melanin |
|
|
|
|
|
|
|
Molar extinction coefficient (10000 |
1 |
|
|
|
|
|
|
|
|
|
0 |
|
|
|
|
400 |
500 |
600 |
700 |
|
|
|
Wavelength |
|
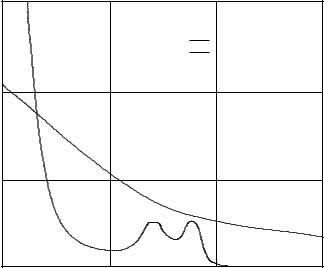
Figure 7.3: The extinction coefficient of hemoglobin and melanin depending on the wavelength of the incoming light.
is stronger for smaller wavelength. As a consequence, opacities disturb the blue light more than light of other wavelengths.
Green light is also absorbed by the two pigments, but less than blue light. We can also observe in the Fig. 7.3 that the absorption coefficient has a peak for the green light. As a consequence, features containing hemoglobin absorb more green light than the surrounding tissue; they appear dark in images taken with green light. The green light is reflected on the pigment epithelium and it does not enter into the choroidal layer.
Red light, in contrary, whose absorption by hemoglobin and melanin is quite weak, penetrates deeper into the layers of the inner eye; it is mainly reflected at the sclera. Hence, the red part of the reflected light comes from the choroidal layer or the sclera; it does not contain much information about the retina itself.
7.2.2 RGB Representation
These considerations explain why the use of green light is very advantageous for the analysis of the retina, particularly for the visualization and analysis of blood containing elements. The RG B representation of the color image allows