

Kluwer - Handbook of Biomedical Image Analysis Vol
.2.pdf212 |
Kallergi, Hersh, and Manohar |
2.Choose W, T, A, m > 1, and ε > 0.
3.Initialize U0 = [U d|U0u], with U0u Mfcn.
4.Compute initial cluster centers using Eq. (4.3).
5.For t = 1, 2, . . . , T do the following:
(i)compute the uiku ,t from Eq. (3.4)
(ii)compute error as Utu − Utu−1
(iii)if error is ≤ ε stop; else compute vi,t from Eq. (4.6)
(iv)continue to the next t
In ssFCM, centers of smaller clusters may be prevented from migrating toward larger clusters by giving high weights to the training data that correspond to the smaller clusters.
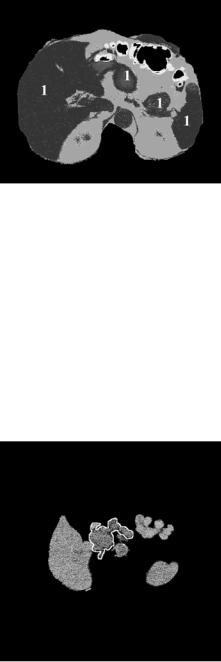
All FCM versions described previously have been implemented in our laboratory. Preliminary results for pancreatic cancer imaging have been obtained with the unsupervised FCM algorithm and these will be discussed in the following sections. For our pilot work, the number of clusters was set to 4 and FCM was applied in two stages. Specifically, in the first run, FCM was applied to the CT image after the external signals were removed to cluster all major organs in the same class as shown in Figs. 4.13 and 4.14 for the original slices of Figs. 4.6(a) and 4.7(a). In these figures, all major organs, including the pancreas, are grouped in the same class labeled as 1. Class 1 pixels were then remapped to the pixel values in the original CT image and FCM was applied to this selected
Figure 4.13: Unsupervised FCM on Fig. 4.6(a).
Automatic Segmentation of Pancreatic Tumors in Computed Tomography |
213 |
Figure 4.14: Unsupervised FCM on Fig. 4.7(a).
area for a second time using the same parameters. The output of the second run is shown in Figs. 4.15 and 4.16. Although not immediately evident in a grayscale representation, four pixel clusters were identified in these images. One of these clusters (encompassed by a white outline) corresponds to the pancreatic tumors indicated by arrows in Figs. 4.6(a) and 4.7(a) and the pancreas.
Several issues remain to be addressed in this FCM application including
(a) what is the appropriate number of clusters to differentiate between tumor and nontumor pancreatic areas, (b) how many labeled data are needed for
Figure 4.15: Segmentation results obtained from applying the FCM algorithm to the area defined by class 1 pixels in Fig. 4.13. The white outline indicates the cluster that corresponds to the pancreas and tumor pixels.

214 |
Kallergi, Hersh, and Manohar |
Figure 4.16: Segmentation results obtained from applying the FCM algorithm to the area defined by class 1 pixels in Fig. 4.14. The white outline indicates the cluster that corresponds to the pancreas and tumor pixels.
training to reduce misclassification, (c) in what proportion the weights should be assigned for each cluster, (d) what is the optimum stopping criteria, , (e) can we avoid the two-stage application by removing unwanted signals further or by reducing the region of interest on which to apply FCM, and (f) validation of the clustering results relative to ground truth files.
Finally, a semisupervised algorithm is currently applied for pancreatic tumor clustering. In this ssFCM, a small subset of feature vectors (or pixels) is labeled by a radiologist, expert in CT interpretation, and used as training information to define the clusters. The disadvantage of ssFCM is that it requires the expert’s input through the selection of training pixels for the tissue classes in an image. On the other hand, ssFCM is less likely to be adversely affected by imperfect training data than its fully unsupervised counterpart and it may be more efficient, i.e., it could achieve better results than FCM for the same number of classes (4). From a practical perspective, and assuming that the results from this algorithm turn out to be more robust and consistent, it is not clinically impractical and may also be advantageous to have the expert initiate the ssFCM process during CT image review. Alternative methods under consideration is the optimization of FCM by combining it with a validity-guided clustering technique [50] or a knowledge-based system [54], or a genetic algorithm technique [55] that have shown potential for improvement. Finally, the imaging characteristics of the
Automatic Segmentation of Pancreatic Tumors in Computed Tomography |
215 |
pancreatic tumors and nonimage, demographic information could be merged to guide cluster initialization and tissue classification. All these options are topics of future investigations.
4.4.6 Validation
Our pilot study on pancreatic cancer did not include a validation step due to the small number of the tested images to date. However, the evaluation of the clustering and segmentation outputs is expected to be a major part of this application. Hence, we will close our algorithm description with few remarks on segmentation validation issues and a summary of the measures proposed for this purpose.
Validation requires a gold standard segmentation that represents the “absolute truth” on the size and shape of the object of interest. The lack of a gold standard or absolute ground truth in most medical imaging applications does not allow an absolute quantitative evaluation of the segmentation output. The best and often only, option available is segmentations generated by expert observers that may be biased and also exhibit significant interand intraobserver variability. In some cases, an alternative approach to the direct evaluation of segmentation results is the use of simulation or phantom studies, [69] the use of relative performance measures, or the use of classification outcomes [70].
The goal of validation in our application is to demonstrate that the automatic methods proposed for the segmentation of pancreatic tumors will lead to standardized and more reproducible tumor measurements than the manual and visual estimates performed traditionally by experts. Tumor size, area, and volume are parameters currently used to determine tumor resectability, and response to treatment. Greater accuracy, less variability, and greater reproducibility in these measurements is expected to have a significant impact on the diagnosis and treatment of pancreatic cancer [71].
An indicated in Fig. 4.8, a postprocessing step is usually applied to the clustered data prior to validation in order to generate smooth contours of the organs and tumors that can then be compared to those in the truth files; see for example the truth files in Fig. 4.10 and the FCM segmentations (white outlines) of Figs. 4.15 and 4.16). From the measures available for segmentation validation, [72] we have selected and implemented those that are recommended for medical imaging applications and are particularly suited for the comparison of

216 |
Kallergi, Hersh, and Manohar |
computer-generated to hand-drawn boundaries [73–75]. In addition, they are relatively computationally efficient and are not limited to specific shape patterns. These measures are as follows [74]:
1.The Hausdorff distance h( A, B) between two contours of the same object (tumor), one generated by an expert ( A) and one generated by the computer (B).
Let A = {a1, a2, . . . , am} and B = {b1, b2, . . . , bm} be the set of points on the two contours (each point representing a pair of x and y coordinates) then the distance of a point ai to the closest point on curve B is defined as
d(ai, B) = min b j − ai
j
Similarly the distance of a point b j to the closest point on curve A is defined as
d(b j , A) = min ai − b j
i
The Hausdorff distance h( A, B) is defined as the maximum of the above distances between the two contours, i.e.
h A, B |
) |
= |
|
i {d(ai, B)}, |
j |
{d |
b j , A } . |
( |
|
max |
max |
max |
( |
) |
2.The degree of overlap OL between the areas G and E encompassed by contours A and B. The overlap is defined as the ratio of the intersection and the union of the two areas, i.e, the ground truth area Gand the experimental computer generated area E:
OL = G ∩ E
G E
The ratio is 1 if there is perfect agreement and 0 if there is complete dis-
agreement.
3.The mean absolute contour distance (MACD). MACD is a measure of the difference between the two contours. To estimate MACD, a one-to-one correspondence between the points of the two curves is required. Once this correspondence is established, the distances between corresponding points are estimated; their average corresponds to MACD. In addition to the absolute differences entering the MACD calculation, the signed distances between the curves may also be computed and used to determine the bias
Automatic Segmentation of Pancreatic Tumors in Computed Tomography |
217 |
of an algorithm or any regional effects on the segmentation process, i.e., pancreatic areas closer to the liver may be less accurately segmented than areas away from large organs [74].
The first two measures above are sensitive to the size and shape of the segmented objects and also depend on the image spatial resolution. The third measure is independent of object size and image resolution and preferred if images from different sources are to be compared.
Alternatively to custom-made routines, the VALMET segmentation validation software tool that is publicly available could be used to generate these metrics in 2D and 3D [73]. Tools such as VALMET and ITK may offer the standardization missing from the validation of segmentation algorithms and reduce variability. Currently, there is no agreement on the “best method” or “best methods” for analyzing and validating segmentation results. The need for standardized measures that are widely acceptable is significant as is the need for establishing conventions on how to use expert-generated ground truth data in the evaluation process.
In a final note, the reader is reminded that a statistical analysis that measures the agreement between the measured parameters from different segmentation algorithms or the agreement between computer and observer performances should be part of the validation process. Computer and expert data are compared with a variety of statistical tools. The most frequently reported ones include
(a) linear regression analysis to study the relationship of the means in the various segmentation sets [76, 77], (b) paired t test to determine agreement between the computer method(s) and the experts [76, 77], (c) Williams index to measure interobserver or interalgorithm variability in the generation of manual outlines [74], and (d) receiver operating characteristic analysis and related methods to obtain sensitivity and specificity indices by estimating the true positive and false positive fractions detected by the algorithm and/or the observer [78].
4.5 Conclusions
This chapter discussed aspects related to the segmentation of medical images for the purpose of tumor evaluation and treatment assessment. Pancreatic cancer imaging by CT was used as the basis for discussing image segmentation
218 |
Kallergi, Hersh, and Manohar |
issues for medical imaging and CAD applications. It was also used in an effort to open the pancreatic cancer imaging area into possibly more research and discussions considering that it is relatively under-investigated and unknown despite its significant toll on health care.
The current state-of-the-art in CAD methodologies for CT and pancreatic cancer was reviewed and limitations were discussed that led to the development of a novel, fuzzy logic-based algorithm for the clustering and classification of pancreatic tumors on helical CT scans. This algorithm was presented here and its pilot application on selected CT images of patients with pancreatic tumors was used as the basis to discuss issues associated with tumor segmentation and validation of the results.
The problems and difficulties encountered today by the radiologists and the oncologists dealing with pancreatic carcinoma are numerous and they are often associated with the limitations of the current imaging modalities, the observer biases, and the interand intraobserver variability. Among the most striking weaknesses is the inability to detect small tumors, to consistently differentiate between pancreatic tumors and benign conditions of the pancreas putting the patient through several imaging procedures and medical tests, to accurately measure tumor size and treatment effects.
Computer tools could play a diverse role in pancreatic cancer imaging. The primary goal of the system presented here was the automated segmentation of the normal and abnormal pancreas and associated pancreatic tumors from CT images. However, these tools could have a broader and more diverse role in the detection, diagnosis, and management of this disease that could change the current standard of care. Among other applications, CAD methodologies could provide objective measures of pancreatic tumor size and response to therapy that will allow (a) accurate and timely assessment of tumor resectability,
(b) accurate and timely estimates of tumor size as a function of time and treatment, and (c) standardized evaluation and interpretation of tumor size and response to treatment. CAD techniques could further lead to 3-D reconstructions of the pancreas and tumors and impact surgery and radiation treatment.
Validation is and should be a major part of CAD development and implementation. Medical imaging applications, however, present unique problems to CAD validation, e.g., lack of an absolute gold standard, lack of standardized statistical analysis and evaluation criteria, time-consuming and costly database generation procedures, and other. Yet, CAD researchers are asked to find ways to overcome
Automatic Segmentation of Pancreatic Tumors in Computed Tomography |
219 |
limitations and properly validate medical CAD algorithms including those that involve segmentation or clustering. Several options have been proposed in this chapter for this purpose. As we learn more about this area, however, we find that it may be possible to define a new family of validation criteria better suited for medical imaging applications. These criteria are likely to link algorithm performance to actual clinical outcomes. We could use, for example, classification results as a measure of segmentation performance.
4.6 Acknowledgments
We acknowledge the valuable contributions of Dr. Amine Bensaid in the implementation of the fuzzy algorithms for this application. We are also thankful to Angela Salem, Joseph Murphy, Isaac E. Brodsky, and Deepakchandran Chinnaswami for their indispensable assistance in data collection and image processing, as well as in the preparation of this manuscript.
Questions
1.What are the physical characteristics of helical CT scans that may impact CAD algorithm design and performance?
2.What are the clinical characteristics of pancreatic cancer that may impact CAD algorithm design?
3.What is the general approach for image segmentation of medical images?
4.Advantages and disadvantages of unsupervised, supervised, and semisupervised clustering methodologies for image segmentation.
5.What is FCM and when is it used for image segmentation? List any advantages over classical segmentation techniques.
6.What are the differences between FCM and ssFCM? List advantages and disadvantages of the two techniques.
7.List methods that can be used for the optimization of FCM for image segmentation.
220 |
Kallergi, Hersh, and Manohar |
8.What are the metrics used for the validation of a segmentation output?
9.What are the major limitations and problems associated with the validation of segmentation algorithms in medical imaging applications?
10.What are the statistical tools used for the analysis of the segmentation results including tools to determine the agreement between different algorithms and observers or within groups.

Automatic Segmentation of Pancreatic Tumors in Computed Tomography |
221 |
Bibliography
[1]Jemal, A., Thomas, A., and Murray, T., Cancer statistics, 2002, CA Cancer
J.Clin., Vol. 52, pp. 23–47, 2002.
[2]Kern, S., Tempero, M., and Conley, B., (Co-Chairs), Pancreatic cancer: An agenda for action, Report of the Pancreatic Cancer Progress Group, National Cancer Institute, February 2001.
[3]Kuvshinoff, B. W. and Bryer, M. P., Treatment of resectable and locally advanced pancreatic cancer, Cancer Control, Vol. 7, No. 5, pp. 428–436, 2000.
[4]Lin, Y., Tamakoshi, A., Kawamura, T., Inaba, Y., Kikuchi, S., Motohashi, Y., Kurosawa, M., and Ohno, Y., An epidemiological overview of environmental and genetic risk factors of pancreatic cancer, Asian Pacific
J.Cancer Prev., Vol. 2, pp. 271–280, 2001.
[5]Li, D. and Jiao, L., Molecular epidemiology of pancreatic cancer, Int.
J.Gastrointest. Cancer, Vol. 33, No. 1, pp. 3–14, 2003.
[6]Ghadirian, P., Lynch, H. T., and Krewski, D., Epidemiology of pancreatic cancer: an overview, Cancer Detect Prev., Vol. 27, No. 2, pp. 87–93, 2003.
[7]Van Hoe, L. and Baert, A. L., Pancreatic carcinoma: Applications of helical computed tomography, Endoscopy, Vol. 29, pp. 539–560, 1997.
[8]Yeo, T. P., Hruban, R. H., Leach, S. D., Wilentz, R. E., Sohn, T. A., Kern,
D.E., Iacobuzio-Donahue, C. A., Maitra, A., Goggins, M., Canto, M. I., Abrams, R. A., Laheru, D., Jaffee, E. M., Hidalgo, M., and Yeo, C. J., Pancreatic cancer, Curr. Prob. Cancer, Vol. 26, No. 4, pp. 176–275, 2002.
[9]Tamm, E. P., Silverman, P. M., Charnsangavej, C., and Evans, D. B., Diagnosis, staging, and surveillance of pancreatic cancer, AJR, Vol. 180, pp. 1311–1323, 2003.
[10]Clark, L. R., Jaffe, M. H., Choyke, P. L., Grant, E. G., and Zeman, R. K., Pancreatic imaging, Radiol. Clin. North Am., Vol. 23, No. 3, pp. 489–501, 1985.