

Kluwer - Handbook of Biomedical Image Analysis Vol
.2.pdf192 |
Kallergi, Hersh, and Manohar |
Table 4.1: Helical CT imaging characteristics of the normal pancreas and changes induced by pancreatic adenocarcinoma [2, 31, 34–36]
Normal pancreas |
Abnormal pancreas (Adenocarcinoma) |
|
|
Uniform density (image intensity) throughout, slightly lower than that of the liver, no calcifications. Contrast material increases pancreatic density uniformly. Approximately equal density to the spleen, kidneys, and skeletal muscle.
The contour is smooth with a faint lobulation is some cases.
A fat plane usually surrounds the normal pancreas with the exception of very thin patients. The fat plane appears as an area of lower intensity than the gland area on the CT scan.
The anterior–posterior diameter of the normal pancreas averages 3 cm in the head, 2.5 cm in the body, and 2 cm in the tail.
Organ tends to taper uniformly from head to the tail.
Reports suggest that the ratio between the transverse diameter of the accompanying vertebral body and the pancreas can be used as a guide for normalcy.
There is usually a fatty appearance due to the gland’s nature.
Variable imaging characteristics; tumors generally appear isodense to normal pancreatic tissue in enhanced studies. Some adenocarcinomas may show central necrosis or appear as hyperdense areas relative to the rest of the pancreas.
Abrupt transition to the smooth contour may occur due to the presence of a mass.
The fat plane is usually disrupted or disappears due the presence of a mass or other disease.
Changes in the size of the pancreas may occur due to the presence of large masses.
Duct dilation is one of the most significant consequence of pancreatic adenocarcinomas.
Alterations occur in organs and structures adjacent to the pancreas due to the presence of masses.
Gland areas are enhanced with contrast material that could allow separation from normal tissues. Usually appear as hypodense areas due to poor arterial blood supply.
because it is the most common type of pancreatic cancer and, hence, the one better understood. Similar imaging and evaluation procedures are initially followed for all pancreatic tumor types.
All pancreatic tumors are better visualized when intravenous contrast material is used. Only necrotic tumors and very large tumors can be identified without contrast enhancement. Endocrine tumors often have associated calcifications and are less likely to have central necrosis than do adenocarcinomas.
Automatic Segmentation of Pancreatic Tumors in Computed Tomography |
193 |
They also enhance more than normal tissue during the initial phases of contrast administration [36]. Cystic neoplasms have a variety of appearances. They can appear solid secondary to the multiple tiny nonvisible cysts or they can appear as multiple small cysts or as “multilocular-appearing mass” with thin septations [37]. Alterations in the bowel, blood vessels, or ducts within or adjacent to the pancreas may be caused by all types of pancreatic tumors and are important features in the identification of pancreatic abnormalities [38].
Once diagnosed, pancreatic tumors are surgically removed or treated. The resection of pancreatic tumors is based on the identified tumor size and the presence or absence of additional abnormal signs on the abdominal CT scans. Resection is determined by three imaging criteria:
Tumor size (less than 4 cm usually); tumors greater than 5 cm are resectable in less than 10% of the cases.
Vascular invasion, in particular invasion of superior mesenteric artery/vein or portal vein.
Presence of malignant ascites, nodal disease outside of the area of resection, liver metastases, or peritoneal carcinomatosis.
Presence of metastatic disease, involvement of the mesenteric, and invasion of the portal or superior mesenteric vein are all indicators of nonresectable disease [3].
In addition to the imaging characteristics of pancreatic cancer, clinical findings contribute to the diagnosis and management of the disease. Clinical and demographic characteristics that may be useful in CAD development include [3]
age; one of the most significant risk factors for pancreatic cancer.
presence of jaundice that is usually associated with adenocarcinoma of the pancreatic head; resectability rate of pancreatic tumors is noted to be higher in these patients than in patients not presenting with jaundice.
abdominal pain that may be used as a survival predictor; shorter survival intervals are associated with greater pain reported prior to surgery.
weight loss and anorexia symptoms.
diabetes onset.

194 |
Kallergi, Hersh, and Manohar |
Clinical and demographic characteristics play a role in feature selection for clustering and classification. In the past, few CAD application incorporated image and nonimage characteristics in algorithm design. New directions in medical image analysis and processing clearly demonstrate the need to consider the patient as a whole and integrate information from a variety of sources to achieve high performances.
4.3Computer Applications in Pancreatic Cancer Imaging
There is limited development of automatic approaches for the detection and/or diagnosis of pancreatic cancer either from CT or other imaging modalities. This is certainly an area worthy of further investigation and an area identified as in great need of technological advances by the NCI Review Group [2]. Imaging priorities set by the Group have been summarized earlier in this chapter. One of the most interesting recommendation was for a collaborative research and training approach that will link molecular biology, pathology, and imaging as well as for a well documented source of images to support computer applications and image processing [2].
A few common stages may be identified in all algorithms designed for medical imaging applications, including those designed for assisting the interpretation of CT scans. Figure 4.5 presents the basic modules of an algorithm that aims at assisting the physicians in the interpretation of CT images for the detection, diagnosis, and surveillance of disease. Registration and 3-D reconstruction may precede or follow the last stage of “Processing” (shown in Fig. 4.5) depending on
|
|
|
|
|
|
|
|
|
Processing |
Selected |
|
|
External |
|
|
|
|||
|
|
|
|
Image |
|
|
Segmentation |
||
Input CT |
|
|
Signal |
|
|
|
|
Classification |
|
|
|
|
|
Enhancement |
|
|
|||
|
|
|
|
|
|
||||
Image |
|
|
Segmentation |
|
|
|
|
Registration |
|
|
|
|
|
|
|
|
|||
|
|
|
|
|
|
|
|
|
Reconstruction |
|
|
|
|
|
|
|
|
|
|
Figure 4.5: General algorithm design for CT image processing. Processing may include a segmentation, a classification, a registration, a reconstruction step, or any combinations of these.
Automatic Segmentation of Pancreatic Tumors in Computed Tomography |
195 |
the goals of the development. Herein we focus on issues related to 2-D CT processing and, hence, registration and reconstruction will not be discussed other than to mention that significant work exists in the area of CT slice registration and reconstruction but is not necessarily focused on pancreatic imaging [39, 40]. We should also note that registration is necessary to the evaluation of serial (temporal) images of the same patient. For example, in the case of segmentation of the pancreas in multiple, serial scans of a patient that undergoes treatment, registration of CT images obtained at different times may be necessary prior to the assessment of changes from one scan to the next. In the following paragraphs, we will examine each module of the CT image processing algorithm (shown in Fig. 4.5) in more detail.
4.3.1 External Signal Segmentation
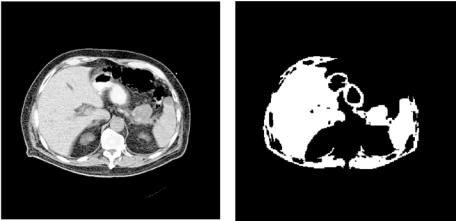
Most of the algorithms developed for CT processing involve an initial step of external signal segmentation. This term refers to the removal of signals from the rib cage and spine that usually interfere with the segmentation of internal organs (see Fig. 4.4). These signals have specific characteristics and are usually of higher intensity (pixel value). Their removal is commonly done by thresholding (global and adaptive), edge detection techniques, region growing, and curve fitting [41].
4.3.2 Image Enhancement
This step is usually done to increase the contrast or reduce the noise in an image to allow for more accurate segmentation in the steps that follow. It usually precedes organ segmentation or registration because it offers the potential of redistributing and rescaling pixel values in order to obtain more successful results in the clustering and classification of pixels. Techniques reported in the literature are designed for the spatial or the frequency domain. Spatial domain methods include logarithmic transformations and power law transformations, histogram equalization, image subtraction and averaging, and image smoothing techniques using spatial filters. Frequency (usually Fourier) domain include lowpass filters and high-pass filters for image smoothing and sharpening respectively [41].
196 |
Kallergi, Hersh, and Manohar |
4.3.3 Processing—Image Segmentation
Automatic segmentation of CT images admittedly presents significant challenges in computer vision [42]. The primary reason is that the organs are flexible and their size and shape varies as a function of patient characteristics and imaging parameters. Organs are usually accurately localized on CT slices (Fig. 4.4.) but the detection and separation of their boundaries from those of their neighbors and the background is often a difficult task due to the obscure, fuzzy, and irregular edges that are often superimposed by other structures [33, 42]. Even human experts have difficulty in providing unambiguous outlines of the organs’ boundaries and consequently present significant interand often intraobserver variability, the magnitude of which is a function of experience and training. Historically, standard techniques, such as absolute thresholds, edge detection, and region growing algorithms that perform some type of operation on the gray level distribution of the image pixels are not, by themselves, sufficient for CT segmentation. Combinations of modules, as the one shown in Fig. 4.5, and advanced approaches, e.g., knowledge-based segmentation [42], are necessary to solve this problem.
Several methodologies are reported in the literature for CT slice segmentation although not necessarily focused on pancreatic tissue or pancreatic tumor segmentation. Methods proposed for organ segmentation in CT slices include pixel based (thresholding), edge based, region based, and clustering methods [43]. Interactive segmentation of various organs has also been proposed for 3-D visualization. The reported work used simple thresholding and morphological operations that were interactively controlled by a human user via a 3-D display [44].
There are several free software packages that can be used for the segmentation and registration of CT slices. One of them funded by the National Library of Medicine (NLM) is the Insight Segmentation and Registration Toolkit (ITK) and can be downloaded from www.itk.org. ITK is open-source software that was developed jointly by six principal organizations to support the Visible Human project of NLM. ITK includes several basic segmentation and registration techniques that have been implemented for a variety of medical image analysis applications. In this work, we experimented with several of the methods implemented in ITK. Particularly, region based, threshold select, geodesic active contour segmentation, and fuzzy connectedness with Voronoi classification

Automatic Segmentation of Pancreatic Tumors in Computed Tomography |
197 |
Figure 4.6: (a) Original helical, contrast enhanced CT slice with a tumor at the head of the pancreas indicated by black arrow. (b) Region based segmentation using ITK software on Fig. 4.6(a).
were some of the techniques tested for the segmentation of the pancreas and pancreatic tumors. Initial results suggested that region growing was the best approach because most of the other techniques clustered the majority of the structures in the image together not allowing separation of the pancreas from the other organs. But even with region growing, the pancreas and associated tumor could not be separated from the liver if the pancreatic structures were to remain in the segmented image; separation occurred at the expense of losing most of the information from the gland and associated tumor. Representative segmentation outputs from the region growing approach of ITK are shown in Figs. 4.6(b) and 4.7(b) for two CT slices that contain a mass at the head (Fig. 4.6(a)) and tail (Fig. 4.7(a)) of the pancreas respectively. It should be noted that, although not fully optimized for this application, the tools included in ITK are not likely to yield, by themselves, the desired segmentation outcome because of the low contrast differences between adjacent organs and the way region growing operates. The initial problems we identified in the application of conventional segmentation techniques on CT images of the pancreas include the following:
1.Gray tone segmentation algorithms do not produce accurate regions of the target organ. This is because two different regions of the pancreas or two different organs can have the same or similar gray level tones in CT
198 |
Kallergi, Hersh, and Manohar |
Figure 4.7: (a) Original helical, contrast enhanced CT slice with a pancreatic tumor at the tail of the pancreas indicated by white arrow. (b) Region based segmentation using ITK software on Fig. 4.7(a).
images. Hence, differentiation based on gray level alone is not likely to yield consistent and robust results.
2.The shape of the various organs in the CT slices is not always well defined or consistent from slice to slice. So, it is difficult to select generally applicable characteristics. CAD development is likely to require an adaptive process to deal with this variability.
3.Thresholding techniques based on single global values are not likely to succeed because the gray values of the organs are case-dependent. Gray values depend on the chemical contents of each organ and the physical condition and characteristics of the patient. Gray level normalization may provide a solution to this problem but should be done consistently across slices within the same scan so that it does not prevent registration and reconstruction processes. It should also be done with consideration of the variations among different cases, pathologies, and image sources.
Despite limited performances, however, some of the conventional segmentation techniques, including those implemented in ITK, could be used in the first segmentation step for external signal removal and/or removal of uninteresting structure(s) within the slice, e.g., spleen or kidneys, and isolation of major
Automatic Segmentation of Pancreatic Tumors in Computed Tomography |
199 |
organs including the pancreatic areas. This could make the job of subsequent segmentation steps easier and more successful.
4.3.4 Processing—Classification
Very few methodologies have been developed for the classification of pancreatic tumors, e.g., the differentiation between benign and malignant disease or even the differentiation between normal and abnormal pancreas or pancreatic areas reported. One application used several classification schemes to differentiate between pancreatic ductal adenocarcinoma and mass-forming pancreatitis. The methods included artificial neural network classifiers, Bayesian analysis, and Hayashi’s quantification method II [45]. The approach used radiologist-extracted CT features for the classification and no automatic segmentation or feature identification was performed. Results indicated that all computer techniques performed similarly to expert radiologists and had no significant benefits [45]. The classification task adds another level of difficult to the segmentation. It is reasonable to hypothesize that classification my be successful if automated feature extraction is performed or when image and nonimage features are merged in the feature set.
4.4A Novel Algorithm for Pancreatic Tumor Detection and Classification
Fuzzy-based segmentation and classification techniques have been used in various medical imaging applications although not pancreatic cancer [46–48]. An application closest to CT pancreatic imaging with analogous problems is the magnetic resonance imaging (MRI) of the brain and brain tumors. Unsupervised, supervised, and semisupervised fuzzy c-means (FCM) algorithms and knowledge-guided FCM segmentation have been successfully applied to brain tumor MRI applications [49–55]. Similar approaches have also shown promising results for breast tumor segmentation in mammography [56], and lung nodule segmentation on CT images [57]. Here, we present the implementation and initial performance of an FCM based algorithm for pancreatic tumor segmentation and tumor measurements on 2D CT slices. Figure 4.8 presents a flowchart of

200 |
|
|
|
|
|
|
|
|
|
|
|
Kallergi, Hersh, and Manohar |
||||||
|
|
|
|
|
|
|
|
|
|
|
|
|
|
|
|
|
||
|
|
|
|
|
|
|
|
Electronic |
|
|
|
|
|
|
|
|||
|
|
|
|
Database |
|
|
|
Ground |
|
|
|
|
|
|
|
|||
|
|
|
|
|
|
|
|
Truth Files |
Post- |
|
|
|
||||||
|
|
|
|
|
|
|
|
|
|
|
|
|
||||||
|
|
|
|
|
|
|
|
|
|
|
|
Processing |
|
|||||
|
|
|
|
|
|
|
|
|
|
|
|
Fuzzy Processing |
|
|||||
|
|
|
|
|
|
|
|
|
|
|
|
|
|
|
|
|
|
|
CT |
|
|
|
External |
|
|
Pre- |
|
|
|
Organ |
|
|
|
|
|
||
|
|
|
Signal |
|
|
|
|
|
Clustering |
|
|
|
|
Validation |
||||
Slice |
|
|
|
|
|
Processing |
|
|
|
|
|
|
|
|||||
|
|
Segmentation |
|
|
|
|
|
|
|
|
|
|
|
|
||||
|
|
|
|
|
|
|
|
|
|
|
|
|
|
|||||
|
|
|
|
|
|
|
|
|
|
|
|
|
|
|
|
|
||
|
|
|
|
|
|
|
|
|
|
|
|
Tumor |
|
|
|
|
|
|
|
|
|
|
|
|
|
|
|
|
|
|
|
||||||
|
|
|
|
|
|
|
|
|
|
|
|
Classification |
|
|
|
|
|
|
|
|
|
|
|
|
|
|
|
|
|
|
|
|
|
|
|
|
|
Figure 4.8: Block diagram of CAD algorithm developed for the clustering and classification of pancreatic tumors on helical CT scans.
the design and implementation of the algorithm. The designed CAD scheme follows the general principles presented in Fig. 4.5 but includes additional steps for postprocessing and validation that will be discussed in more detail below.
4.4.1 Medical Image Database
Data collection and database generation is one of the most critical components of algorithm development and one that raises most criticisms and concerns in the scientific community. Datasets are the basis for initial design, training, and testing of the algorithms and together with the analysis tools are key in any validation effort. Given the attention they usually receive and the controversy they sometimes stir, we will review here some of the most important aspects of medical image databases.
Medical imaging data are usually collected retrospectively from completed patient files. Data collection and documentation involves significant amounts of time and effort that is often underestimated. The general guidelines followed in the generation of a database for the particular application of pancreatic cancer are as follows [5, 58–61]:
1.Collect both image and nonimage data and generate complete cases.
2.Review imaging, clinical, and demographic characteristics of the disease and ensure representation of the majority of case types. If this is not
Automatic Segmentation of Pancreatic Tumors in Computed Tomography |
201 |
possible, prioritize and focus on selected groups that define the most important clinical problems.
3.Review clinical records of institution to ensure availability and adequacy.
4.Define desired number of cases in overall dataset as well as in subsets needed to address specific problems in addition to the main goal of the effort. Number of cases depends on the training requirements of the selected methodology and the statistical power needs of clinical evaluation studies such as the receiver operating characteristic experiments.
5.Digitize films from analog modalities at the highest possible resolution (spatial and dynamic) and reduce, if necessary, using mathematical interpolation.
6.Generate ground truth information preferably based on pathology information. If this is not possible, use medical experts properly screened to define and outline ground truth on the selected images. Although this approach is subject to high interand intraobserver variability, it is often the only possible option. Hence, it is critical for the researcher to develop standardized methods for ground truth file generation, same for all experts, and take any step to eliminate external factors of variability. It is also recommended that all experts’ opinions are used in validation instead of the most often occurring response, the union, or overlap of opinions. For computer applications the generation of ground truth information in electronic form is highly desirable and it usually contains outlines of the areas of interest drawn by one or more experts that provides information on the type, location, and size of the area. Electronic ground truth files are discussed in more detail below.
7.Define validation criteria, namely what will be considered as true positive (TP), false positive (FP), true negative (TN), and false negative (FN) for a segmentation or classification outcome. Segmentation validation is usually more demanding and cumbersome process. The existence of specific conventions and consistent criteria in the evaluation of segmentation results is often more important than the variability in ground truth information provided by experts.