

Kluwer - Handbook of Biomedical Image Analysis Vol
.2.pdf152 |
Wong |
Figure 3.11: Single slice of simulated 2-[11C]thymidine PET study. Top row shows the original reconstructed images at (a) 15 sec, (b) 75 sec, (c) 135 sec,
(d) 285 sec, (e) 1020 sec, and (f) 2850 sec postinjection. Bottom row shows same slice at identical time points after cluster analysis. Individual images are scaled to their own maximum.
Application of the clustering algorithm to the simulated PET data is shown in Fig. 3.11. The number of clusters is eight, corresponding to the optimum number of clusters determined by the statistical criteria. The SNR of the images is markedly improved after clustering. In addition, the blood vessels are clearly seen in the frame sampled at 15 and 75 sec after clustering but not in the corresponding frame in the original data. In the original images, it is difficult to identify different tissues which may be due to reconstruction effects and inhomogeneous noise. However, the liver, spleen, muscle, marrow, stomach, and tumors are clearly delineated by the clustering algorithm (bottom row of the figure).
3.6.4.2 Simulated FDG-PET Study
Five cluster images were generated by applying the clustering algorithm to the noisy simulated dynamic images. The number of clusters k was actually varied from 3 to 10 and the optimal k was determined by inspecting the change of average MSE and the visual quality of the cluster images. Figure 3.12 shows the cluster images for k = 5 that was found to be the optimum number of clusters for this dataset. It was found that the tumor cannot be located when k was small (k < 4). The tumor was located by gradually increasing the number of clusters. However, there was a deteriorated segmentation of all regions when k was large (k > 7).

Medical Image Segmentation |
153 |
a |
b |
c |
d |
e |
Figure 3.12: Five cluster images obtained from the noisy simulated dynamic FDG-PET data. The images correspond to (a) ventricles and scalp, (b) white matter and left middle temporal gyrus (hypometabolic zone), (c) partial volume between gray matter and white matter, (d) gray matter, deep nuclei, and outer rim of tumor, and (e) tumor.
Although the tumor was small in size, cluster analysis was still able to locate it because of its abnormal temporal characteristics as compared to the other regions. Cluster analysis also performed well in extracting underlying tissue kinetics in gray matter and white matter because of their distinct kinetics. On the contrary, the kinetics in the thalamus and the hypometabolic region were not separated from those in gray and white matter but this was not unexpected since their kinetics were very similar.
Owing to the partial volume effects (PVEs), there were some vague regions whose kinetics were indeterminate (Fig. 3.12(c)) and did not approach gray or white matter. The algorithm was unlikely to assign such kinetics to the cluster corresponding to white matter or to the cluster corresponding to gray matter since the overall segmentation results would be deteriorated. Thus, a cluster was formed to account for the indeterminate kinetics.
3.6.4.3 Human Studies
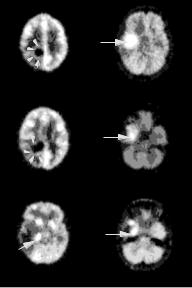
Segmentation results are shown for dynamic neurologic (Fig. 3.13) and lung (Fig. 3.14) FDG-PET studies. The clusters are represented by differing gray scales and slices were sampled at the level where the lesions were seen on the original reconstructed data. Since there is no a priori knowledge about the optimum number of clusters, the value of k was varied in order to determine the optimal segmentation using the AIC and SC as in the phantom study. For Fig. 3.13, eight clusters were found to give the optimal segmentation for these datasets. The locations of the tumors and the rim of increased glucose uptake
154 |
Wong |
a |
d |
b e
c |
f |
Figure 3.13: Tissue segmentation obtained from Patient 1 at (a) slice 10,
(b) slice 13, and (c) slice 21; and Patient 2 at (d) slice 21, (e) slice 24, and
(f) slice 26. The number of clusters used is eight. The locations of the solid hypermetabolic portions of the tumors (arrows) and the small rim of increased glucose uptake (arrow heads) identified by cluster analysis are shown.
are identified correctly by the clustering algorithm with the optimal value of clusters.
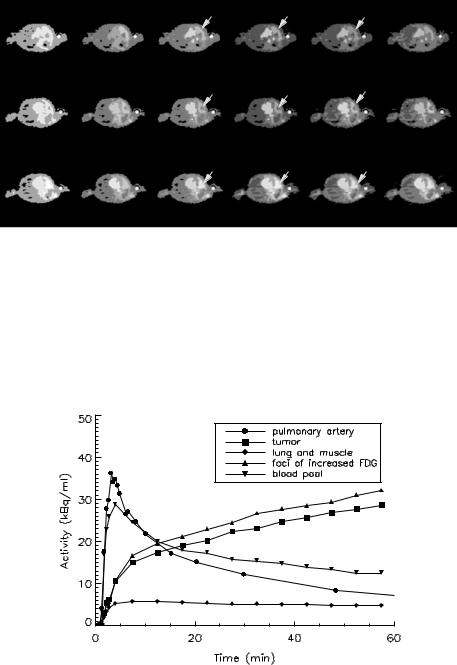
For Fig. 3.14, the number of clusters was varied from 3 to 13 and only some representative results are shown. Similar to the simulation study, the segmentation results are poor when the number of clusters is small (k = 3), while the segmentation is gradually improved by increasing the number of clusters. Based on the AIC and SC, the optimum numbers of clusters for the selected slices (4, 19, and 24) were found to be 8, 8, and 9, respectively. It is not surprising that the optimum number of clusters is different for different slices because of the differing number of anatomical structures contained in the plane and the heterogeneity of tracer uptake in tissues. Nevertheless, the tumor (slice 4), right lung and muscle (slices 4, 19, and 24), blood pool (slices 4, 19, and 24), separate foci of increased FDG uptake (slices 19 and 24), and the injection site (slices 4, 19, and 24) are identifiable with the optimum number of clusters.
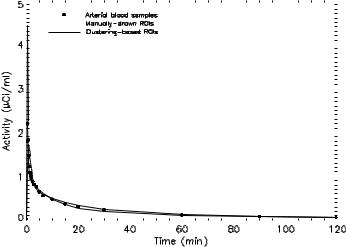
Figure 3.15 shows the measured blood TAC at the pulmonary artery and the extracted tissue TACs for the tumor (from slice 4), lung and muscle (from
Medical Image Segmentation |
|
|
|
|
|
|
|
155 |
|
|
|
|
T |
|
|
T |
|
|
T |
|
L |
B |
I |
L |
B |
I |
L |
B |
I |
|
|
|
T |
|
|
T |
|
|
T |
|
|
|
|
|
|
|
|
||
|
L |
B |
I |
L |
B |
I |
L |
B |
I |
|
|
|
T |
|
|
T |
|
|
T |
|
L B |
I |
L |
B |
I |
L |
B |
I |
|
a |
b |
c |
|
|
d |
|
|
e |
f |
Figure 3.14: Tissue segmentation of the dynamic lung FDG-PET data from Patient 3 in three selected slices: 4 (top row), 19 (middle row), and 24 (bottom row) with different number of clusters. (a) k = 4, (b) k = 7, (c) k = 8, (d) k = 9,
(e) k = 10, and (f) k = 12. (I = injection site; B = blood pool; L = lung; T = tumor).
Figure 3.15: Extracted tissue time–activity curve (TACs) corresponding to the tumor, lung, and muscle, foci of increased FDG uptake, and blood pool. The measured blood TAC at the pulmonary artery is also shown.

156 |
Wong |
Table 3.2: Compartmental modeling of the tumor TACs obtained by
manually ROI delineation and by cluster analysis
Parameter |
Manual delineation |
Cluster analysis |
||||
|
|
|
|
|
|
|
1 |
0.854 |
± |
17.1 |
0.921 |
± |
18.2 |
k (ml/min/g) |
± |
± |
||||
2 |
1.987 |
21.2 |
2.096 |
22.5 |
||
k (min−1 ) |
± |
± |
||||
3 |
0.099 |
0.9 |
0.100 |
0.9 |
||
k (min−1 ) |
± |
± |
||||
4 |
0.018 |
1.1 |
0.017 |
1.2 |
||
k (min−1 ) |
|
|
||||
K (ml/min/g) |
0.041 |
± 5.3 |
0.042 |
± 5.3 |
||
TAC: Time–activity curve; ROI: region of interest. Values are given as estimate ±% CV.
slice 19), foci of increased FDG uptake (from slice 24), and the blood pool (from slice 19) using the corresponding optimal value of clusters.
The extracted tissue TACs obtained by cluster analysis and manual ROI delineation were fitted to the three-compartment FDG model using nonlinear least squares method and the results obtained for the tumor tissue TAC (Patient 2) are summarized in Table 3.2. There was a close agreement between the parameter estimates for the tissue TACs obtained by different methods in terms of the estimate and the coefficient of variation (CV), which is defined as the ratio of the standard deviation of the parameter estimate to the value of the estimate. Similar results were also found for other regions.
3.7Extraction of Physiological Parameters and Input Function
Quantification of dynamic PET or SPECT data requires an invasive procedure where a series of blood samples are taken to form an input function for kinetic modeling. One of the potential applications of the clustering algorithm presented earlier is in noninvasive quantitative PET. We have proposed a simultaneous estimation approach to estimate the input function and physiological parameters simultaneously with two or more ROIs and our results with in vivo PET data are promising [95]. The method is still limited, however, by the selection of ROIs whose TACs must have distinct kinetics. As the ROIs are drawn manually on the PET images, reproducibility is difficult to achieve. The use of clustering to extract tissue TACs of distinct kinetics has been investigated in three

Medical Image Segmentation |
157 |
Table 3.3: Comparison between the estimated input functions obtained using different number of manually drawn ROIs and clustered ROIs, and the measured input functions
|
|
Number of ROIs |
|
|
|
|
|
|
|
|
2 |
3 |
4 |
5 |
|
|
|
|
|
Manually drawn ROIs |
|
|
|
|
MSE |
0.632 |
0.365 |
0.431 |
0.967 |
AUC (measured = 24.077) |
23.796 |
23.657 |
24.188 |
25.138 |
Linear regression on AUC (n = 19) |
|
|
|
|
Slope |
0.967 |
0.963 |
0.984 |
1.022 |
Intercept |
0.493 |
0.460 |
0.609 |
0.712 |
r value |
0.999 |
0.999 |
0.999 |
0.999 |
Clustered ROIs |
|
|
|
|
MSE |
0.100 |
0.096 |
0.040 |
0.066 |
AUC (measured = 24.077) |
20.742 |
23.721 |
25.430 |
23.481 |
Linear regression on AUC (n = 19) |
|
|
|
|
Slope |
0.807 |
0.953 |
1.067 |
0.946 |
Intercept |
0.874 |
0.575 |
-0.321 |
0.481 |
r value |
0.993 |
0.998 |
0.999 |
0.999 |
|
|
|
|
|
MSE = Mean square errors between the estimated and the measured input functions; AUC = area under the blood curve; r = coefficient of correlation; ROI = region of interest.
FDG-PET studies. Table 3.3 summarizes the results for the estimation of the input functions by the proposed modeling approach for both manually drawn ROIs and clustered ROIs. The MSE between the estimated and the measured input functions are tabulated. In addition, results of linear regression analysis on the areas under the curves (AUCs) covered by the measured and the estimated input functions are listed for comparison. Regression lines with slopes close to unity and intercepts close to zero were obtained in all cases for manually drawn ROIs and for clustered ROIs.
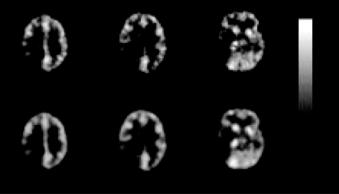
Figure 3.16 plots the measured input function and the estimated input functions for manually drawn ROIs and clustered ROIs, respectively. The estimated input functions were obtained by simultaneously fitting with three ROIs of distinct kinetics. There was a very good agreement between the estimated input functions and the measured blood curve, in terms of the shape and the peak time estimation at which the peak occurs, despite the overestimation of the peak value. Thus, cluster analysis may be useful as a preprocessing step before our noninvasive modeling technique.
158 |
|
|
|
|
|
|
|
|
|
|
|
Wong |
|
|
|
|
|
|
|
|
|
|
|
|
|
|
|
|
|
|
|
|
|
|
|
|
|
|
|
|
|
|
|
|
|
|
|
|
|
|
|
|
|
|
|
|
|
|
|
|
|
|
|
|
|
|
|
|
|
|
|
|
|
|
|
|
|
|
|
|
|
|
|
|
|
|
|
|
|
|
|
|
|
|
|
|
|
|
|
|
|
|
|
|
|
|
|
|
|
|
|
|
|
|
|
|
|
|
|
|
|
|
|
|
|
|
|
|
|
Figure 3.16: Plot of the measured arterial input function, the estimated input function from manually drawn regions of interest (ROIs), and clustering based ROIs. The estimated input functions were obtained by simultaneously fitting with three ROIs of distinct kinetics.
Alternatively, clustering can be applied to extract input function directly on the dynamic PET/SPECT data if the vascular structures (e.g. left ventricle [81] and internal carotid artery [82]) are present in the field of view, providing that partial volume and spillover effects are appropriately corrected. Clustering has also been found useful in analyzing PET/SPECT neuroreceptor kinetics in conjunction with simplified techniques for quantification [106]. In particular, identification of regions that are devoid of specific binding is attractive because the kinetics of these regions can be treated as a noninvasive input function to the simplified approach for parametric imaging of binding potentials and relative delivery [107, 108].
3.8 Fast Generation of Parametric Images
Fast generation of parametric images is now possible with current high-speed computer workstations. However, overestimation of parameters and negative parameter estimates, which are not physiologically feasible, occur often when the data are too noisy. Reliable parametric imaging is therefore largely dependent
Medical Image Segmentation |
159 |
0.037
0
a |
b |
c |
Figure 3.17: Parametric images on a pixel-by-pixel basis of K obtained from Patient 1: (a) slice 10; (b) slice 13; (c) slice 21. Top row shows the images obtained from the raw dynamic images and bottom row shows the images obtained from dynamic images after cluster analysis. The images have been smoothed slightly for better visualization.
on the noise levels inherent in the data which affect, in addition to meaningful parameter estimation, the time required to converge as well as the convergence. Clustering may be useful as a preprocessing step before fast generation of parametric images since only a few characteristic curves which have high statistical significance, need to be fitted as compared to conventional pixel-by-pixel parametric image generation where many thousands of very noisy tissue TACs must be analyzed. The computational advantage and time savings for generation of parametric images (fitting many thousands of kinetic curves versus several curves) are apparent.
Figure 3.17 shows the parametric images of physiological parameters, K , obtained from the neurologic study for Patient 1 in the three selected slices. The top and bottom rows of the images correspond to the results obtained from pixel-by- pixel fitting the TACs in the raw dynamic PET data and data after cluster analysis, respectively. The K images are relatively noisy when compared to the data after cluster analysis because of the high-noise levels of PET data which hampered reliable parametric image generation. However, the visual quality of the K images improves markedly with cluster analysis as a result of the increased SNR of the dynamic images. Low-pass filtering of the original parametric images may improve the SNR but clustering should produce better results because it takes
160 |
Wong |
the tissue TACs with similar temporal characteristics for averaging. Meanwhile, low-pass filtering only makes use of the spatial (adjacent pixels) information for filtering and this will only further degrade the spatial resolution. The feasibility of using the kinetic curves extracted by cluster analysis for noninvasive quantification of physiological parameters and parametric imaging has been investigated and some preliminary data have been reported [109]. Some other recent studies can be found elsewhere [110–115].
3.9 Visualization of Disease Progress
In nuclear medicine, several kinds of organ function can be measured simultaneously with various radiopharmaceuticals under different conditions. This gives us useful information about the stage of disease progress if the relationship between various parameters such as metabolism, blood flow, and hemodynamics can be elucidated. Toyama et al. [116] investigated the use of agglomerative hierarchical and K -means clustering methods to study regional vasodilative and vascoconstrictive reactivity and oxygen metabolism before and after revascularization surgery in chronic occlusive cerebrovascular disease. By clustering a four-variable correlation map, whose pixel values on the X, Y, Z, and T axes represent, respectively, the resting cerebral blood flow, the hyperventilatory response, the acetazolamide response, and regional oxygen metabolic rate, anatomically and pathophysiologically different areas can be identified showing the involvement of certain areas with varying degrees of progression between preand postsurgical treatment, while functional changes in the revascularized region can be depicted on the clustered brain images. It appears that clustering technique maybe useful for multivariate staging of hemodynamic deficiency in obstructive cerebrovascular disease and it also be suitable for objective representation of multiple PET physiological parameters obtained from 15O-labeled compound studies and also in brain activation studies.
3.10 Characterization of Tissue Kinetics
Kinetic modeling of radiotracer (or radiopharmaceutical) is the core of dynamic PET/SPECT imaging. The aim of modeling is to interpret kinetic data
Medical Image Segmentation |
161 |
quantitatively in terms of physiological and pharmacological parameters of a mathematical model, which describes the exchanges (e.g. delivery and uptake) of radiotracer by the tissue. Statistical inferences can then be made regarding the distribution and circulation of tracers within different tissues regions, which are quantitatively represented by the physiological/pharmacological parameters in the model. Successful statistical inference relies heavily on the appropriate use of analysis approaches and a priori knowledge of the underlying system as well as the validity of the assumptions being made. What if we know nothing about the underlying system, or little is known about the tracer characteristics and we are unsure if the assumptions (e.g. tissue homogeneity) being made are valid? The use of kinetic modeling could lead to incorrect inferences about the complex physiological or biochemical processes. In this case, data-driven approaches can provide important clues to what is going on inside the underlying system and how the radiotracer behaves inside the tissue, as they interrogate the measured data to characterize the complex processes, with minimal assumptions and independent of any kinetic model.
Evaluation of soft tissue sarcomas (STS) is a challenging clinical problem because these tumors are very heterogeneous, and the treatment of patients with STS is also very complicated. The most essential step in the diagnostic evaluation of STS is tumor biopsy. PET imaging has the ability to differentiate benign from malignant lesions. It can detect intralesional morphologic variation in soft tissue sarcomas, and it is of value in grading tumor, staging, restaging, and prognosis. Fluoromisonidazole (FMISO) has been shown to bind selectively to hypoxic cells in vitro and in vivo at radiobiologically significant oxygen levels. When labeled with the positron emitter fluorine-18 (18F), its uptake in tissue can be localized and detected quantitatively with high precision by PET. [18F]FMISO uptake has been investigated in various human malignancies [117]. PET imaging with [18F]FMISO, FDG, and
15O-water may provide valuable information complementary to tumor biopsy for better understanding of the biological behavior of STS. As cluster analysis does not rely on tracer assumptions nor kinetic model, it maybe useful in analyzing tissue TACs of STS obtained from [18F]FMISO-PET and FDG-PET, and in looking for any correlations, for instance, tumor volume, hypoxic volume, and vascular endothelial growth factor expression, etc, between different datasets [118].