

Kluwer - Handbook of Biomedical Image Analysis Vol
.2.pdf252 |
Frangi, Laclaustra, and Yang |
modes to emphasize that they correspond to absolute diameter curves. One can observe the fact that the first EigenD mode, which basically represents variations in average vessel diameter, accounts for most of the variability in the dataset and can be regarded as a robust global measure of vessel width. Note that EigenFMD and EigenD modes are similar except for the first mode and the variance attributed to each mode.
5.5.2 Relationship to Classical Indexes
It is important to analyze whether the previous analysis methodology for parameterizing the vessel behavior during the flow-mediated dilation test is linked to other clinical parameters and CVD risk factors traditionally used in the medical literature. Serum lipids, particularly cholesterol and the cholesterol fraction carried by low-density lipoproteins (LDL cholesterol) are recognized as a main causal factor of atherosclerosis [34]. In this disease lipids accumulate in the vessel wall, disturbing the vascular function of delivering sufficient blood flow to the affected territories, which ends with the manifestation of a vascular clinical event like heart attack or stroke. Moreover, knowing patients’ lipid levels and modifying them with drugs and diet is the main preventive tool against cardiovascular diseases. From this point of view, cholesterol and LDL cholesterol are considered as risk factors, as higher levels identify individuals with higher risk whereas the cholesterol fraction carried by high-density lipoproteins (HDL cholesterol) is considered as a protective factor. Triglycerides also associate with future cardiovascular disease, and higher levels are present in the metabolic syndrome, which identifies high-risk individuals [34].
Endothelial dysfunction is believed to be a main mechanism through which individuals with unfavorable lipid profiles develop atherosclerosis [35]. As stated before, in the FMD test, the vasodilatory response is identified with endothelial function [1].
5.5.2.1 Sample Population: Clinical and Traditional Variables
A subset of n = 161 subjects from the military male population described in section 5.2.1 was analyzed. This population had normal to mildly unfavorable lipid levels. Also, the subset of subjects used in the following analysis corresponds with the one used in computing the EigenFMD and EigenD analyses of the

Computerized Analysis and Vasodilation Parameterization of FMD |
253 |
previous section, and whose FMD curves where obtained with our computerized technique.
Fasting serum samples were obtained from the subjects and were analyzed at the Lozano Blesa University Clinical Hospital (Zaragoza, Spain). Analyses were performed for total cholesterol, triglycerides, and HDL cholesterol by standard enzymatic laboratory techniques. LDL cholesterol was calculated using the Friedewald formula [36,37] in subjects whose triglycerides levels were less than 400 mg/dl.
In each absolute diameter curve, a reference baseline diameter was established before vasodilation, basal, in a region free from motion artifacts selected just after cuff pressure release (Fig. 5.11(a)). This diameter was similar in most cases to that measured before cuff inflation, r (Fig. 5.11(a)). Peak vasodilation was identified in the curve to calculate FMDc (Eq. 5.13).
5.5.2.2 Correlation Analysis
Pearson’s linear correlation coefficients were computed between eigenmodes coefficients, from both EigenFMD and EigenD, and serum lipids. Correlations were also computed between ROBPCA-derived indexes and traditional vasodilation curve measurements: flow-mediated dilation ( FMDc) and baseline diameter ( basal). Pearson’s coefficients between traditional curve measurements and serum lipids were used to control the association that could be expected. In all analyses, statistical significance was assumed when p < 0.05.
Pearson’s linear correlation coefficients between traditional curve measurements and serum lipids are shown in Table 5.7.
Pearson’s linear correlation coefficients between EigenFMD and EigenD modes coefficients and serum lipids are shown in Tables 5.8 and 5.9, respectively.
Table 5.7: Pearson’s correlation coefficient, r (and p values), between serum lipid levels, and classical FMDc and baseline diameter
Classical index |
Cholesterol |
Triglycerides |
HDL-C |
LDL-C |
||||
|
|
|
|
|
|
|
|
|
FMDc |
−0.154 |
(0.051) |
0.035 |
(0.655) |
0.190 |
(0.016)* |
−0.255 |
(0.001)* |
basal |
0.015 |
(0.853) |
0.204 |
(0.009)* |
−0.145 |
(0.067) |
−0.012 |
(0.884) |
Statistically significant correlations are indicated with an asterisk. HDL-C: High-density lipoprotein chole-
strol; LDL-C: low-density lipoprotein cholestrol.

254 |
Frangi, Laclaustra, and Yang |
Table 5.8: Pearson’s correlation coefficient, r (and p values), between serum lipid levels and the first five EigenFMD mode coefficients
Mode # |
Cholesterol |
Triglycerides |
HDL-C |
LDL-C |
||||
|
|
|
|
|
|
|
|
|
EigenFMD 1 |
0.053 |
(0.504) |
−0.047 |
(0.555) |
−0.160 |
(0.043)* |
0.132 |
(0.097) |
EigenFMD 2 |
0.106 |
(0.180) |
0.044 |
(0.582) |
−0.125 |
(0.115) |
0.214 |
(0.007)* |
EigenFMD 3 |
0.159 |
(0.044)* |
−0.034 |
(0.672) |
−0.027 |
(0.734) |
0.193 |
(0.015)* |
EigenFMD 4 |
0.016 |
(0.841) |
−0.127 |
(0.108) |
−0.025 |
(0.750) |
0.067 |
(0.400) |
EigenFMD 5 |
0.044 |
(0.584) |
0.180 |
(0.022)* |
0.020 |
(0.802) |
−0.011 |
(0.892) |
Statistically significant correlations are indicated with an asterisk. HDL-C: High-density lipoprotein chole-
strol; LDL-C: low-density lipoprotein cholestrol.
Finally, Pearson’s linear correlation coefficients between EigenFMD and EigenD mode coefficients, and classical FMDc and basal diameter are reported in Tables 5.10 and 5.11.
5.6 Discussion
5.6.1 Computerized FMD Image Analysis
Artery vasodilation assessment is a complex task owing to the poor quality of US image sequences and the small range of the vasodilation that has to be measured. Previous attempts to solve this problem were based on detecting the edges of the arterial wall. These methods have been successful to some extent; however, edge detection in ultrasound is prone to fail due to the presence of speckle
Table 5.9: Pearson’s correlation coefficient, r (and p values), between serum lipid levels and the first five EigenD mode coefficients
Mode # |
Cholesterol |
Triglycerides |
HDL-C |
LDL-C |
||||
|
|
|
|
|
|
|
|
|
EigenD 1 |
−0.005 (0.949) |
−0.217 |
(0.006)* |
0.124 |
(0.117) |
0.032 |
(0.684) |
|
EigenD 2 |
−0.109 |
(0.169) |
−0.023 |
(0.774) |
0.096 |
(0.226) |
−0.231 |
(0.003)* |
EigenD 3 |
−0.072 |
(0.366) |
0.001 |
(0.992) |
−0.128 (0.106) |
−0.012 |
(0.877) |
|
EigenD 4 |
−0.095 |
(0.228) |
0.058 |
(0.467) |
0.051 (0.517) |
−0.145 |
(0.068) |
|
EigenD 5 |
0.024 |
(0.763) |
0.147 |
(0.062) |
0.007 (0.934) |
−0.027 |
(0.735) |
|
Statistically significant correlations are indicated with an asterisk. HDL-C: High-density lipoprotein chole-
strol; LDL-C: low-density lipoprotein cholestrol.

Computerized Analysis and Vasodilation Parameterization of FMD |
255 |
Table 5.10: Pearson’s correlation coefficient, r (and p values), between traditional FMD indexes and the first five EigenFMD mode coefficients
Mode # |
FMDc |
basal |
|
EigenFMD 1 |
−0.786 (<0.001)* |
0.118 |
(0.136) |
EigenFMD 2 |
−0.417 (<0.001)* |
0.294 (<0.001)* |
|
EigenFMD 3 |
−0.319 (<0.001)* |
0.076 |
(0.339) |
EigenFMD 4 |
−0.352 (<0.001)* |
−0.190 (0.016)* |
|
EigenFMD 5 |
0.113 (0.153) |
−0.127 |
(0.108) |
Statistically significant correlations are indicated with an asterisk.
noise, poor quality edge definition and acoustic shadows. In our opinion, these techniques are based on low-level features with a poor reliability.
Our method, on the contrary, deals with the images in a more global manner. We model vasodilation as a scaling factor between frames that can be recovered by means of image registration techniques. The effect of lowlevel artifacts is therefore minimized as the registration measure is computed using all the information present in the whole image, and not just at the edges.
Results obtained with the automated method were better than those measured manually by medical experts. The proposed method presents a negligible bias (0.05 %FMD) whereas the bias of the manual measurements depends on the observer (range −0.16 to +0.34 %FMD). The standard deviation of the differences between the automated and the gold-standard measurements is 1.05 %FMD, which is slightly lower than the intraand interobserver variabilities of manual measurements (1.13 %FMD and 1.20 %FMD, respectively). From the
Table 5.11: Pearson’s correlation coefficient, r (and p values), between traditional FMD indexes and the first five EigenD mode coefficients
Mode # |
FMDc |
basal |
||
EigenD 1 |
0.170 |
(0.031)* |
−0.987 |
(<0.001)* |
EigenD 2 |
0.322 |
(<0.001)* |
−0.053 |
(0.507) |
EigenD 3 |
−0.479 |
(<0.001)* |
0.062 |
(0.437) |
EigenD 4 |
0.479 |
(<0.001)* |
0.005 |
(0.952) |
EigenD 5 |
0.263 |
(0.001)* |
0.066 |
(0.409) |
|
|
|
|
|
Statistically significant correlations are indicated with an asterisk.
256 |
Frangi, Laclaustra, and Yang |
dilation CV, the proposed method has also shown to present better reproducibility (CV = 0.40%) than the manual procedure (CV = 1.04%).
The method is reasonably fast. Our experiments were carried out on a PC (Pentium III @ 600 MHz) under RedHat 7.2 Linux operating system. The registration algorithm and the Kalman filtering are both coded in C++ without a thorough code optimization since the implementation of the registration method is a general-purpose software not specifically devised for this application. Under these constraints, the mean execution times per frame are 6.4 sec (SD = 0.8 sec) and 4.0 sec (SD = 1.2 sec) for the first and second phase, respectively. This time also incorporates outputting of progress information. From our experience with the software, we think that these figures could still be cut down substantially by customizing and further optimizing several parts of the code.
The vasodilation model used in this approach has also some potential limitations. Here, dilation is recovered by means of reduced similarity transformation between each frame and the reference one. However, this implicitly assumes that the wall thickness dilates in the same way that the artery does, while it may remain constant or even thin during lumen dilation. The unstable presence of the lumen–intima boundary (LIB) could potentially affect the registration results. Finally, structures stuck to the outer part of the arterial wall may introduce errors in the vasodilation measurements since they make it more difficult to adequately pad the reference frame. The results obtained in this chapter seem to indicate, however, that the vasodilation model outlined in this work is a reasonable simplification.
Motion compensation is necessary to avoid potential sources of bias in the subsequent estimation of vasodilation and to ensure that vasodilation is measured by comparing the same artery segment in two different frames. Nevertheless, stable motion references are required to succeed in motion recovery and avoiding indetermination of the correct alignment in the longitudinal direction of the artery. Moreover, only 2-D information is available in the image to correct a problem that is intrinsically 3-D in nature.
Another advantage of motion compensation is that it makes unnecessary the manual [12, 13] or automatic [15] tracking of a region of interest (ROI) in the image sequence. This ROI tracking is required for the edge detection of some of the methods proposed in the literature. Our technique requires a simple preprocessing of only the reference frame. The interaction required is minimal (only rough delineation of two lines) and introduces a small variability (it is included in the CV of 0.40% obtained in the reproducibility study).
Computerized Analysis and Vasodilation Parameterization of FMD |
257 |
The initialization of the registration algorithm is a very important aspect. This initial transformation should fall inside the capture range of the algorithm [22] whose size depends on many factors, and its determination is not possible a priori. Some of these factors are the image quality, the line thickness of the arterial walls and the preprocessing made to the images. It is common that some frames appear with poor image quality along the sequence due to patient’s motion. One of these frames may probably lead to erroneous registration values. To reduce error propagation Kalman filtering has shown to be very valuable.
Finally, it is important to recall that the proposed tracking strategy depends on a model of mean arterial vasodilation. This model was estimated from a number of training vasodilation curves, which corresponded to young healthy volunteers. Therefore, this model could bias the analysis of sequences coming from a general population or in specific subject groups like old obese patients. This limitation could be overcome by using a larger training set for building the mean vasodilation model or by having several models for different age groups.
5.6.2 FMD Response Eigen Parameterization
As can be concluded from Table 5.7, a weak but significant correlation was found between FMDc and LDL cholesterol in a damaging way and between FMDc and HDL cholesterol in a protective way. This had been previously reported when studying dyslipidemic populations with a similar correlation magnitude, association that could be slightly attenuated in our population due to a narrower range of lipids variation. For instance, Kuvin et al. [38] found a correlation coefficient of HDL cholesterol and FMDc of 0.3. The correlation between classical flow-mediated dilation and LDL cholesterol (r = −0.40) had been previously reported by Aggoun et al. [39] in hypercholesterolemic patients. Other studies report one of these associations but rarely both or with stronger association coefficients [40] and never in natural large populations with normal lipid levels [41].
Triglycerides correlated significantly with baseline diameter, basal. The presence of wider vessels has been described for high-risk [38] and atherosclerotic [41] individuals.
The sign associated to the coefficients of EigenFMD and EigenD modes is contingent. These coefficients represent the projections of sample vectors along the eigenvectors of a robust covariance matrix. Since the eigenvectors could equally have been selected with reverse directions the sign of the correlation
258 |
Frangi, Laclaustra, and Yang |
ratio has to be interpreted in consonance with the eigenmode plots of Figs. 5.12 and 5.13. On the contrary, the effect of risk factors on the direction of variation of the EigenFMD and EigenD curves is not arbitrary and, therefore, they will be discussed in the sequel.
Among the EigenD modes in Fig. 5.13, the first mode, which broadly represents baseline diameter, significantly correlates with triglycerides, while EigenD mode number 2 does with LDL cholesterol. This later mode graphically appears to represent dilation and diameter decay (the lower the LDL cholesterol level, the higher the peaks and the quicker the vessel recovery).
EigenFMD modes are also related to cholesterol fractions. Interestingly, this analysis highlights that each fraction exerts a different influence on the curve shape. While HDL cholesterol covaries with the first mode, which could be interpreted as a classical measure of FMD peak (the higher the HDL cholesterol level, the higher the peaks), LDL cholesterol is significantly associated with the second mode, which has a form similar to EigenD 2 (the higher the LDL cholesterol levels, the lower the peaks and the slower the decays), and EigenD 3, interpretable as response velocity or time-to-peak (the higher LDL-cholesterol values, the later the peaks).
The classical measurement of FMD, FMDc, correlates with statistical significance with almost all absolute and relative shown eigenmodes. The mode with the highest correlation is EigenFMD 1 (r = −0.786), which one can visually argue that captures the maximum dilation peak. Other modes with correlation coefficients over 0.300 are also present but their visual interpretation is more subtle.
EigenD 1 is almost equivalent to the baseline diameter. This is promising, as this manual measurement could be potentially estimated on an observerindependent basis. Baseline diameter also showed significant correlations with EigenFMD 2 and 4 although the interpretation of this fact is not so evident.
5.7 Conclusions
This chapter presents a new method to assess brachial artery vasodilation in US sequences. This method, based on image registration, minimizes the effect of low-level artifacts. It also incorporates a motion compensation phase, which relieves the operator of manually tracking a region of interest.
The |
method |
is accurate (bias = +0.05%, and |
limits |
of agreement |
± 2.05 |
%FMD), |
has better reproducibility (CV = |
0.40%) |
than manual |
Computerized Analysis and Vasodilation Parameterization of FMD |
259 |
measurements (CV = 1.04%), and is robust, yielding clinically relevant information in at least 80% of the sequences in an uncontrolled setting. Finally, the method requires minimal user intervention having limited effect on the reproducibility of the measurements.
In this work we have also introduced a novel parameterization of the vasodilation curve in the FMD test. This parameterization is of applicability in conjunction with the FMD measurement technique provided in this chapter or with any other alternative (e.g. [12–20]). We have shown that this parameterization yields a number of FMD-related indexes that are consistent with the traditional FMDc coefficient and basically replicates previous findings in the literature linking FMD to serum lipid levels. This parameterization has several advantages over the classical alternative as it captures more comprehensive information of vasodilation and does not require manual selection of the FMD peak or baseline diameters to extract EigenD modes from absolute diameter curves. However, EigenFMD modes still require manual determination of the basal FMD level or diameter to process relative or absolute curves, respectively. More important, EigenFMD and EigenD coefficients bear a graphical interpretation in terms of FMD-peak, time-to-FMD-peak, recovery speed, etc. This can be useful to gain understanding in the relationship between the dynamics of the endothelium dependent vasodilation and the underlying processes related to endothelial dysfunction. Although this method enables such investigations that are impossible with classical measurements of FMD, further clinical research is required to fully validate its utility.
5.8Appendix: Distance Between Two Splines
Each manual measurement requires fitting of a cubic spline to the edge of each arterial wall. The distance between both splines is the arterial diameter. The line is placed at the inner edge of the media as showed in Fig. 5.14.
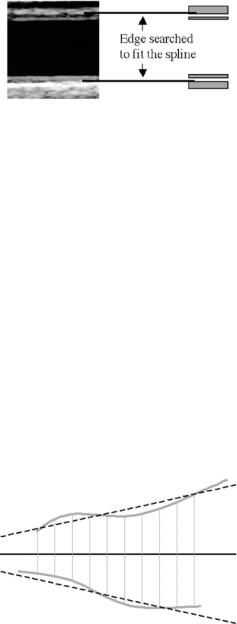
The distance is calculated as follows (see Fig. 5.15):
1.The orientation of each spline is calculated by means of a linear regression.
2.The mean orientation of both splines is calculated using the bisector of the two calculated regression lines.
260 |
Frangi, Laclaustra, and Yang |
Figure 5.14: Manual fitting of a spline to the arterial wall.
3.Perpendicular lines to this bisector are traced, every 10 pixels, finding the intersection points with the two splines.
4.The average distance between all pairs of points found is the arterial diameter.
5.9 Acknowledgments
We express our gratitude to Dr. D. Rueckert for providing us with his implementation of Studholme’s algorithm. We thank M.L. Gimeno, MD, and A.G. Frangi, MD, for providing manual measurements for the evaluation study, and S. Olmos and M. Bossa for their help and discussions. We also thank P. Lamata for his contribution in the initial phases of this work. AFF is supported by a Ramon´ y Cajal Research Fellowship from the Spanish ministry of Science and Technology.
Figure 5.15: Average diameter estimation. The diameter is the mean length of the segments (thin continuous gray lines) perpendicular to the bisector (continuous black line) between the regression lines (dashed black lines) of both splines. Nonparallelism and tortuosity of the splines representing the arterial walls have been exaggerated to clarify the example.
Computerized Analysis and Vasodilation Parameterization of FMD |
261 |
This research was partially supported by grant TIC2002-04495-C02 from the same ministry. The AGEMZA Project is supported by a grant (FIS 99/0600) from the Spanish Ministry of Health and Consumption. The clinical research was also partially supported by a grant of the Diputacion´ General de Aragon´ (P58/98).
Questions
1.In section 5.1 it is stated that edge detection approaches to FMD computerized analysis are more dependent on several error sources of ultrasound that registration based approaches. Can you explain why?
2.The motion model of section 5.3.2.1 assumes that there is in-plane motion only. Can you comment on this?
3.The Kalman filter is causal, which means that its output value is a function of only the inputs that came earlier in time (could also be only later). Comment on the use of non causal tracking strategies like, for instance, noncausal Wiener filtering.
4.Derive Eq. (5.11).
5.Why do we need to measure the nitroglycerine-mediated dilation (NMD) phase if clinical indexes are only related to the FMD phase?