

Kluwer - Handbook of Biomedical Image Analysis Vol
.2.pdfLumen Identification, Detection, and Quantification in MR Plaque Volumes |
453 |
1.Tunica intima: It is the innermost layer which consists of the endothelium (a simple squamous epithelium) and a small amount of underlying connective tissue. In arteries it also includes the internal elastic lamina, which is often seen as a thick wavy band surrounding the lumen of the vessel.
2.Tunica media: This is the middle layer made up mainly of smooth muscle cells. In arteries it is the thickest layer.
3.Tunica adventitia: It is the outer layer made up of loose connective tissue (collagen fibers, fibroblasts) along with some smooth muscle cells. It is the thickest layer in veins (particularly the larger veins).
Thus we see that quantification of walls and the classification of plaque components is of utmost importance. In the next section we discuss the research groups who have done work in this direction.
9.1.2 Survey of Plaque Segmentation Techniques
Figure 9.3 shows the different image processing techniques used for segmentation of the plaque volumes. Yuan et al. [33] used a quantitative vascular analysis tool (QVAT). The QVAT is a semiautomatic, custom-designed program that tracks boundaries and computes areas. Gill et al. [9] used a mesh-based model that obtained boundaries in three steps. It involved a deformable balloon model of a triangular mesh which is first placed inside a region manually; it is then inflated by inflation forces and then refined by image-based forces. Kim et al.
[11] used an edge-detection tool. Wilhjelm et al. [12] used a manual segmentation procedure. Yang et al. [10] used a border-based model, which had three steps. It involved first approximating the outlines of the vessels, followed by the detection of borders, and then the user correction of the borders.
Yang et al. [10] segmented the wall and plaque in in vitro vascular MR images using a combination of automated and manual processes. A computerized method used edge strength, edge direction, border smoothness, and shape guidance to get the outer wall, lumen, internal elastic lamina, and external elastic lamina boundaries; these boundaries were then modified using the user selection seed points. Boundaries of the outer wall and the lumen were determined by fitting splines to seed points. The internal elastic lamina boundary was obtained
454 |
Suri et al. |
Vasculature Segmentation Techniques
|
|
|
|
|
|
|
|
|
|
|
|
Quantitative Vascular |
Edge-detection |
Border-based 3 |
|||
Analysis Tool (QVAT) |
tool |
step method |
|||
Yuan group |
Kim group |
Sonka group |
|||
University of |
Harvard Medical |
University of Iowa |
|||
Washington, Seattle |
School |
|
|
||
|
|
|
|
|
|
Mesh-based 3 |
Manual |
|
step method |
Wilhjelm group |
|
Ladak group |
||
Technical |
||
John P. Robarts |
||
University of |
||
Research Institute, |
||
Denmark |
||
Canada |
||
|
Figure 9.3: Segmentation techniques applied to plaque imaging volumes.
using the lumen wall boundary for shape guidance. The external elastic lamina boundary was then obtained using the internal elastic lamina for shape guidance.
Kim et al. [11] imaged the proximal coronary artery vessel wall with highresolution 3-D cardiovascular MRI. The proximal vessel wall and lumen boundaries were obtained using an automated edge detection tool. Comparison of vessel wall thickness and luminal diameter between healthy subjects and patients with coronary artery disease showed increased wall thickness and but no significant difference in luminal diameter in patients. This was due to positive arterial remodeling in the patients, known as the Glagov effect.
Wilhjelm et al. [12] spatially compounded ultrasound images of formalin- fixed carotid atherosclerotic plaques to reduce angle-dependence and speckle noise—two problems prominent in ultrasound. A digital off-line ultrasound scanner for multi-angle compound imaging (MACI) produced arterial image slices that were compared to the corresponding anatomical slices. Compared to B- mode ultrasound images, the MACI images had a better definition of outlines and a more uniform representation of tissue parameters, which can aid in the diagnosis of atherosclerotic disease.
Lumen Identification, Detection, and Quantification in MR Plaque Volumes |
455 |
Jespersen et al. [13] compared ultrasound B-mode images and histological analysis of carotid plaque. Patients with carotid disease were scanned before carotid endarterectomy was performed. The removed plaques were then fixed and histologically analyzed. The ultrasound images were video recorded and the plaques were outlined with the help of color flow mapping. A frame grabber was used to convert the video recorded scannings into digital 256-gray level images stored on computer. Text features were calculated from the digital images, one of which was the gray level co-occurrence matrix (GLCM). Second-order text features derived from the GLCM were used to classify the plaques into three constituents, soft materials, fibrous tissue, and calcification, where soft materials included lipid, blood, and thrombus. These features were found to correlate well with the visual analysis; however, both classifications did not correlate strongly with the histological analysis because of the echolucent plaques of B-mode imaging.
Quick et al. [14] reviewed the concepts of MR imaging of the vessel wall. MRI can be used to determine the nature of the atherosclerotic plaques; classification is based on signal intensities and morphological appearance in the different MR imaging modalities. Noninvasive phased-array radio-frequency coils are used to resolve the trade-off problem between high SNR and signal penetration depth in choosing RF coils. Imaging of the carotid and the coronary arteries has been discussed. Intravascular receiver coils offer better image quality and resolution, but have drawbacks such as being noninvasive, having wall motion artifacts, and occluding bloodflow. Stents can function as receiving coils by either connecting a cable to the stent, or inducing the stent from outside. Ultrasmall superparamagnetic particles of iron oxides (USPIOs) can be used as a contrast agent for detecting atherosclerotic plaques before luminal narrowing because of the susceptibility-induced signal voids they cause after being phagocytosed by macrophages.
Gill et al. [9] developed a semiautomatic segmentation technique based on an inflating model that they used to segment the lumen from three-dimensional ultrasound images of the carotid arteries of phantoms and subjects. The vascular mimicking phantom consisted of two vessels that were identical except that one of them was cut to simulate an ulceration. After the phantom was imaged, the two vessels were registered using the automatic nonlinear image matching and anatomical labeling algorithm. The segmentation algorithm involved interactive placement of the initial balloon model inside the lumen, automatic inflation of
456 |
Suri et al. |
the balloon using inflation forces, and automatic localization of the balloon to the arterial wall using image-based forces. The balloon model was represented by a triangular mesh. Two thresholds were used in defining when a triangle in the mesh should be split into two triangles; the larger threshold was used while the balloon was inflating to the arterial wall, and the smaller threshold was used while the balloon was being refined to fit the arterial wall. Surface tension was used to reduce the effect of noise. A maximum error corresponding to the maximum separation of the two registered phantom arteries was reported to be
0.3mm.
Zhang et al. [35] showed that images produced by different imaging modali-
ties of MRI will give similar results when measuring lumen and vessel wall areas, provided that the quality of the images are high and comparable. An image quality rating criteria was developed and had five levels of quality. Ten patients were imaged with four MRI modalities (Time of Flight, T1, T2, PD-weighted), and image sets of a patient were studied only if all of the different images were above the third level of image quality. Lumen and outer wall boundaries were measured semiautomatically using a program called the quantitative vascular analysis tool (QVAT). Since flow artifacts were better suppressed on double inversion T1-weighted images, those images were recommended for measurement when those images have the highest image quality. Mean differences between lumen area measurements of each of the three black blood imaging techniques were shown to be not statistically significant. In measurements of lumen area, outer wall boundary area, and wall area, the PD and T2-weighted images showed the best agreement.
Yuan et al. [33] studied whether using a gadolinium-based contrast agent in high-resolution MRI provided additional information that helped in characterizing atherosclerotic plaques. High-risk atherosclerotic plaques were characterized by thinning and rupture of the fibrous cap overlying the thrombogenic lipid core of the artery. The study was done on patients scheduled for carotid endarterectomy and volunteers. High-resolution cross-sectional MR images of bilateral carotid arteries were obtained with a phased array carotid coil on a 1.5-T GE SIGNA Horizon Echo Speed 5.8 MR scanner using a preand postcontrastenhanced double inversion recovery T1-weighted fast spin-echo imaging protocol with TR/TE/T1 = 800/10/650 msec, echo train length = 8, slice thickness
= 2 mm, FoV = 13 × 9 cm, and matrix = 512 × 512 with zero-filled Fourier reconstruction. TOF images were also obtained to aid in the classification of
Lumen Identification, Detection, and Quantification in MR Plaque Volumes |
457 |
plaque tissues. The precontrast enhanced images were used to identify regions of interests (ROIs) in which the constituents were classified as fibrous tissue, necrotic core, or calcification. These ROIs were then matched in the postcontrast enhanced images and a percent signal intensity change was calculated from each ROI. After the endarterectomy, the plaques were histologically classified. Results were analyzed using statistical techniques such as single-factor analysis of variance (ANOVA), Tukey, and Student’s t test. It was found that the use of the gadolinium-based contrast agent in MRI is significantly useful in the classification of necrotic core, fibrotic tissue, and especially neovasculature of atherosclerotic plaques.
Yuan et al. [34] further showed that identification of a ruptured fibrous cap in in-vivo human carotid atherosclerosis using high-resolution MRI is highly associated with a recent transient ischemic attack (T IA) or stroke. Multiple contrast-weighted MR protocol was used to obtain the images. The fibrous caps were reviewed and classified as either being intact and thick, intact and thin, or ruptured. Patients were classified as symptomatic or asymptomatic depending on recent history of TIA or stroke. It was observed that while 9% of patients with thick fibrous caps were symptomatic, 50% and 70% of those which had thin caps and ruptured caps, respectively, were symptomatic. Statistical analysis showed a highly significant trend of increasing percent symptomatic as cap deterioration increases.
Naghavi et al. [22, 23] discussed a new classification system for identifying patients having a risk of cardiac disease and related events. They defined three areas of vulnerability: plaque, blood, and myocardium. They defined a vulnerable plaque with a set of major and minor criteria, and techniques for detection of each of these criteria. Many markers in blood that were associated with coagulation were described, as were conditions that are associated with a vulnerable myocardium. A new risk assessment strategy that was based on the three areas of vulnerability, called the Cumulative Vulnerability Index, was proposed.
Fayad et al. [24] discussed the use of electron-beam computed tomography (EBCT) to quantitatively detect the amount of calcium deposited in the coronary arteries. Using a multidetector-row CT (MDCT) system to detect calcium offers higher spatial resolution and SNR, but has more motion artifacts. Additionally, using a contrast agent with MDCT can classify plaques into soft, intermediate, or calcified. EBCT angiography results were found to be similar to MDCT angiography results. Coronary MR angiography (CMRA) was still less sensitive
458 |
Suri et al. |
and specific than EBCT and MDCT angiographies; both spatial and temporal resolution were lower, and the time needed to acquire an image requires that imaging take place over multiple heart beats. MRI has been shown to usefully image plaques at various locations. It has also been used to monitor experimental studies on plaque [25]. The combination of CT and MRI for use in detecting dangerous plaques was promising.
Corti et al. [27] used high-resolution MRI imaging to follow the effects of simvastatin, a statin that stabilizes plaques by lowering the lipid content, on human atherosclerotic plaques. Results showed that after 12 months there was a significant decrease in vessel wall area and maximal wall thickness, but there was not a significant change in the lumen area.
Fuster et al. [26] discussed the biological events that lead to acute coronary syndromes (ACS). Plaques of types IV and V (vulnerable) and type VI (complicated) were most likely to lead to ACS. The beginning of an atherosclerotic lesion start with lipoprotein transport and development of the extracellular matrix. The disruption of plaques was made up of passive and active phenomenon. Inflammatory cells at the plaque site would weaken the fibrous cap through lytic processes, which was a step in arterial remodeling. Tissue factor (TF) was associated with macrophages and was involved in coagulation, haemostasis, and thrombosis. It was recognized that MRI is a promising tool for noninvasive plaque characterization.
9.1.3 What Is This Chapter About?
The formation of atherosclerotic plaques in vessel walls cause stenosis and is a major cause of death in the United States. Quantification of the degree of stenosis can lead to life-saving surgery. We want to quantify the boundaries of the lumen to determine the degree of the stenosis. This information can be used to diagnose surgery. We want to use MRI images because of its high resolution and ability to delineate the lumen wall. The MRI images of human carotid arteries we studied had an outer boundary and an inner boundary. The inner boundary was the boundary of the lumen.
We discuss modeling the lumen region, lumen boundary, and lumen quantification in this chapter. Also discussed is the analysis and quantification of vessel walls. For the outer boundary, the research will appear elsewhere.
We developed a system which analyzed and quantified the inner boundary of the lumen. Given a slice of an MRI image of the left and right carotid arteries, the
Lumen Identification, Detection, and Quantification in MR Plaque Volumes |
459 |
system detects and identifies the two different left and right lumen boundaries and quantifies them. The lumen is complicated to classify, since the blood in the lumen flows parabolically. Blood in the center of the lumen flows at a higher speed than the blood near the edges of the lumen. In an MRI image this difference in flow rates causes the center of the lumen to appear brighter than the edges of the lumen. When classifying the image, the classifier will fail to identify the entire lumen as one class, instead it will identify multiple classes inside the lumen. We used three different segmentation methods for the classification of the lumen region in our system. These are the Markov random fields (MRF), the Fuzzy C means (FCM), and the graph segmentation methods (GSM). The MRF method uses the Bayes rule to segment the image. It uses the expectation-maximization (EM) algorithm and is based on maximum likelihood. It segments the image into a given number of classes. The FCM method is based on the clustering technique. It computes the fuzzy membership function. It associates this function to each pixel in image. The GSM method is based on analyzing the image as a graph with the pixels being nodes and the edges being the connections between two pixels. It calculates weights of the edges and decides with a decision criterion whether there should be a boundary between them. After the image is classified using one of the three methods of segmentation, the image is binarized to isolate the left and the right lumens. Since the lumens may contain multiple classes, the binarization process merges these classes when necessary. The carotid arteries bifurcate in the middle of the volume and the region of interest (ROI) of the lumens change from being a circular shape to being an elliptical shape. The binarization process uses both circular and elliptical masks. Once the boundaries of the left and right lumens were obtained, they were compared to traced ground truth boundaries using two methods of error computation between boundaries. We computed the error using the shortest distance method (SDM) and the polyline distance method (PDM). The PDM computes a lower error than does the SDM. We tested the system for the three different classifying methods, first on synthetic data and then on real patient volumes.
We created a model of images of the carotid arteries for validation. To simulate noise, we created images with variance from 0 to 100 for a small noise protocol, and we created images with variance from 100 to 1000 for a large noise protocol. For each variance we created images with left and right lumens having two classes in eight different orientations. Each protocol had about 24,000 total boundary points. Using MRF, the average error for a variance of 500 pixels squared was 5.97 pixels with standard deviation of
460 |
Suri et al. |
0.13 pixels; using FCM the average error was 1.54 pixels with standard deviation of 0.05 pixels.
We ran the system using each of the three different classifying methods on real patient data. Ground truth boundaries of the walls of the carotid artery were traced for 15 patients. Overall the number of boundary points was roughly 22,500 points. A pixel was equivalent to 0.25 mm. Using MRF, the average error was 0.61 pixels; using FCM, the average error was 0.62 pixels; using GSM, the average error was 0.74 pixels.
What is new in this chapter? The following are the new things the readers will observe when it comes to plaque imaging: (a) Application of three different sets of classifiers for lumen region classification in plaque MR protocols. These classifiers are done in multiresolution framework. Thus subregions are chosen and subclassifiers are applied to compute the accuracy of the pixel values belonging to a class. (b) Region merging for subclasses in lumen region to compute accurate lumen region and lumen boundary in cross-sectional images. (c) Rotational effect of ROI in bifurcation zones for accurate lumen region identification and boundary estimation.
9.2Challenges in Lumen Wall Boundary Estimation
Following are the challenges for lumen wall (inner) and vessel wall (outer)
estimation processes (see also Fig. 9.4):
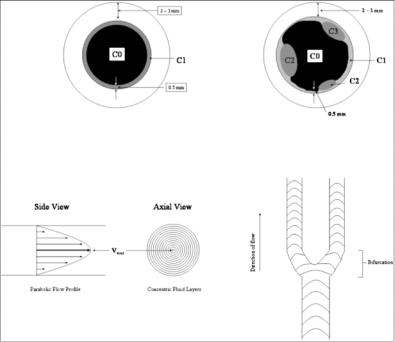
1.Mulitple classes in the lumen region due to laminar blood flow: The lumen region consists of multiple classes: core class (central part of the lumen), adjoining class (due to slow moving blood flow as seen in Fig. 9.4), and some times border pixels in the fibrous cap region giving different classes. So, the lumen region can be C1, C1 + C2, or C1 + C2 + C3 class regions.
2.Lumen shape variation: The shape of the cross section of the artery lumen is “circular” for some slices and is “elliptical” near the bifurcation. So, the ROI can change from slice to slice also. If one uses a circular ROI on an elliptical region, then a large number of pixels will be missed along the major axis of the elliptical region. The elliptical region can be seen on slice before the bifurcation zone, while the circular regions can be seen on slices far from the bifurcation zone.
Lumen Identification, Detection, and Quantification in MR Plaque Volumes |
461 |
Figure 9.4: Top left: Figure showing the class C0 for lumen, C1 class for low intensity flow region, and the outer wall for the vessel wall. Top right: Classes
C1, C2, and C3 are the regions due to the classification process due to weak distribution of pixels in the boundary region. Bottom left: Parabolic flow of the blood showing the highest velocity in the central region of the vessel. Bottom right: Flow of blood in the bifurcation zone.
3.Over-shooting of the human tracings: Another difficulty which can bring large error is when the human tracing the ideal boundary overshoots the lumen region and draws in the vessel wall area or even outside of the vessel wall area. This “overshoot” tracing can bring large error between the computer estimated boundary and “ideal boundary.”
4.Bleeding region of the lumen: The bleeding issue is a serious problem. Sometimes lumen class C1 or C2 or C3 are not isolated. These class regions tunnel into the neighboring region and bleed, creating a break in the wall boundary or a missing boundary region.
5.Partial volume effect: The partial volume effect in the edge of the lumen can lead to misleading lumen wall boundary estimation.