

- •Welcome to Seagate Crystal Reports
- •Welcome
- •Two kinds of Hands-On tutorials
- •Command, button, key, and control conventions
- •Using Seagate Crystal Reports documentation
- •Seagate Crystal Reports online Help features
- •If you need more help...
- •Installation Requirements
- •Installing Seagate Crystal Reports
- •Installing on a network workstation
- •Upgrading from a previous version
- •Quick Start
- •Subreports expand report usefulness
- •Query Designer adds ad-hoc querying capabilities
- •Parameter fields mean multi-purpose reports
- •Text objects give you text with intelligence
- •Preprinted-form reports easier than ever
- •More powerful formulas extend your capabilities
- •Web solution serves up variety of online reports
- •HTML exporting simplifies Web activities
- •New database support improves data access
- •Running totals made easy
- •Smart Navigation
- •Learning Seagate Crystal Reports
- •User’s Guide
- •Online Help
- •Books Online
- •Sample Reports
- •Glossary
- •Sample Data - CRAZE.MDB
- •Suggested learning paths
- •The application window
- •Menu bar
- •Standard toolbar
- •Supplementary toolbar
- •Format bar
- •Status bar
- •Shortcut menus
- •Cursors
- •Design Tab
- •Preview Tab
- •Other fundamentals
- •HANDS-ON (Report Design Environment)
- •How to add, delete, and move guidelines
- •How to move and position objects using guidelines
- •How to turn the grid on/off
- •How to zoom your report in and out
- •How to undo/redo activities
- •How to drill down on summarized data
- •HANDS-ON (Sections and Areas)
- •How to add, delete, move, and merge sections
- •How to split and resize sections
- •Basic report design
- •How to design a prototype
- •Concepts in reporting
- •Beyond basic reports
- •HANDS-ON (Report Creation and Design)
- •How to select data and begin creating a report
- •How to add and link multiple tables
- •How to insert database fields
- •How to insert special fields
- •How to insert a page n of N field
- •How to insert text objects
- •How to use a database field in a text object
- •How to insert a picture
- •How to select, move, and resize objects
- •How to hide parts of the report
- •HANDS-ON (Finishing Your Report)
- •How to insert page headers and footers
- •How to add a title page to your report
- •How to add summary information to your report
- •Printing considerations
- •Design solutions for printing/distributing
- •Report creation checklist for distributed reports
- •Updating printer drivers
- •Report distribution
- •HANDS-ON (Distributing Your Report)
- •How to export reports
- •How to fax a report
- •How to request reports from a web browser
- •How to specify parameter field values
- •How to log on to a database
- •How to view plain HTML reports
- •Overview
- •Getting started
- •Record Selection
- •Grouping and sorting
- •Completing the report
- •Introduction
- •Working with Arbor Essbase data
- •HANDS-ON (Reporting on OLAP data)
- •How to create a cross-tab with Essbase data
- •Using multiple sections in reports
- •HANDS-ON (Multiple Section Reports)
- •How to work with text objects
- •How to create a form letter using a text object
- •How to format objects conditionally
- •How to print conditional messages in form letters
- •How to alternate background colors for rows
- •How to eliminate blank lines
- •How to add blank lines conditionally
- •Formatting concepts
- •Absolute formatting
- •Types of formatting properties
- •Conditional formatting
- •HANDS-ON (Absolute Formatting)
- •How to add color, shading, and borders
- •How to add/edit lines and boxes
- •How to change margins
- •How to add/delete white space between rows
- •How to set page orientation and paper size
- •HANDS-ON (Conditional Formatting)
- •How to flag values that meet certain conditions
- •Record selection
- •Group selection
- •Record selection formula templates
- •HANDS-ON (Record and Group Selection)
- •How to create a record or group selection formula
- •How to use record/group selection templates
- •How to select the top or bottom N groups
- •Sorting, Grouping, and Totalling Overview
- •Creating custom groups
- •HANDS-ON (Sorting, Grouping, and Totalling)
- •How to do a single field sort
- •How to do a multiple field sort
- •How to group data
- •How to sort records within groups
- •How to summarize grouped data
- •How to subtotal grouped data
- •How to sort based on summarized group values
- •How to create multiple levels of subtotals
- •How to group data in intervals
- •How to calculate a percentage of the grand total
- •How to create group headers
- •What are formulas?
- •Other formula conventions
- •Formula syntax
- •How formulas are evaluated - Order of precedence
- •HANDS-ON (Formulas 101)
- •How to insert a formula in your report
- •How to delete formulas from your report
- •How to copy formulas from online Help
- •How to copy formulas from one report to another
- •How to create if-then-else formulas
- •How to format text with formulas
- •How to use variables in formulas
- •How to declare a variable
- •How to assign a value to a variable
- •How to conditionally assign values to variables
- •How to use an array in a formula
- •How to use a range in a formula
- •How to use semicolons in formulas
- •How to fine tune group selection formulas
- •How to fine tune record selection formulas
- •How to debug a formula
- •Introduction
- •HANDS-ON (Advanced Totalling)
- •How to maintain running totals in a list
- •How to subtotal running totals within groups
- •How to subtotal without grouping
- •How to subtotal true A to B, A to C reports
- •Parameter field objects overview
- •Multiple parameter fields
- •Parameter field considerations
- •HANDS-ON (Parameter Field Objects)
- •How to create a parameter field
- •How to use a parameter field in a formula
- •How to respond to parameter field prompts
- •How to use wildcards with parameter fields
- •How to set a report title using parameter fields
- •How to set sort order using parameter fields
- •Graphing Overview
- •Choosing a graph or chart type
- •Where to place your graph
- •Data you can graph on
- •Before you create your graph
- •HANDS-ON (Graphing)
- •How to graph on a summary or subtotal field
- •How to graph on a details field
- •How to graph on a formula field
- •How to graph on cross-tab summaries
- •How to edit graphs using PGEditor
- •How to use the underlay feature with graphs
- •OLE Objects Overview
- •Inserting OLE objects in your reports
- •Linked vs. Embedded Objects
- •The dynamic OLE menu commands
- •OLE and the Picture command
- •General OLE considerations
- •HANDS-ON (OLE Objects)
- •How OLE objects are represented in your report
- •How to use OLE - General Overview Tutorial
- •How to insert a graphic/picture as an OLE object
- •What are subreports?
- •Unlinked vs. linked subreports
- •How subreport linking works
- •HANDS-ON (Subreports)
- •How to insert a subreport
- •How to preview your subreport
- •How to combine unrelated reports using subreports
- •How to use subreports with unlinkable data
- •Cross-tab overview
- •Cross-tab components
- •HANDS-ON (Cross-Tab Objects)
- •How to create a cross-tab object
- •How to format a cross-tab
- •How to print cross-tabs that span multiple pages
- •The Crystal Query Designer
- •HANDS-ON (Queries)
- •How to create a new query
- •How to add tables to a query
- •How to link tables and specify a join type
- •How to add fields to a query
- •How to identify unique values in a query
- •How to summarize data with aggregate functions
- •How to sort records according to field values
- •How to specify records to be included in a query
- •How to select groups to be included in a query
- •How to create an SQL expression
- •How to create a query from another Crystal Query
- •How to select a query for a report
- •How to use a parameter field in a query
- •Dictionaries Overview
- •HANDS-ON (Dictionaries)
- •How to create a new dictionary
- •How to add a data file
- •How to open an SQL or ODBC data source
- •How to link multiple tables
- •How to select tables and fields for users
- •How to add/create formulas
- •How to move fields/field headings within the list
- •How to update the location of a database table
- •How to add a new field heading
- •How to add Help text
- •How to add a graphic
- •How to create sample data for users to browse
- •How to edit an existing dictionary
- •How to convert a 3.x or 4.x dictionary file
- •How to select a dictionary for a report
- •Databases Overview
- •For additional information
- •HANDS-ON (Working With Databases)
- •How to open Access queries through DAO
- •How to open Access queries through ODBC
- •How to open Access parameter queries
- •How to set up an ODBC data source
- •How to check settings for an ODBC data source
- •How to log on to an ODBC data source
- •How to add an ODBC database table to a report
- •How to log on to MS SQL Server via ODBC
- •How to log off an ODBC data source
- •How to set up an A to B, A to C link
- •How to edit an SQL query
- •How to use an ACT! database
- •How to open the NT Event Log
- •Introduction
- •Four types of data
- •Direct access database files
- •ODBC data sources
- •Crystal Query Designer files
- •Crystal Dictionary files
- •Multi-pass reporting
- •Product support
- •Web support
- •E-mail support
- •Fax support
- •Telephone support
- •Extended technical support policy
- •Product registration
- •Product return policy
- •Product replacement policy
- •Glossary

Cross-tab overview
A cross-tab is an object that summarizes data and then presents the summaries in a compact row and column format that makes it easy to make comparisons and identify trends.
Report examples are provided to demonstrate the power of a cross-tab in those situations in which the cross-tab is an option. Those are often situations in which the word by is included in your report description:
●sales by state,
●products sold by color and size, or
●orders by customer.
While there are certainly many ways to create these kinds of reports, cross-tabs generally present more data in a more compact, easier to understand form than other reporting methods.
NOTE: You can insert as many cross-tab objects in your report as you need. You can even place them in subreports. Thus, you can use cross-tabs to show summarized data in a report that presents the details in another form.
In the following examples, the goal is to analyze the unit sales of five different bicycle locks in four different regions (a unit sales of locks by region report). For clarity, only the most essential information in these reports has been included:
●the region the order came from,
●the name of the lock, and
●the quantity ordered.
The first way of looking at the data is in the most basic of all reports, a columnar report with no grouping or sorting.
446 |
Seagate Crystal Reports User’s Guide |
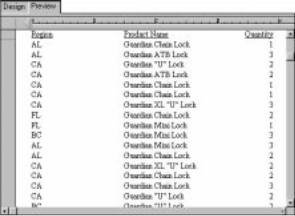
Report of order data - no sorting/ grouping
Report of
order data - grouped by region
This report presents nothing but details. Each row represents an individual order. There are many orders from each of the regions for different locks. But because there is no summary information, it is nearly impossible to get any useful information out of a report like this.
The next logical step is to group the data in some way. You can group it by region, or by product line. You will take a look at both of these options.
This report uses the data seen in the first report, but here the data is grouped by Region. All the orders for each Region are grouped together, but each regional group contains orders for different kinds of locks. Because the groups contain different kinds of data, summarizing the Quantity field will determine the total number of locks sold per Region, but not the total of each kind.
Cross-Tab Objects |
447 |
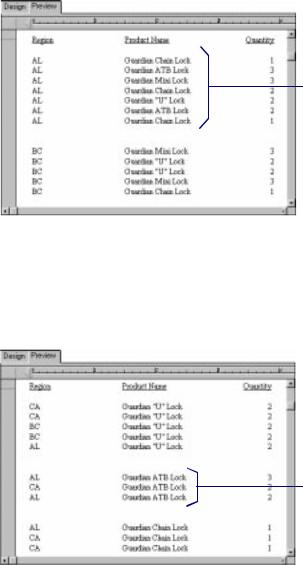
Each Region group contains orders for different kinds of locks.
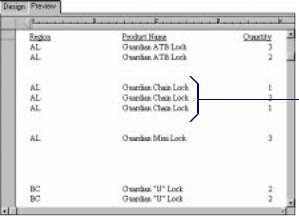
Report of
order data - grouped by product
This report groups the data by product. Each group displays all the orders for a specific product. At first it appears that this might be useful, but then it becomes clear that each product group includes orders from several different regions. The information is helpful, and it brings you closer to your goal, but you are still a long way from having the information you need.
Each product group contains orders for many regions.
448 |
Seagate Crystal Reports User’s Guide |
Report of
order data - grouped by region and product
This report is the logical next step. If the By Region report contains multiple products in each region group, and the By Product report contains multiple regions in each product group, then it seems to make sense to combine the two. Doing that, you group first by Region and then by Product.
Each group contains orders for one product for one region.
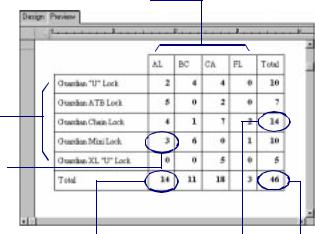
Order data in a cross-tab object
But the data is all spread out and remains difficult to analyze. The information is useful, and with a little work you can use a report like this to get the comparison information you need. But a crosstab offers a better solution.
Using a cross-tab, all the information you need is provided in a compact format. The report shows what products were sold in which regions and what the unit sales were. It is easy to see, for example, that Guardian Mini Locks are not popular at all in California but they are the biggest seller in BC or that Florida is being outsold by Alabama in every lock category.
Cross-Tab Objects |
449 |
Regions.
Product names.
Total - one product in one region.
Total - all products |
Total - one product |
Total - all products |
in one region. |
in all regions. |
in all regions. |
In this cross-tab:
●Product names make up the row headings.
●Regions make up the column headings.
●The value at each row/column intersection is the sum of all the orders for a particular product from a particular region, for example, the total number of Guardian Mini Locks ordered in British Columbia.
●The total at the end of each row is the total of all of the purchases for one product in all regions, for example, the total number of Guardian ATB Locks ordered in Alabama, British Columbia, California, and Florida combined.
●The total at the bottom of each column is the total number of all kinds of locks ordered in one region, for example, the number of locks of all kinds purchased in California.
●The total in the bottom right corner is the grand total showing the total unit sales of all five locks in all four regions.
The report is compact, and you can compare your customers' purchasing habits in a hurry. Clearly this is a worthwhile report in situations such as this.
450 |
Seagate Crystal Reports User’s Guide |