

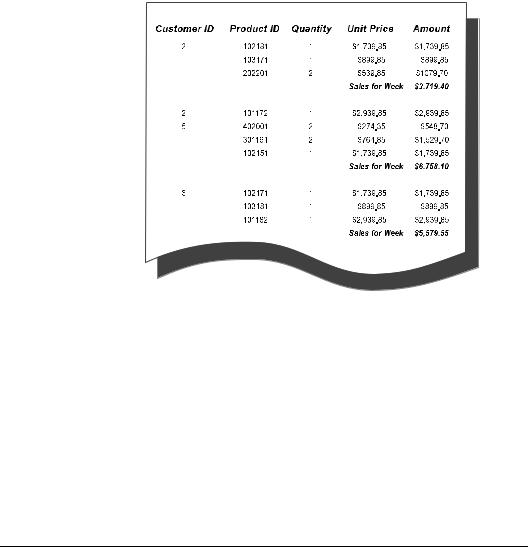
NOTE: To see an example of the above report, open the
SGT08.RPT file in the \CRW directory.
Related Topics
Formulas 101, Page 321
How to summarize grouped data, Page 289
How to subtotal grouped data, Page 291
How to calculate a percentage of the grand total, Page 310
How to create group headers, Page 313
How to create multiple levels of subtotals
Sometimes one level of subtotal will not do. For example, you may want to see sales for each region subtotaled, but within each region you may want to see sales for each sales representative or each postal code subtotaled as well. The program enables you to create these multiple subtotals with ease.
Sorting, Grouping, and Totalling |
297 |
There are two keys to effective reporting using multiple subtotals:
1.First, you need to make sure you enter the subtotals in the correct order. The rule to follow is to go from broad to narrow. For example, if you want to subtotal by country and, within each country, by region, you enter the country subtotal first and then the region subtotal.
2.The other key is to make sure you label the subtotals for clarity. When you have multiple subtotals, it can be difficult to tell which is which unless they are labeled properly.
If you want to subtotal Last Year’s Sales by Country and then by Region, here is how you do it:
To get started, create a report using the sample data, CRAZE.MDB, and place the following fields from left to right in the Details section:
{customer.CUSTOMER NAME} {customer.REGION} {customer.COUNTRY} {customer.LAST YEAR'S SALES}
NOTE: In the screenshot below, menus have been shortened by removing some of the commands that are unrelated to the current discussion.
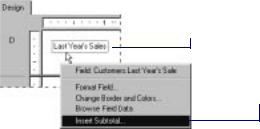
2 Right-click the database field.
3 Choose the Insert Subtotal command from the shortcut menu that appears.
"When the Insert Subtotal dialog box appears, select Country as your sort and group by field and click OK.
298 |
Seagate Crystal Reports User’s Guide |
The field you are going to subtotal.
Every time the value in this field changes, this will give you a subtotal for each country.
The program creates a group section (GH1, GF1) and places the subtotal in the Group Footer.
The country subtotal.
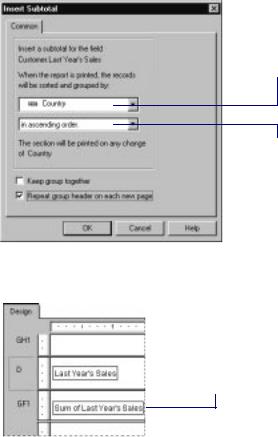
#Now right-click the Last Year’s Sales field again and choose the INSERT SUBTOTAL from the shortcut menu that appears.
Sorting, Grouping, and Totalling |
299 |
You are subtotaling the same field.
This will give you a subtotal for each region.
$This time, select Region as your sort and group by field and click OK. The program creates a second group section (GH2, GF2) and places this subtotal in the second Group Footer (GH2). See How to group data, Page 285.
The region subtotal.
The country subtotal.
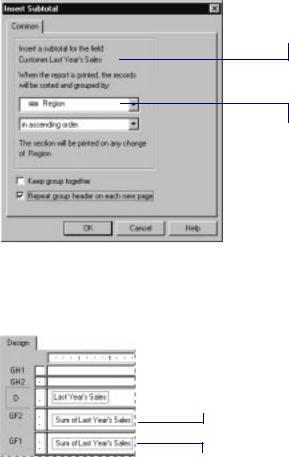
Your report should look similar to the following:
NOTE: This example report has been designed to illustrate concepts only, not the actual look of your finished report.
300 |
Seagate Crystal Reports User’s Guide |
Each region is subtotaled.
So is each country.
This report contains multiple levels of subtotals.
NOTE: To see an example of the above report, open the
SGT09.RPT file in the \CRW directory.
Related Topics
For more information on summarizing your data, search for
Summary functions in Seagate Crystal Reports online Help.
How to group based on first letter of company name
You might want to break your data into groups based on the first letter of the company name. In a customer list, for example, you might want all the “A” customers in a group, then all the “B” customers, and so forth. To do this requires the use of a formula.
Do not worry if you are unfamiliar with formulas. This text will show you what formula you need here and how to enter it. You can learn more about creating and editing formulas in Formulas 101, Page 321.
Sorting, Grouping, and Totalling |
301 |
You are going to create a formula that will extract the first letter of each customer’s name. Then you are going to group the data using that formula field as the sort and group by field. The program will sort the data based on the first letter of each customer name and start a new group whenever the letter changes.
To get started, create a report using the sample data, CRAZE.MDB, and place the following fields from left to right in the Details section:
{customer.CUSTOMER NAME} {customer.REGION} {customer.POSTAL CODE} {customer.COUNTRY}
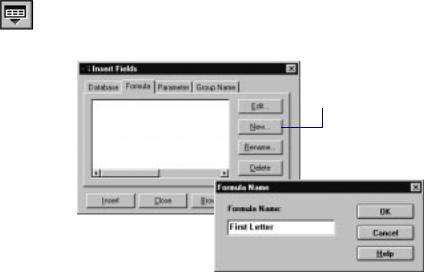
Click the INSERT FIELDS button on the standard toolbar. When the Insert Fields dialog box appears, click the Formula Tab to activate it.
3 Click the New button.
4 Type the name you want  to identify the formula.
#When you click OK, the Formula Editor appears. Type the following formula into the Formula text box:
{customer.CUSTOMER NAME}[1]
$Click the Accept button. The Formula Editor disappears and you are returned to the Insert Fields dialog box with the name of your formula highlighted in the list box.
%Click the Insert button to place the formula object in the report.
302 |
Seagate Crystal Reports User’s Guide |
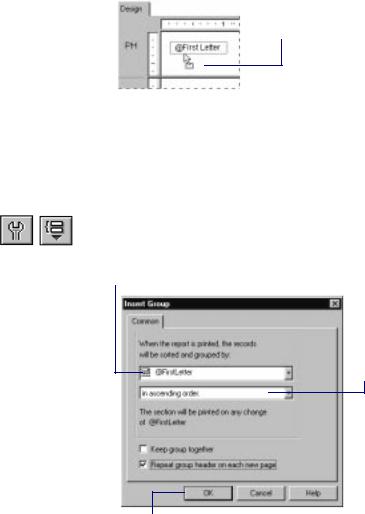
8 Place the formula object temporarily in the Page Header section of your report.
'Place the formula object temporarily in the Page Header section of your report.
You are going to move the formula object into a Group Header section, but the report does not have one yet. As soon as you group the data, you can move the formula object into the desired section.
Click the Insert GROUP button on the supplementary toolbar. The Insert Group dialog box appears.
11 Select the formula field as the field you want your data grouped by.
12 Specify the sort direction.
13 Click OK when finished.
You are returned to your report with the data grouped by the formula field as specified.
" Finally, move the formula field into the Group Header #1 (GH1) section where it will serve as a live group header, changing according to the value returned by the formula calculation. For more information on live headers, see Live headers, Page 315.
Sorting, Grouping, and Totalling |
303 |
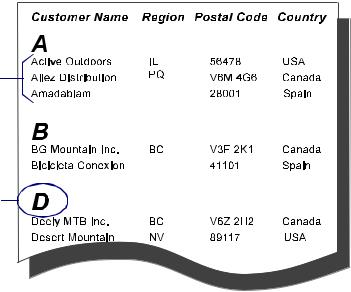
Your report should look similar to the following:
NOTE: This example report has been designed to illustrate concepts only, not the actual look of your finished report.
The data is broken into groups based on the first letter in the Customer’s Name.
The formula also provides a live header for every group.
NOTE: To see an example of the above report, open the SGT10.RPT file in the \CRW directory.
Related Topics
Formulas 101, Page 321
Reporting 101, Page 95
How to group data, Page 285
How to group data in intervals, Page 305
How to create group headers, Page 313
304 |
Seagate Crystal Reports User’s Guide |