

- •Welcome to Seagate Crystal Reports
- •Welcome
- •Two kinds of Hands-On tutorials
- •Command, button, key, and control conventions
- •Using Seagate Crystal Reports documentation
- •Seagate Crystal Reports online Help features
- •If you need more help...
- •Installation Requirements
- •Installing Seagate Crystal Reports
- •Installing on a network workstation
- •Upgrading from a previous version
- •Quick Start
- •Subreports expand report usefulness
- •Query Designer adds ad-hoc querying capabilities
- •Parameter fields mean multi-purpose reports
- •Text objects give you text with intelligence
- •Preprinted-form reports easier than ever
- •More powerful formulas extend your capabilities
- •Web solution serves up variety of online reports
- •HTML exporting simplifies Web activities
- •New database support improves data access
- •Running totals made easy
- •Smart Navigation
- •Learning Seagate Crystal Reports
- •User’s Guide
- •Online Help
- •Books Online
- •Sample Reports
- •Glossary
- •Sample Data - CRAZE.MDB
- •Suggested learning paths
- •The application window
- •Menu bar
- •Standard toolbar
- •Supplementary toolbar
- •Format bar
- •Status bar
- •Shortcut menus
- •Cursors
- •Design Tab
- •Preview Tab
- •Other fundamentals
- •HANDS-ON (Report Design Environment)
- •How to add, delete, and move guidelines
- •How to move and position objects using guidelines
- •How to turn the grid on/off
- •How to zoom your report in and out
- •How to undo/redo activities
- •How to drill down on summarized data
- •HANDS-ON (Sections and Areas)
- •How to add, delete, move, and merge sections
- •How to split and resize sections
- •Basic report design
- •How to design a prototype
- •Concepts in reporting
- •Beyond basic reports
- •HANDS-ON (Report Creation and Design)
- •How to select data and begin creating a report
- •How to add and link multiple tables
- •How to insert database fields
- •How to insert special fields
- •How to insert a page n of N field
- •How to insert text objects
- •How to use a database field in a text object
- •How to insert a picture
- •How to select, move, and resize objects
- •How to hide parts of the report
- •HANDS-ON (Finishing Your Report)
- •How to insert page headers and footers
- •How to add a title page to your report
- •How to add summary information to your report
- •Printing considerations
- •Design solutions for printing/distributing
- •Report creation checklist for distributed reports
- •Updating printer drivers
- •Report distribution
- •HANDS-ON (Distributing Your Report)
- •How to export reports
- •How to fax a report
- •How to request reports from a web browser
- •How to specify parameter field values
- •How to log on to a database
- •How to view plain HTML reports
- •Overview
- •Getting started
- •Record Selection
- •Grouping and sorting
- •Completing the report
- •Introduction
- •Working with Arbor Essbase data
- •HANDS-ON (Reporting on OLAP data)
- •How to create a cross-tab with Essbase data
- •Using multiple sections in reports
- •HANDS-ON (Multiple Section Reports)
- •How to work with text objects
- •How to create a form letter using a text object
- •How to format objects conditionally
- •How to print conditional messages in form letters
- •How to alternate background colors for rows
- •How to eliminate blank lines
- •How to add blank lines conditionally
- •Formatting concepts
- •Absolute formatting
- •Types of formatting properties
- •Conditional formatting
- •HANDS-ON (Absolute Formatting)
- •How to add color, shading, and borders
- •How to add/edit lines and boxes
- •How to change margins
- •How to add/delete white space between rows
- •How to set page orientation and paper size
- •HANDS-ON (Conditional Formatting)
- •How to flag values that meet certain conditions
- •Record selection
- •Group selection
- •Record selection formula templates
- •HANDS-ON (Record and Group Selection)
- •How to create a record or group selection formula
- •How to use record/group selection templates
- •How to select the top or bottom N groups
- •Sorting, Grouping, and Totalling Overview
- •Creating custom groups
- •HANDS-ON (Sorting, Grouping, and Totalling)
- •How to do a single field sort
- •How to do a multiple field sort
- •How to group data
- •How to sort records within groups
- •How to summarize grouped data
- •How to subtotal grouped data
- •How to sort based on summarized group values
- •How to create multiple levels of subtotals
- •How to group data in intervals
- •How to calculate a percentage of the grand total
- •How to create group headers
- •What are formulas?
- •Other formula conventions
- •Formula syntax
- •How formulas are evaluated - Order of precedence
- •HANDS-ON (Formulas 101)
- •How to insert a formula in your report
- •How to delete formulas from your report
- •How to copy formulas from online Help
- •How to copy formulas from one report to another
- •How to create if-then-else formulas
- •How to format text with formulas
- •How to use variables in formulas
- •How to declare a variable
- •How to assign a value to a variable
- •How to conditionally assign values to variables
- •How to use an array in a formula
- •How to use a range in a formula
- •How to use semicolons in formulas
- •How to fine tune group selection formulas
- •How to fine tune record selection formulas
- •How to debug a formula
- •Introduction
- •HANDS-ON (Advanced Totalling)
- •How to maintain running totals in a list
- •How to subtotal running totals within groups
- •How to subtotal without grouping
- •How to subtotal true A to B, A to C reports
- •Parameter field objects overview
- •Multiple parameter fields
- •Parameter field considerations
- •HANDS-ON (Parameter Field Objects)
- •How to create a parameter field
- •How to use a parameter field in a formula
- •How to respond to parameter field prompts
- •How to use wildcards with parameter fields
- •How to set a report title using parameter fields
- •How to set sort order using parameter fields
- •Graphing Overview
- •Choosing a graph or chart type
- •Where to place your graph
- •Data you can graph on
- •Before you create your graph
- •HANDS-ON (Graphing)
- •How to graph on a summary or subtotal field
- •How to graph on a details field
- •How to graph on a formula field
- •How to graph on cross-tab summaries
- •How to edit graphs using PGEditor
- •How to use the underlay feature with graphs
- •OLE Objects Overview
- •Inserting OLE objects in your reports
- •Linked vs. Embedded Objects
- •The dynamic OLE menu commands
- •OLE and the Picture command
- •General OLE considerations
- •HANDS-ON (OLE Objects)
- •How OLE objects are represented in your report
- •How to use OLE - General Overview Tutorial
- •How to insert a graphic/picture as an OLE object
- •What are subreports?
- •Unlinked vs. linked subreports
- •How subreport linking works
- •HANDS-ON (Subreports)
- •How to insert a subreport
- •How to preview your subreport
- •How to combine unrelated reports using subreports
- •How to use subreports with unlinkable data
- •Cross-tab overview
- •Cross-tab components
- •HANDS-ON (Cross-Tab Objects)
- •How to create a cross-tab object
- •How to format a cross-tab
- •How to print cross-tabs that span multiple pages
- •The Crystal Query Designer
- •HANDS-ON (Queries)
- •How to create a new query
- •How to add tables to a query
- •How to link tables and specify a join type
- •How to add fields to a query
- •How to identify unique values in a query
- •How to summarize data with aggregate functions
- •How to sort records according to field values
- •How to specify records to be included in a query
- •How to select groups to be included in a query
- •How to create an SQL expression
- •How to create a query from another Crystal Query
- •How to select a query for a report
- •How to use a parameter field in a query
- •Dictionaries Overview
- •HANDS-ON (Dictionaries)
- •How to create a new dictionary
- •How to add a data file
- •How to open an SQL or ODBC data source
- •How to link multiple tables
- •How to select tables and fields for users
- •How to add/create formulas
- •How to move fields/field headings within the list
- •How to update the location of a database table
- •How to add a new field heading
- •How to add Help text
- •How to add a graphic
- •How to create sample data for users to browse
- •How to edit an existing dictionary
- •How to convert a 3.x or 4.x dictionary file
- •How to select a dictionary for a report
- •Databases Overview
- •For additional information
- •HANDS-ON (Working With Databases)
- •How to open Access queries through DAO
- •How to open Access queries through ODBC
- •How to open Access parameter queries
- •How to set up an ODBC data source
- •How to check settings for an ODBC data source
- •How to log on to an ODBC data source
- •How to add an ODBC database table to a report
- •How to log on to MS SQL Server via ODBC
- •How to log off an ODBC data source
- •How to set up an A to B, A to C link
- •How to edit an SQL query
- •How to use an ACT! database
- •How to open the NT Event Log
- •Introduction
- •Four types of data
- •Direct access database files
- •ODBC data sources
- •Crystal Query Designer files
- •Crystal Dictionary files
- •Multi-pass reporting
- •Product support
- •Web support
- •E-mail support
- •Fax support
- •Telephone support
- •Extended technical support policy
- •Product registration
- •Product return policy
- •Product replacement policy
- •Glossary
This report displays the running total in each group.
Related Topics
How to create group headers, Page 313
Formulas 101, Page 321
Advanced Formulas, Page 345
Reporting 101, Page 95
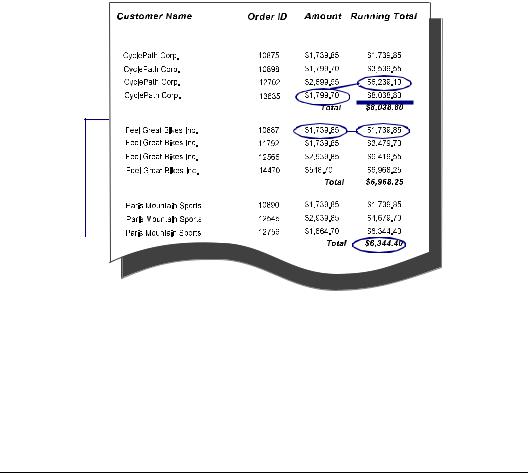
How to subtotal without grouping
The value in each record is added to the sum of the previous value in the report.
The running total starts fresh with each new group.
The final running total for each group becomes the subtotal for that group (Header total).
There may be times when you have a list of values that are ungrouped, and you only want to subtotal some of the values in the list. For example:
●you have a list that contains both Canadian and US customers,
●you want to keep customer records sorted alphabetically based on customer name,
●you do not want to break the data into groups based on the country, but
384 |
Seagate Crystal Reports User’s Guide |

●you want a total of the values from just the Canadian records, and
●you also want a total of the values from just the US records.
To do this you will need to create three formulas, one to keep track of US and Canadian records, one to print the US total, and one to print the Canadian total.
1.USCan
Maintains separate running totals of US and Canadian records.
2.PrintUSA
Prints the grand total of US records.
3.PrintCanada
Prints the grand total of Canadian records.
NOTE: To see an example of this report, open the SUBTOTL.RPT file in the \CRW directory.
To get started, create a report using the sample data, CRAZE.MDB, and place the following fields from left to right in the Details section:
{customer.CUSTOMER NAME} {customer.COUNTRY} {customer.LAST YEAR'S SALES}
Sort the records based on the {customer.CUSTOMER NAME} field.
!Create the formula USCan and enter the following in the Formula Editor:
If {Customer.Country} = “Canada” Then RT (“CanadaAmount”, “Sum”,
ToNumber({Customer.Last Year's Sales}), {Customer.Customer Name})
Else If {Customer.Country} = “USA” Then RT (“USAAmount”, “Sum”,
ToNumber({Customer.Last Year's Sales}), {Customer.Customer Name})
Else 0
Advanced Totalling |
385 |
This formula says look at each record:
●If the value in the {customer.COUNTRY} field is “Canada”, add the value in the {customer.LAST YEAR’S SALES} field to the value in the CanadaAmount variable.
●If the value in the {customer.COUNTRY} field is “USA”, add the value in the {customer.LAST YEAR’S SALES} field to the value in the USAAmount variable.
●If the value is something other than “Canada” or “USA”, print 0.
"Place this formula in the Details section, just to the right of the {customer.LAST YEAR’S SALES} field.
NOTE: It is critical that you place this formula in the Details section. Since the formula has to evaluate each record, it has to run every time the program prints a record and that happens only if you place it in the Details section. See Area printing
characteristics, Page 69.
#Create the PrintCanada formula and enter the following in the Formula Editor:
RT (“CanadaAmount”, “Fetchsum”, ToNumber({Customer.Last Year's Sales}),““)
This formula says to print, as a total, the value in the CanadaAmount variable.
$Place this formula in the Report Footer section, just below the Last Year’s Sales field.
NOTE: It is critical that you place this formula in the Report Footer section so it gets evaluated and printed just once, at the end of the report. This will provide you with a total of all the US values for the entire report. See Area printing characteristics, Page 69.
%Create the PrintUSA formula and enter the following in the Formula Editor:
RT (“USAAmount”, “Fetchsum”, ToNumber({Customer.Last Year's Sales}),““)
This formula says to print, as a total, the value in the USAAmount variable.
386 |
Seagate Crystal Reports User’s Guide |
●Place this formula in the Report Footer section, just to the right of the @PrintCanada formula.
NOTE: Just as before, it is critical that you place this formula in the Report Footer section.
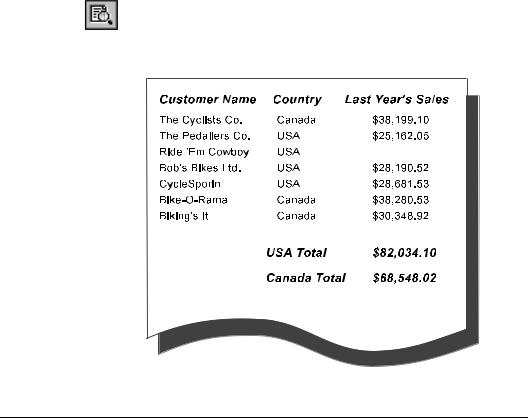
Your report should look similar to the following:
NOTE: This example report has been designed to illustrate concepts only, not the actual look of your finished report.
How to subtotal true A to B, A to C reports
The term A to B, A to C report has been used to refer to any report in which a primary table is linked to two lookup tables (see
Methods of looking up tables (direct access databases), Page 532). However, in a true A to B, A to C link, a single field in the primary table is used to link to both of the lookup tables.
In a true A to B, A to C relationship, one of the two lookup tables usually has more records than the other. If you group these records based on a field in the primary table, values in the smaller
Advanced Totalling |
387 |
lookup table are repeated for each value in the larger lookup table. The following table shows data for an A to B, A to C relationship. The Customer table is linked to the Credits table and again to the Orders table. Notice that Jones has only one Credit ID, but that credit and its amount are repeated, once for each of Jones’ two orders.
Name |
Credit ID |
Credit |
Order ID |
Order |
|
Amount |
Amount |
||||
|
|
|
|||
|
|
|
|
|
|
|
|
|
|
|
|
Jones |
1 |
-10.00 |
1 |
10.00 |
|
|
|
|
|
|
|
Jones |
1 |
-10.00 |
2 |
12.00 |
|
|
|
|
|
|
|
|
|
|
|
|
|
Smith |
2 |
-23.00 |
3 |
20.00 |
|
|
|
|
|
|
|
Smith |
3 |
-45.00 |
4 |
30.00 |
|
|
|
|
|
|
Using a standard subtotal on these groups for both the Order Amount field and the Credit Amount field, the single credit for Jones is counted twice, and the subtotal displays an inaccurate value of -20.00. It should only count this value once and display a subtotal of -10.00 because that is the total credit Jones has.
Name |
Credit ID |
Credit |
Order ID |
Order |
|
Amount |
Amount |
||||
|
|
|
|||
|
|
|
|
|
|
|
|
|
|
|
|
Jones |
1 |
-10.00 |
1 |
10.00 |
|
|
|
|
|
|
|
Jones |
1 |
-10.00 |
2 |
12.00 |
|
|
|
-20.00 |
|
22.00 |
|
|
|
|
|
|
|
|
|
|
|
|
|
Smith |
2 |
-23.00 |
3 |
20.00 |
|
|
|
|
|
|
|
Smith |
3 |
-45.00 |
4 |
30.00 |
|
|
|
-68.00 |
|
50.00 |
|
|
|
|
|
|
NOTE: Notice that the total Credit Amount for Jones is incorrect.
This problem would also occur in the Order Amount field if, for instance, Jones had two different Credit Amounts and only one Order Amount. You can avoid this problem by creating a formula for each field you want subtotaled, and placing the formula in the Group Footer (GF).
388 |
Seagate Crystal Reports User’s Guide |

NOTE: For an example of this report, open the TRUEABAC.RPT file in the \CRW directory.
To get started, create a report using the sample data, ORDRCR.MDB, and place the following fields from left to right in the Details section:
{cust.NAME} {credits.CREDIT ID} {credits.CREDIT AMOUNT} {orders.ORDER ID} {orders.ORDER AMOUNT}
NOTE: The sample data in ORDRCR.MDB has been specially designed to demonstrate a true A to B, A to C link. Make sure that the {credits.CUST} field is linked to both the {orders.CUSTOMER} and {cust.NUMBER} fields in the Visual Linking Expert.
In the Design Tab, highlight the {orders.ORDER AMOUNT} field and insert a subtotal, grouping on the {cust.NAME} field.
!Create a second subtotal for {credits.CREDIT}, again grouping on {cust.NAME}.
"Click the Preview Tab, and notice that the {credits.CREDIT AMOUNT} subtotal for Jones is twice as large as it should be (there is only one credit for Jones, but it appears twice, once for each order).
#Create a new formula, named Credits Subtotal. Enter the following in the Formula Editor:
DistinctCount({credits.CREDIT ID}, {cust.NAME}) * Average({credits.CREDIT}, {cust.NAME})
This formula says:
Count the number of actual credits given to the customer in {cust.NAME}. Multiply this value by the average of all credit amounts displayed in the report for the customer in {cust.NAME}.
Advanced Totalling |
389 |
Jones has only one credit. The average of all of the credit amounts displayed for Jones is -10.00 (-10.00 + -10.00 = -20.00, -20.00 / 2 = -10.00).
$Click Accept in the Formula Editor and place the formula in the Group Footer (GF) section next to the subtotal on the {credits.CREDIT AMOUNT} field.
%Notice that the new formula-based subtotal produces the correct result. Delete the original, incorrect subtotal for the {credits.CREDIT AMOUNT} field.
Related Topics
Formulas 101, Page 321
Advanced Formulas, Page 345
Reporting 101, Page 95
390 |
Seagate Crystal Reports User’s Guide |
16 Parameter Fields
What you will find in this chapter...
Parameter field objects overview, Page 392
Multiple parameter fields, Page 393
Parameter field considerations, Page 393
HANDS-ON (Parameter Field Objects), Page 394
Parameter Fields |
391 |