

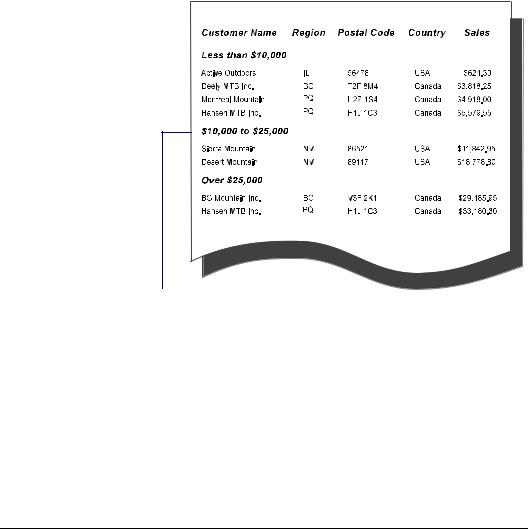
This report is grouped by interval in a specified order.
NOTE: To see an example of the above report, open the
SGT11.RPT file in the \CRW directory.
Related Topics
Formulas 101, Page 321
How to group based on first letter of company name, Page 301
How to create group headers, Page 313
How to calculate a percentage of the grand total
In some reports, you want to see what percentage of the grand total each group contributes. In this example, you will create a report that subtotals orders by country and then determines what percent of total worldwide sales each country generated. The process is simple and straightforward. It uses built-in subtotaling techniques plus one simple formula.
310 |
Seagate Crystal Reports User’s Guide |
To get started, create a report using the sample data, CRAZE.MDB, and place the following fields from left to right in the Details section:
{customer.CUSTOMER NAME} {customer.REGION} {customer.COUNTRY} {orders.ORDER AMOUNT}
Right-click the Order Amount field and choose the INSERT SUBTOTAL command from the shortcut menu that appears.
!When the Insert Subtotal dialog box appears, specify Country as your sort and group by field and click OK.
This calculates the sales for each country. It breaks your data into country groups and subtotals each group.
This field will
be subtotaled...
whenever the value in this field changes.
"Right-click the Order Amount field again and choose the INSERT GRAND TOTAL command from the shortcut menu that appears. When the Insert Grand Total dialog box appears, make sure that the function is set to sum and then click OK. Search for Summary functions in Seagate Crystal Reports online Help.
Sorting, Grouping, and Totalling |
311 |
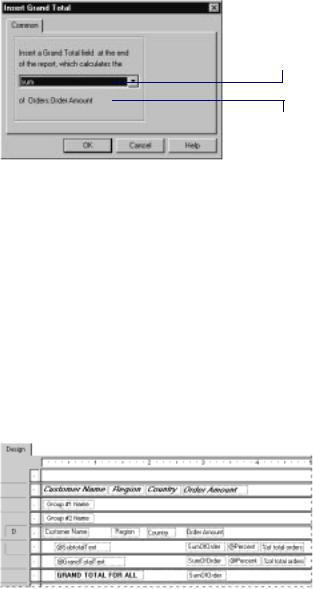
This calculates world wide sales, the total of all sales in the report.
The operation to be performed on the field.
The field that is going to be totaled.
All that is left to do now is to determine the percentage of worldwide sales generated by each country. To do this you will need to create a simple formula.
#Open the Formula Editor and enter the following formula in the Formula text box:
Sum ({orders.ORDER AMOUNT}, {customer.COUNTRY})/Sum ({orders.ORDER AMOUNT})*100
See Formulas 101, Page 321.
$Place the formula in the Group Footer section of the report, just to the right of the Country subtotal.
After you add labels, headers, and formatting, and you run the report, the Design Tab should look similar to this:
312 |
Seagate Crystal Reports User’s Guide |
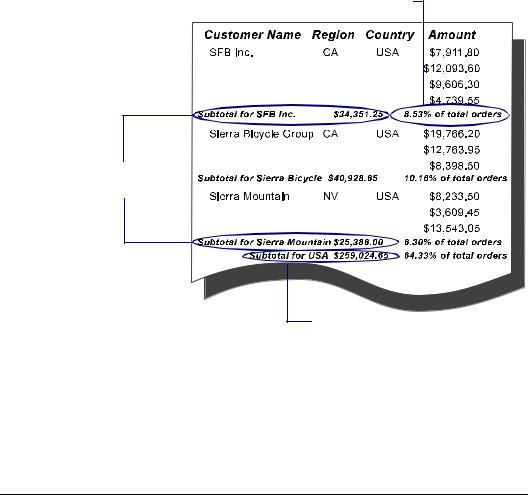
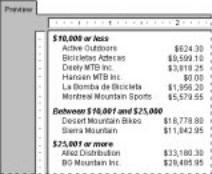
Your report should look similar to the following:
NOTE: This example report has been designed to illustrate concepts only, not the actual look of your finished report.
The program calculates the percent of total sales each customer and each country contributes.
Each customer is subtotaled.
Each country is subtotaled.
NOTE: To see an example of the above report, open the
SGT12.RPT file in the \CRW directory.
Related Topics
Formulas 101, Page 321
How to create group headers
Whenever you create a group, a subtotal, or a summary, the program creates both a Group Footer (GF) section (where it places any subtotal or summary value), and a Group Header (GH)
Sorting, Grouping, and Totalling |
313 |
|
section (where it automatically places the group name/header). |
|
Group Headers are useful, even necessary, if you want your |
|
report data to be clear and easily understood. Though the |
|
program creates a group header automatically, you may find that |
|
you would like to change/modify the header to suit your needs. |
|
In this topic you will learn how to create the five most common |
|
kinds of group headers: |
|
● Standard headers, Page 314, |
|
● Live headers, Page 315, |
|
● Live headers for groups based on a formula, Page 317, and |
|
● Headers for custom groups, Page 318. |
Standard |
A standard header is a block of text that is used to identify each |
headers |
group in a rather generic kind of way. “Customer”, “State”, and |
|
“Monthly Orders” are all examples of this kind of header. |
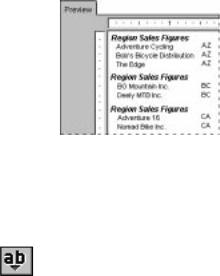
While the header is somewhat descriptive (“Region Sales Figures” clearly means it is a regional group), you never know what region is in the group without first looking at the details in the group.
Nonetheless, this kind of header has its place and it is easy to create.
To create a standard header, click the INSERT TEXT OBJECT button on the standard toolbar.
When the object pointer appears, move the object frame into the Group Header section where you want it to print.
!Click inside the frame to select the object for editing, then enter the text you want to use for your header.
314 |
Seagate Crystal Reports User’s Guide |

Live headers
"Click outside the frame when finished to complete the process. Now when you run the report, the same header will appear at the beginning of each group. See How to insert text objects, Page 120.
A live header is a header that changes based on the content of the group. If you have your data subtotaled by region, for example, a live header would typically identify the region detailed in each group. Thus, the Arizona group would have a header identifying the data as Arizona data, the California group would have a header identifying the data as California data, and so on.
NOTE: When you create a group, the program automatically inserts a group name field in the Group Header section unless you have toggled the option off using the OPTIONS command on the
File menu. The information that follows details how you can manually insert such a section (if you do not have the program insert one automatically) and how to create different kinds of live headers for different needs.
GROUP NAME ONLY
The easiest live header to create is simply an identifying field value. To create this kind of live header for region groups, for example, you simply insert a Group Name field in the Group Header section. This prints Arizona (or AZ) at the beginning of the Arizona group, California (or CA) at the beginning of the California group, and so on.
Click the INSERT FIELDS button on the standard toolbar. The Insert Field dialog box appears.
Click the Group Name Tab to activate it.
!Select the Group Name field that matches the group you are working with and drag it into the Group Header section for that group.
" Format the field as desired.
Now, when you run the report, the region identifier will appear as the group header for each region group.
Sorting, Grouping, and Totalling |
315 |
GROUP NAME WITH TEXT
A more complex kind of live header combines text and a field value. A typical group header of this kind for data broken down by region would be, “Sales for California” or “Customers in Postal Code 60606". To create these headers involves three steps:
1.Insert a text object in the Group Header section.
2.Type in the text you want to appear.
3.Enter the Group Name field in the text field where you want it to appear in the Group Header.
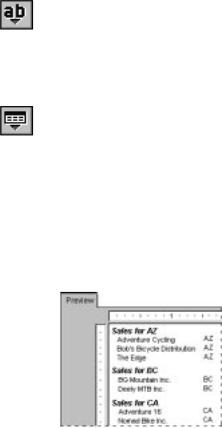
For example, if you want your header to read “Sales for” and then the name of the region in the current group (Sales for AZ, Sales for CA, and so forth), follow these steps:
Click the INSERT TEXT OBJECT button on the standard toolbar.
Move the frame for that object in the Group Header section for the group.
!Click inside the object to set the insertion point and type in “Sales for” and a space after it.
"Click the INSERT FIELDS button on the standard toolbar. The Insert Field dialog box appears.
# Click the Group Name Tab to activate it.
$Select the Group Name Field that matches the group, and drag it into the text object, immediately after the text and the space you entered.
% Format the text object as you want it to appear.
Now, when you run the report, the program will create a live header (with text) for each of your groups.
316 |
Seagate Crystal Reports User’s Guide |
Live headers for
groups based on a formula
When you create a group and use a formula field as a sort and group by field, the program automatically creates a group name field based on the value returned by the formula.
For example, if you create this formula:
{customer.CUSTOMER NAME}[1]
and then group on the formula, the program will group your data based on the first letter in the Customer Name field.
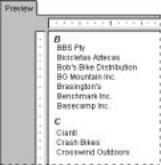
To create a live group header for a group based on a formula, simply insert the group name field in the Group Header section.
When you run the report, the “A” group will have the letter “A” as a header, the “B” group the letter “B”, and so on. For more information, see How to group based on first letter of company name, Page 301.
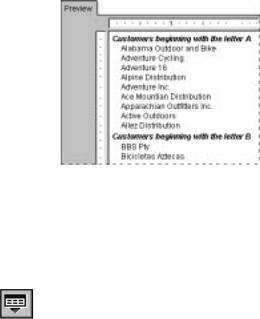
To create a more descriptive header such as “Customers beginning with the letter B”, you simply follow these four steps:
Insert a text object in the Group Header section. Type in this text:
Customers beginning with the letter
! Add a space.
"Insert the group name field into the text object and place it right after the space.
Sorting, Grouping, and Totalling |
317 |
Headers for custom groups
NOTE: If the program automatically inserted a group name field in the Group Header section, you will need to delete that field so you do not have duplicate headers.
The final kind of header is a header for the kinds of custom groups you create when you group things in specified order. When using specified order grouping, you specify the name for each group and the records that belong in it. As in the other grouping situations, the program again creates a group name field for each group based on the group names you specified.
Click the INSERT FIELDS button on the standard toolbar. The Insert Field dialog box appears.
Click the Group Name Tab to activate it.
!Select the Group Name field for the custom group and drag it into the Group Header section for that group.
The program will automatically apply each of the group names you assigned to the appropriate group.
NOTE: Make certain that when you assign the names to the groups using the Define Named Group dialog box, the names you assign are the names you want to appear as group headers.
318 |
Seagate Crystal Reports User’s Guide |
Sorting, Grouping, and Totalling |
319 |
320 |
Seagate Crystal Reports User’s Guide |
13 Formulas 101
What you will find in this chapter...
What are formulas?, Page 322
How formulas are created - An introduction to the Formula Editor, Page 327
Other formula conventions, Page 331
Formula syntax, Page 334
How formulas are evaluated - Order of precedence, Page 337
HANDS-ON (Formulas 101), Page 338
Formulas 101 |
321 |