- •Welcome to Seagate Crystal Reports
- •Welcome
- •Two kinds of Hands-On tutorials
- •Command, button, key, and control conventions
- •Using Seagate Crystal Reports documentation
- •Seagate Crystal Reports online Help features
- •If you need more help...
- •Installation Requirements
- •Installing Seagate Crystal Reports
- •Installing on a network workstation
- •Upgrading from a previous version
- •Quick Start
- •Subreports expand report usefulness
- •Query Designer adds ad-hoc querying capabilities
- •Parameter fields mean multi-purpose reports
- •Text objects give you text with intelligence
- •Preprinted-form reports easier than ever
- •More powerful formulas extend your capabilities
- •Web solution serves up variety of online reports
- •HTML exporting simplifies Web activities
- •New database support improves data access
- •Running totals made easy
- •Smart Navigation
- •Learning Seagate Crystal Reports
- •User’s Guide
- •Online Help
- •Books Online
- •Sample Reports
- •Glossary
- •Sample Data - CRAZE.MDB
- •Suggested learning paths
- •The application window
- •Menu bar
- •Standard toolbar
- •Supplementary toolbar
- •Format bar
- •Status bar
- •Shortcut menus
- •Cursors
- •Design Tab
- •Preview Tab
- •Other fundamentals
- •HANDS-ON (Report Design Environment)
- •How to add, delete, and move guidelines
- •How to move and position objects using guidelines
- •How to turn the grid on/off
- •How to zoom your report in and out
- •How to undo/redo activities
- •How to drill down on summarized data
- •HANDS-ON (Sections and Areas)
- •How to add, delete, move, and merge sections
- •How to split and resize sections
- •Basic report design
- •How to design a prototype
- •Concepts in reporting
- •Beyond basic reports
- •HANDS-ON (Report Creation and Design)
- •How to select data and begin creating a report
- •How to add and link multiple tables
- •How to insert database fields
- •How to insert special fields
- •How to insert a page n of N field
- •How to insert text objects
- •How to use a database field in a text object
- •How to insert a picture
- •How to select, move, and resize objects
- •How to hide parts of the report
- •HANDS-ON (Finishing Your Report)
- •How to insert page headers and footers
- •How to add a title page to your report
- •How to add summary information to your report
- •Printing considerations
- •Design solutions for printing/distributing
- •Report creation checklist for distributed reports
- •Updating printer drivers
- •Report distribution
- •HANDS-ON (Distributing Your Report)
- •How to export reports
- •How to fax a report
- •How to request reports from a web browser
- •How to specify parameter field values
- •How to log on to a database
- •How to view plain HTML reports
- •Overview
- •Getting started
- •Record Selection
- •Grouping and sorting
- •Completing the report
- •Introduction
- •Working with Arbor Essbase data
- •HANDS-ON (Reporting on OLAP data)
- •How to create a cross-tab with Essbase data
- •Using multiple sections in reports
- •HANDS-ON (Multiple Section Reports)
- •How to work with text objects
- •How to create a form letter using a text object
- •How to format objects conditionally
- •How to print conditional messages in form letters
- •How to alternate background colors for rows
- •How to eliminate blank lines
- •How to add blank lines conditionally
- •Formatting concepts
- •Absolute formatting
- •Types of formatting properties
- •Conditional formatting
- •HANDS-ON (Absolute Formatting)
- •How to add color, shading, and borders
- •How to add/edit lines and boxes
- •How to change margins
- •How to add/delete white space between rows
- •How to set page orientation and paper size
- •HANDS-ON (Conditional Formatting)
- •How to flag values that meet certain conditions
- •Record selection
- •Group selection
- •Record selection formula templates
- •HANDS-ON (Record and Group Selection)
- •How to create a record or group selection formula
- •How to use record/group selection templates
- •How to select the top or bottom N groups
- •Sorting, Grouping, and Totalling Overview
- •Creating custom groups
- •HANDS-ON (Sorting, Grouping, and Totalling)
- •How to do a single field sort
- •How to do a multiple field sort
- •How to group data
- •How to sort records within groups
- •How to summarize grouped data
- •How to subtotal grouped data
- •How to sort based on summarized group values
- •How to create multiple levels of subtotals
- •How to group data in intervals
- •How to calculate a percentage of the grand total
- •How to create group headers
- •What are formulas?
- •Other formula conventions
- •Formula syntax
- •How formulas are evaluated - Order of precedence
- •HANDS-ON (Formulas 101)
- •How to insert a formula in your report
- •How to delete formulas from your report
- •How to copy formulas from online Help
- •How to copy formulas from one report to another
- •How to create if-then-else formulas
- •How to format text with formulas
- •How to use variables in formulas
- •How to declare a variable
- •How to assign a value to a variable
- •How to conditionally assign values to variables
- •How to use an array in a formula
- •How to use a range in a formula
- •How to use semicolons in formulas
- •How to fine tune group selection formulas
- •How to fine tune record selection formulas
- •How to debug a formula
- •Introduction
- •HANDS-ON (Advanced Totalling)
- •How to maintain running totals in a list
- •How to subtotal running totals within groups
- •How to subtotal without grouping
- •How to subtotal true A to B, A to C reports
- •Parameter field objects overview
- •Multiple parameter fields
- •Parameter field considerations
- •HANDS-ON (Parameter Field Objects)
- •How to create a parameter field
- •How to use a parameter field in a formula
- •How to respond to parameter field prompts
- •How to use wildcards with parameter fields
- •How to set a report title using parameter fields
- •How to set sort order using parameter fields
- •Graphing Overview
- •Choosing a graph or chart type
- •Where to place your graph
- •Data you can graph on
- •Before you create your graph
- •HANDS-ON (Graphing)
- •How to graph on a summary or subtotal field
- •How to graph on a details field
- •How to graph on a formula field
- •How to graph on cross-tab summaries
- •How to edit graphs using PGEditor
- •How to use the underlay feature with graphs
- •OLE Objects Overview
- •Inserting OLE objects in your reports
- •Linked vs. Embedded Objects
- •The dynamic OLE menu commands
- •OLE and the Picture command
- •General OLE considerations
- •HANDS-ON (OLE Objects)
- •How OLE objects are represented in your report
- •How to use OLE - General Overview Tutorial
- •How to insert a graphic/picture as an OLE object
- •What are subreports?
- •Unlinked vs. linked subreports
- •How subreport linking works
- •HANDS-ON (Subreports)
- •How to insert a subreport
- •How to preview your subreport
- •How to combine unrelated reports using subreports
- •How to use subreports with unlinkable data
- •Cross-tab overview
- •Cross-tab components
- •HANDS-ON (Cross-Tab Objects)
- •How to create a cross-tab object
- •How to format a cross-tab
- •How to print cross-tabs that span multiple pages
- •The Crystal Query Designer
- •HANDS-ON (Queries)
- •How to create a new query
- •How to add tables to a query
- •How to link tables and specify a join type
- •How to add fields to a query
- •How to identify unique values in a query
- •How to summarize data with aggregate functions
- •How to sort records according to field values
- •How to specify records to be included in a query
- •How to select groups to be included in a query
- •How to create an SQL expression
- •How to create a query from another Crystal Query
- •How to select a query for a report
- •How to use a parameter field in a query
- •Dictionaries Overview
- •HANDS-ON (Dictionaries)
- •How to create a new dictionary
- •How to add a data file
- •How to open an SQL or ODBC data source
- •How to link multiple tables
- •How to select tables and fields for users
- •How to add/create formulas
- •How to move fields/field headings within the list
- •How to update the location of a database table
- •How to add a new field heading
- •How to add Help text
- •How to add a graphic
- •How to create sample data for users to browse
- •How to edit an existing dictionary
- •How to convert a 3.x or 4.x dictionary file
- •How to select a dictionary for a report
- •Databases Overview
- •For additional information
- •HANDS-ON (Working With Databases)
- •How to open Access queries through DAO
- •How to open Access queries through ODBC
- •How to open Access parameter queries
- •How to set up an ODBC data source
- •How to check settings for an ODBC data source
- •How to log on to an ODBC data source
- •How to add an ODBC database table to a report
- •How to log on to MS SQL Server via ODBC
- •How to log off an ODBC data source
- •How to set up an A to B, A to C link
- •How to edit an SQL query
- •How to use an ACT! database
- •How to open the NT Event Log
- •Introduction
- •Four types of data
- •Direct access database files
- •ODBC data sources
- •Crystal Query Designer files
- •Crystal Dictionary files
- •Multi-pass reporting
- •Product support
- •Web support
- •E-mail support
- •Fax support
- •Telephone support
- •Extended technical support policy
- •Product registration
- •Product return policy
- •Product replacement policy
- •Glossary
Formatting concepts
In this section, you will learn about formatting your report. Formatting refers to those things that you can do to change the layout and design of your report, as well as the appearance of text, objects, or entire report sections.
You can use formatting to do many things:
●separate sections of your report,
●call attention to certain data,
●change the presentation of dates, numbers, Boolean, currency values, and text (strings),
●hide unwanted sections, or
●give your report a professional appearance.
Seagate Crystal Reports gives you a wide range of formatting commands and properties that you can apply to various elements in your report.
●Use formatting commands by choosing or setting options in dialog boxes that are specific to the kind of formatting you are doing. For example, if you want to change page margins, use a dialog box that lets you specify the top, bottom, right, and left margins.
●Set formatting properties in either the FORMAT EDITOR (for objects) or the SECTION EXPERT (for sections) by toggling check boxes on and off or by supplying attribute values. In most cases, you can set the properties in one of two ways:
¾Absolute (always apply the property), or
¾Conditional (apply the property only if certain criteria are met).
You can use both kinds of formatting properties wherever you need them in your report. See Absolute formatting, Page 233, and
Conditional formatting, Page 235.
In the topics that follow, you will learn about the kinds of formatting you can do with Seagate Crystal Reports, and you will get step-by- step instructions for performing a variety of formatting tasks.
232 |
Seagate Crystal Reports User’s Guide |
Absolute formatting
Absolute formatting is formatting that applies under any condition.
SELECT, THEN APPLY
Absolute formatting always follows a select then apply procedure:
●you select what it is that you want to format (an object or a section), and then
●you apply the formatting to your selection using property settings.
Use the following dialog boxes for formatting your reports:
●Format Editor for formatting field values.
¾Borders Tab of the FORMAT EDITOR for formatting objects, numbers, and text,
¾Box Tab of the FORMAT EDITOR for formatting boxes, and
¾Line Tab of the FORMAT EDITOR for formatting lines.
●Section Expert for formatting entire sections.
Each of these dialog boxes contains a number of different formatting properties and the tools for turning the properties on or off, or for specifying attributes. Search for the dialog box by name in Seagate Crystal Reports online Help.
.
Types of formatting properties
Formatting properties fall into two general categories:
●On or Off Properties
●Attribute Properties
Formatting |
233 |
ON OR OFF PROPERTIES
An on or off property is a property that is set using a check box.
●When you toggle the check box on, the property is always applied.
●When you toggle the check box off, the property is never applied.
The Suppress property is one such on or off property; an object or section is either suppressed (on) or it is not (off).
ATTRIBUTE PROPERTIES
An attribute property is a property that specifies one of many alternative attributes. The Color property, for example, gives you the opportunity to specify one of the 16 basic Windows colors or to specify a custom color and then create that color using the tools provided. Clearly such a property can not be handled with a simple on or off switch.
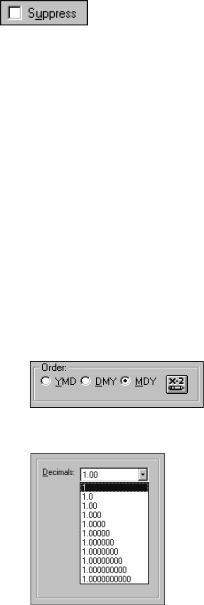
You set an attribute property in one of several ways, depending on the property. You can set it:
●by clicking an option button,
●by selecting an attribute from a drop-down box,
234 |
Seagate Crystal Reports User’s Guide |
● or, by typing an attribute in a text box.
Conditional formatting
Conditional on
or off properties
Conditional formatting is formatting that applies only under certain conditions. For example, you may only want:
●customer balances printed in red if they are past due,
●the dates to appear in Day, Month, Year format if the customer is Canadian, or
●background color to appear on every other line.
Seagate Crystal Reports makes it easy for you to apply formatting conditionally in these and hundreds of other situations. See How to format objects conditionally, Page 224.
With absolute formatting you follow the select then apply procedure. For conditional formatting you follow the same general procedure, but you go a step further and set up conditions that determine whether or not the formatting will be applied. You specify those conditions using simple formulas. See Formulas 101, Page 321.
NOTE: When you set up a conditional formatting formula, the formula overrides any fixed settings you have made in the Format Editor. For example, if you toggle the Suppress option on and then
you set up a conditional formula for the Suppress option, the property will still apply only if the condition in the formula is met.
The program enables you to set both on and off properties and attribute properties conditionally. However, each of these requires a different kind of formula.
A conditional on or off property tests to see if a condition has been met. It is on if the condition is met, off if the condition is not met. There is no middle ground.
Formatting |
235 |
Conditional
attribute properties
Use Boolean formulas for this kind of formatting.
Value = condition
The program tests each value to see if it meets the condition and it returns a yes or no answer. It then applies the property to every value that returns a yes answer.
A conditional attribute property tests to see which of two or more conditions are met. The program then applies the formatting appropriate to the condition. For example, assume that you want values under quota printed in red and all other values printed in black. The program tests to see whether the value is under quota or not. If it is under quota, it applies the red attribute, if it is not, it applies the black attribute.
Use an If-Then-Else formula for this kind of conditional formatting. See How to create if-then-else formulas, Page 346.
If Condition A Then
Red
Else
Black
NOTE: When you set up conditional attribute properties, the program loads a selection of attributes into the Functions list in
the Formula Editor. You can double-click any of those attributes to add them to your formula. For example, if you are setting horizontal alignment conditionally, the Functions list box will
contain attributes such as DefaultHorAligned, LeftAligned, Justified, etc.; if you are setting borders conditionally, the Functions list box will contain attributes such as NoLine,
SingleLine, DashedLine, etc.
You can take this kind of property one step further. You can specify a list of conditions and a property for each; you are not limited to two or three conditions. For example, if you have a number field on your report that contains sales figures from countries around the world, you can specify the number attribute(s) that you want to apply to each country. In this case, your conditions would specify that if it is from Country A, apply the Country A attribute; Country B, apply the Country B attribute; Country C, apply the Country C attribute, and so on.
236 |
Seagate Crystal Reports User’s Guide |
Values that do
not fit any condition
With more than two alternatives, use this kind of formula:
If Condition A Then
Red
Else If Condition B Then
Black
Else If Condition C Then
Green
Else
Blue
Use a multi-condition If-Then-Else formula for this kind of conditional formatting. See How to create multi-condition if-then-else formulas, Page 348.
With conditional on or off properties, values will either meet the condition you set or they will not. But conditional attribute properties are different. There may be some cases where values do not fit any of the conditions you set up.
For example, if you set:
●all sales figures that are more than 10% over quota to appear green, and
●all sales figures that are less than 10% over quota to appear red,
what is going to happen to values that are exactly 10%? The program takes care of that automatically. When a value does not fit any of the conditions in the formula (in this example, all values that are 10%), the program formats that value using the attribute setting in the dialog box.
In this example, if the Color drop-down box on the Font Tab of the Format Editor is set to Blue for the sales field, all values that are exactly 10% will appear in blue. The dialog box setting does not override the formula setting; it simply provides an attribute when the formula does not.
Several Hands-On topics are included showing how to format sections and objects conditionally. While the topics detail specific reporting needs, they illustrate basic procedures as well.
Formatting |
237 |