

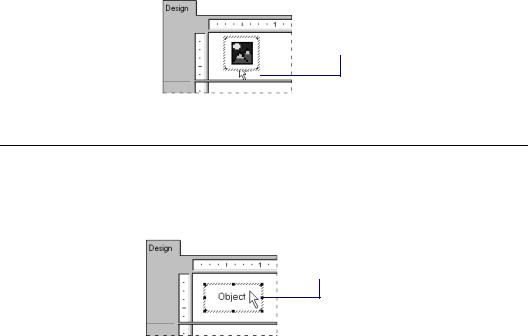
Select the desired picture file from the file list and click Open to return to your report. An object frame appears with your picture inside it ready to be positioned.
3 Position the picture object where you want it to appear in the report and click once.
How to select, move, and resize objects
Selecting objects
Moving and resizing objects
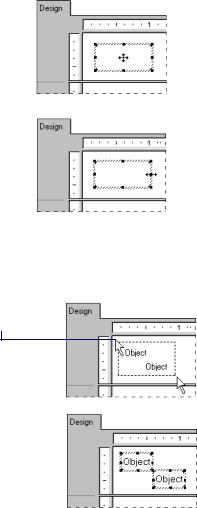
Select an object by clicking it once. An object must be selected to be able to change the font, move the object, etc. When you select an object, sizing handles appear around it.
This frame indicates the object is selected.
Once an object is selected, you then tell the program what you want to do with it. For example, you can move or resize an object as follows:
122 |
Seagate Crystal Reports User’s Guide |
Selecting
multiple objects
To move an
object... Press and hold the mouse button to activate the move cursor and drag the objects to the desired position.
To resize
an object... Drag the handles of the frame to change the size of the objects.
Seagate Crystal Reports allows you to select multiple objects using the marquee selection technique.
1 Position the mouse pointer above and to the left of the objects you want to select.
|
|
2 Drag the selection |
|
|
rectangle to the |
|
|
bottom right of the |
3 When you release |
|
objects, surrounding |
|
||
|
them completely. |
|
the mouse button, the |
|
|
rectangle disappears |
|
|
and object frames |
|
|
appear around the |
|
|
selected objects. |
|
|
Once the objects are selected, you can move them as a group.
NOTE: You can move objects over (across) other objects without affecting the placement of the objects beneath.
You can move fields between sections with the following exceptions:
●grand totals can only be moved within the Report Footer section or to the Report Header section, and
Reporting 101 |
123 |

●a subtotal or summary can be moved only within its originating section or to the header of its originating section.
Related Topics
Formatting concepts, Page 232
How to make an object underlay a following section(s)
In this example you will make the CRAZE logo (CRAZEC.BMP) underlay multiple sections. This is a procedure similar to what you will follow when you want to insert a company watermark to serve as a background for your reports.
To make an object underlay a following section, you place it in the section above the section you want it to underlay. Then you toggle the Underlay Following Sections option on in the Section Expert for the section that you placed it in.
CREATING A SIMPLE REPORT
To get started, you need to create a simple report using the Customer table in CRAZE.MDB (located in the \CRW directory or the directory in which the program resides).
Place {customer.CUSTOMER NAME} and {customer.LAST YEAR’S SALES} side-by-side in the Details section of your report. To eliminate unnecessary objects in this example, delete the field titles that the program places in the Page Header section for each of these fields.
!Break your data into region groups. To do this, choose the GROUP command from the Insert menu and choose {customer.REGION} as the sort and group by field.
124 |
Seagate Crystal Reports User’s Guide |
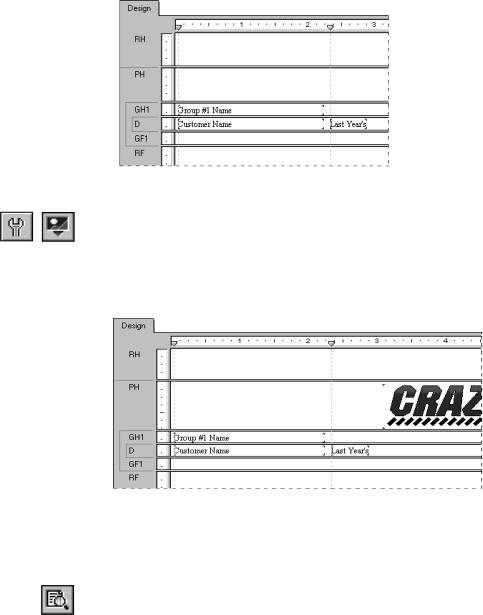
INSERTING A PICTURE
Click the PICTURE button on the supplementary toolbar.
Choose the picture file CRAZEC.BMP (located in the \CRW directory or the directory in which the program resides) and place it in the Page Header section, to the right of the body of your report.
NOTE: In this example, the picture is placed to the right of the fields because it is not meant to underlay the text. When you are working with a watermark, a subdued picture designed to be nearly invisible, place it directly above the text.
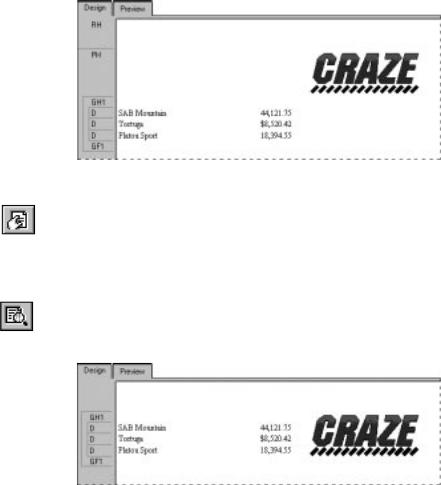
!Click the PRINT PREVIEW button on the standard toolbar. Note that the picture prints first (entirely in the PH section) and then the body of the report follows. Return to the Design Tab when finished previewing.
Reporting 101 |
125 |
UNDERLAYING THE FOLLOWING SECTION(S)
Click the SECTION EXPERT button on the standard toolbar. The Section Expert appears.
Highlight the Page Header section and toggle the Underlay Following Sections option on. See Types of formatting properties, Page 233.
!Preview your work again. Note that now the picture prints in the Group Header and Details sections, next to (instead of above) the text in the body of the report.
NOTE: Placing the picture to the right of the body of the report, as you did here is the same technique you would follow if you wanted a graph or an employee picture to print beside the details that pertain to the graph or to the employee.
"Return to the Design Tab and resize the object vertically so it is two or three times bigger and preview the report again. The bitmap now underlays more sections.
126 |
Seagate Crystal Reports User’s Guide |