
- •Welcome to Seagate Crystal Reports
- •Welcome
- •Two kinds of Hands-On tutorials
- •Command, button, key, and control conventions
- •Using Seagate Crystal Reports documentation
- •Seagate Crystal Reports online Help features
- •If you need more help...
- •Installation Requirements
- •Installing Seagate Crystal Reports
- •Installing on a network workstation
- •Upgrading from a previous version
- •Quick Start
- •Subreports expand report usefulness
- •Query Designer adds ad-hoc querying capabilities
- •Parameter fields mean multi-purpose reports
- •Text objects give you text with intelligence
- •Preprinted-form reports easier than ever
- •More powerful formulas extend your capabilities
- •Web solution serves up variety of online reports
- •HTML exporting simplifies Web activities
- •New database support improves data access
- •Running totals made easy
- •Smart Navigation
- •Learning Seagate Crystal Reports
- •User’s Guide
- •Online Help
- •Books Online
- •Sample Reports
- •Glossary
- •Sample Data - CRAZE.MDB
- •Suggested learning paths
- •The application window
- •Menu bar
- •Standard toolbar
- •Supplementary toolbar
- •Format bar
- •Status bar
- •Shortcut menus
- •Cursors
- •Design Tab
- •Preview Tab
- •Other fundamentals
- •HANDS-ON (Report Design Environment)
- •How to add, delete, and move guidelines
- •How to move and position objects using guidelines
- •How to turn the grid on/off
- •How to zoom your report in and out
- •How to undo/redo activities
- •How to drill down on summarized data
- •HANDS-ON (Sections and Areas)
- •How to add, delete, move, and merge sections
- •How to split and resize sections
- •Basic report design
- •How to design a prototype
- •Concepts in reporting
- •Beyond basic reports
- •HANDS-ON (Report Creation and Design)
- •How to select data and begin creating a report
- •How to add and link multiple tables
- •How to insert database fields
- •How to insert special fields
- •How to insert a page n of N field
- •How to insert text objects
- •How to use a database field in a text object
- •How to insert a picture
- •How to select, move, and resize objects
- •How to hide parts of the report
- •HANDS-ON (Finishing Your Report)
- •How to insert page headers and footers
- •How to add a title page to your report
- •How to add summary information to your report
- •Printing considerations
- •Design solutions for printing/distributing
- •Report creation checklist for distributed reports
- •Updating printer drivers
- •Report distribution
- •HANDS-ON (Distributing Your Report)
- •How to export reports
- •How to fax a report
- •How to request reports from a web browser
- •How to specify parameter field values
- •How to log on to a database
- •How to view plain HTML reports
- •Overview
- •Getting started
- •Record Selection
- •Grouping and sorting
- •Completing the report
- •Introduction
- •Working with Arbor Essbase data
- •HANDS-ON (Reporting on OLAP data)
- •How to create a cross-tab with Essbase data
- •Using multiple sections in reports
- •HANDS-ON (Multiple Section Reports)
- •How to work with text objects
- •How to create a form letter using a text object
- •How to format objects conditionally
- •How to print conditional messages in form letters
- •How to alternate background colors for rows
- •How to eliminate blank lines
- •How to add blank lines conditionally
- •Formatting concepts
- •Absolute formatting
- •Types of formatting properties
- •Conditional formatting
- •HANDS-ON (Absolute Formatting)
- •How to add color, shading, and borders
- •How to add/edit lines and boxes
- •How to change margins
- •How to add/delete white space between rows
- •How to set page orientation and paper size
- •HANDS-ON (Conditional Formatting)
- •How to flag values that meet certain conditions
- •Record selection
- •Group selection
- •Record selection formula templates
- •HANDS-ON (Record and Group Selection)
- •How to create a record or group selection formula
- •How to use record/group selection templates
- •How to select the top or bottom N groups
- •Sorting, Grouping, and Totalling Overview
- •Creating custom groups
- •HANDS-ON (Sorting, Grouping, and Totalling)
- •How to do a single field sort
- •How to do a multiple field sort
- •How to group data
- •How to sort records within groups
- •How to summarize grouped data
- •How to subtotal grouped data
- •How to sort based on summarized group values
- •How to create multiple levels of subtotals
- •How to group data in intervals
- •How to calculate a percentage of the grand total
- •How to create group headers
- •What are formulas?
- •Other formula conventions
- •Formula syntax
- •How formulas are evaluated - Order of precedence
- •HANDS-ON (Formulas 101)
- •How to insert a formula in your report
- •How to delete formulas from your report
- •How to copy formulas from online Help
- •How to copy formulas from one report to another
- •How to create if-then-else formulas
- •How to format text with formulas
- •How to use variables in formulas
- •How to declare a variable
- •How to assign a value to a variable
- •How to conditionally assign values to variables
- •How to use an array in a formula
- •How to use a range in a formula
- •How to use semicolons in formulas
- •How to fine tune group selection formulas
- •How to fine tune record selection formulas
- •How to debug a formula
- •Introduction
- •HANDS-ON (Advanced Totalling)
- •How to maintain running totals in a list
- •How to subtotal running totals within groups
- •How to subtotal without grouping
- •How to subtotal true A to B, A to C reports
- •Parameter field objects overview
- •Multiple parameter fields
- •Parameter field considerations
- •HANDS-ON (Parameter Field Objects)
- •How to create a parameter field
- •How to use a parameter field in a formula
- •How to respond to parameter field prompts
- •How to use wildcards with parameter fields
- •How to set a report title using parameter fields
- •How to set sort order using parameter fields
- •Graphing Overview
- •Choosing a graph or chart type
- •Where to place your graph
- •Data you can graph on
- •Before you create your graph
- •HANDS-ON (Graphing)
- •How to graph on a summary or subtotal field
- •How to graph on a details field
- •How to graph on a formula field
- •How to graph on cross-tab summaries
- •How to edit graphs using PGEditor
- •How to use the underlay feature with graphs
- •OLE Objects Overview
- •Inserting OLE objects in your reports
- •Linked vs. Embedded Objects
- •The dynamic OLE menu commands
- •OLE and the Picture command
- •General OLE considerations
- •HANDS-ON (OLE Objects)
- •How OLE objects are represented in your report
- •How to use OLE - General Overview Tutorial
- •How to insert a graphic/picture as an OLE object
- •What are subreports?
- •Unlinked vs. linked subreports
- •How subreport linking works
- •HANDS-ON (Subreports)
- •How to insert a subreport
- •How to preview your subreport
- •How to combine unrelated reports using subreports
- •How to use subreports with unlinkable data
- •Cross-tab overview
- •Cross-tab components
- •HANDS-ON (Cross-Tab Objects)
- •How to create a cross-tab object
- •How to format a cross-tab
- •How to print cross-tabs that span multiple pages
- •The Crystal Query Designer
- •HANDS-ON (Queries)
- •How to create a new query
- •How to add tables to a query
- •How to link tables and specify a join type
- •How to add fields to a query
- •How to identify unique values in a query
- •How to summarize data with aggregate functions
- •How to sort records according to field values
- •How to specify records to be included in a query
- •How to select groups to be included in a query
- •How to create an SQL expression
- •How to create a query from another Crystal Query
- •How to select a query for a report
- •How to use a parameter field in a query
- •Dictionaries Overview
- •HANDS-ON (Dictionaries)
- •How to create a new dictionary
- •How to add a data file
- •How to open an SQL or ODBC data source
- •How to link multiple tables
- •How to select tables and fields for users
- •How to add/create formulas
- •How to move fields/field headings within the list
- •How to update the location of a database table
- •How to add a new field heading
- •How to add Help text
- •How to add a graphic
- •How to create sample data for users to browse
- •How to edit an existing dictionary
- •How to convert a 3.x or 4.x dictionary file
- •How to select a dictionary for a report
- •Databases Overview
- •For additional information
- •HANDS-ON (Working With Databases)
- •How to open Access queries through DAO
- •How to open Access queries through ODBC
- •How to open Access parameter queries
- •How to set up an ODBC data source
- •How to check settings for an ODBC data source
- •How to log on to an ODBC data source
- •How to add an ODBC database table to a report
- •How to log on to MS SQL Server via ODBC
- •How to log off an ODBC data source
- •How to set up an A to B, A to C link
- •How to edit an SQL query
- •How to use an ACT! database
- •How to open the NT Event Log
- •Introduction
- •Four types of data
- •Direct access database files
- •ODBC data sources
- •Crystal Query Designer files
- •Crystal Dictionary files
- •Multi-pass reporting
- •Product support
- •Web support
- •E-mail support
- •Fax support
- •Telephone support
- •Extended technical support policy
- •Product registration
- •Product return policy
- •Product replacement policy
- •Glossary

HANDS-ON (Absolute Formatting)
How to add color, shading, and borders
Seagate Crystal Reports allows you to add color, borders, and shading to fields on your report to emphasize important data and create professional looking reports.
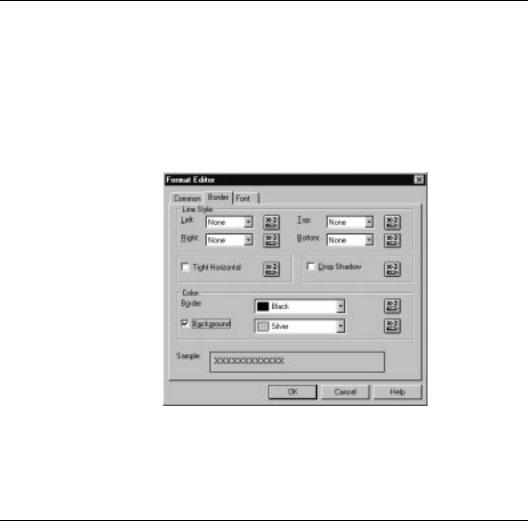
Right-click the field you want to format and choose the CHANGE BORDER command from the shortcut menu that appears.
The Format Editor appears. Click the Border Tab to activate it.
!Select the border type (line style), color, placement, and background color you want and click OK when finished.
The program formats the selected field to your specifications.
How to add/edit lines and boxes
Seagate Crystal Reports allows you to add lines and boxes to your report to emphasize important data and create professional looking reports.
238 |
Seagate Crystal Reports User’s Guide |

Adding lines
Editing lines
Adding boxes
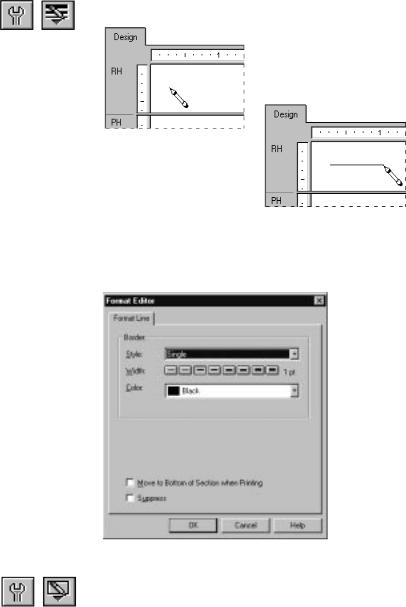
Click the INSERT LINE button on the supplementary toolbar. A pencil-shaped cursor appears.
Using the pencil cursor, draw the line where desired.
Right-click the line you want to format and choose the FORMAT LINE command from the shortcut menu that appears. The Format Editor appears with the Format Line Tab active.
Make the desired changes and click OK when finished to return to your report.
Click the INSERT BOX button on the supplementary toolbar. A pencil-shaped cursor appears.
Formatting |
239 |

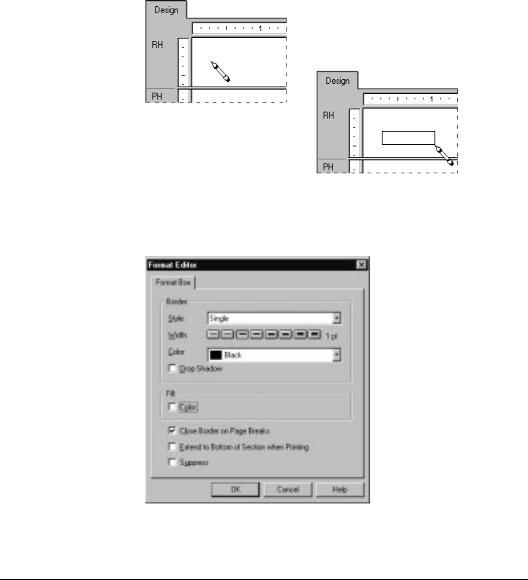
Using the pencil cursor, draw the box where desired.
Editing boxes
Right-click the box you want to format and choose the FORMAT BOX command from the shortcut menu that appears. The Format Editor appears with the Format Box Tab active.
Select the color, width, style, and/or fill color you want and click OK when finished.
The program formats the selected box to your specifications.
How to change margins
Choose the PAGE SETUP command from the File menu. The Page Setup dialog box appears.
240 |
Seagate Crystal Reports User’s Guide |

2 Change the default page margins to fit your needs and click OK when finished.
All margins are calculated from the paper edge. Thus, a left margin of .25 inches causes the printing to start exactly one quarter inch in from the edge of the paper.
How to add/delete white space between rows
Deleting white
space by resizing
The height of a section in relation to the objects in it affects the amount of white space that appears between rows on your report.
The free form Design Tab allows you to add and delete white space two ways:
1.by sizing the area in the Design Tab using the resizing cursor, or
2.by changing options using the Section Expert.
To delete unnecessary white space in a section, simply move the mouse pointer over the bottom section boundary line. The pointer will change to a resizing cursor.
Formatting |
241 |

Deleting white
space using the Section Expert
Adding white
space by resizing
When the resizing cursor appears drag the section boundary up to remove extra white space.
Your report will print like this...
If an entire section is blank (i.e., if you are not putting anything into the Page Footer section of your report), you can eliminate the unnecessary white space by suppressing the section in the Section Expert.
Click the SECTION EXPERT button on the standard toolbar. The Section Expert appears.
Highlight the Page Footer section in the Sections list box.
! Toggle the Suppress (No Drill-Down) option on.
The Page Footer section will no longer print.
NOTE: You can also right-click the shaded area to the left of the section and choose the FIT SECTION command from the shortcut
menu that appears. The program automatically resizes the section so the bottom boundary is even with the baseline of the bottom object in the section. See How to eliminate blank lines, Page 227.
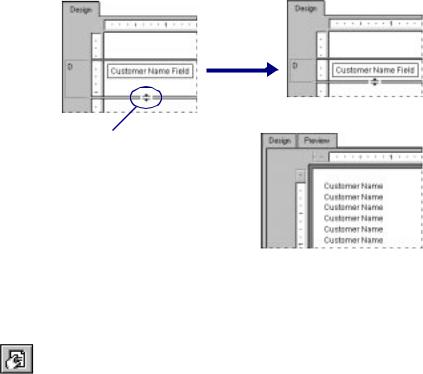
To add extra white space between rows in your report, simply move the mouse pointer over the bottom section boundary line. The pointer will change to a resizing cursor.
242 |
Seagate Crystal Reports User’s Guide |