

Ghai Essential Pediatrics8th
.pdfinclude phosphates, sulfates and proteins (e.g. albumin). Under typical conditions, unmeasured anions exceed unmeasured cations; this is referred to as the anion gap and can be represented by the following formula:
Anion gap = (Na+) - (Cl-+ HC03)
Theanion gap is normally8 to 16 mEq/1. When a strong acidisaddedtoorproducedinthebody,hydrogenionsare neutralized by bicarbonate, resulting in a fall in bicarbo nate. These acids include inorganic (e.g. phosphate or sulfate), organic (e.g. ketoacids or lactate) or exogenous (e.g. salicylate) acids incompletely neutralized by bicar bonate. The accompanying unmeasured anion results in increasedaniongapproportionaltothefallinbicarbonate. Incontrast, when the bicarbonate is lost from the body, no new anion is generated; therefore there is a reciprocal increaseinchlorideions (proportionaltothefallinbicarbo nate) resulting in normal anion gap. Hypoalbuminemia is the most common cause of a low anion gap. Albumin represents about half of the total unmeasured anion pool; foreverydecreaseof1 g/dlofplasmaalbumin, theplasma anion gap decreases by 2.5 mEq/1.
Metabolic Acidosis
Metabolic acidosis is an acid-base disorder characterized by a decrease in serum pH that results from either a loss in plasma bicarbonate concentration or an increase in hydrogen ion concentration (Table 5.12). Primary meta bolic acidosis is characterized by an arterial pH of less than 7.35 due to a decrease in plasma bicarbonate in the absence of an elevated PaC02. If the measured PaC02 is
Table 5.12: Causes of metabolic acidosis
Normal anion gap (hyperchloremic acidosis)
Renal loss ofbicarbonate
Proximal (type 2) renal tubular acidosis, carbonic anhydrase inhibitors (e.g. acetazolamide), tubular damage due to drugs or toxins
Gastrointestinal bicarbonate loss
Diarrhea, ureteral sigmoidostomy, rectourethral fistula, fistula or drainage of small bowel or pancreas
Decreased renal hydrogen ion excretion
Renal tubular acidosis type 1 and type 4 (aldosterone deficiency)
Potassium sparing diuretics
Increased hydrogen chloride production
Parenteral alimentation, increased catabolisrn of lysine and arginine
Ammonium chloride ingestion
Elevated anion gap
Increased acid production/accumulation: Sepsis, shock, poisonings (ethanol, methanol, ethylene glycol); inborn errors of metabolism
Ketoacidosis: Diabetic ketoacidosis, starvation
Exogenous acids: salicylates, iron, isoniazid, paraldehyde Failure ofacid excretion: Acute or chronic renal failure
Fluid and Electrolyte Disturbances -
higher thantheexpectedPaCO2, aconcomitant respiratory acidosis is also present (caused by a depressed mental state, airway obstruction or fatigue). Acutely, medullary chemoreceptors compensate for metabolic acidosis through increase in alveolar ventilation, which results in tachypnea and hyperpnea that washes off CO2 and corrects pH.
Calculation of plasma anion gap helps to classify metabolic acidosis into thosewithelevated aniongap (i.e. >12 mEq/1 as in increased acid production or decreased losses) and those with normal anion gap (i.e. 8-12 mEq/1 as in gastrointestinal or renal loss of bicarbonate or when hydrogen ions cannot be secretedbecause of renal failure) (Table 5.12).
Another useful tool in the evaluation of metabolic acidosis with normal anion gap is urinary anion gap.
Urinary anion gap = urinary [Na+]+ [K+] - [Cl-]
Urinary anion gap is negative in patients with diarrhea regardless of urinarypH, andurinaryaniongapis positive in renal tubular acidosis. An elevated osmolal gap (>20 mOsm/kg) with metabolic acidosis suggests the presence of osmotically active agents such as methanol, ethylene glycol or ethanol.
Clinical Features
Initially, patients with a metabolic acidosis develop a compensatory tachypnea and hyperpnea, which may progress if theacidemiaissevere, and the child can present with significant work of breathing and distress (Kussmaul breathing). An increase in H+ concentration results in pulmonary vasoconstriction, which raises pulmonary artery pressure and pulmonary vascular resistance. Tachycardia is the most common cardiovascular effect seen with mild metabolic acidosis. Cerebral vasodilation occursasa resultofmetabolicacidosisand maycontribute to an increase in intracranial pressure. Acidosis shifts the oxygen-hemoglobin dissociation curve to the right, decreasing hemoglobin's affinity for oxygen. During metabolic acidosis, excess hydrogen ionsmove toward the intracellularcompartment andpotassium moves out of the cell into the extracellular space. Untreated severe metabolicacidosis maybeassociatedwith life-threatening arrhythmias, myocardial depression, respiratory muscle fatigue, seizures, shock and multiorgan failure.
Treatment
It is important to identify the cause of metabolic acidosis as most cases resolve with correction of the underlying disorder. The role of alkali therapy in acute metabolic acidosis is limited. It is definitely indicated in some situations, e.g. salicylate poisoning, inborn errors of metabolism, or in those with pH below or equal to 7.0 or [HC03-J less than 5 mEq/1, as severe acidosiscanproduce myocardial dysfunction. The amount of bicarbonate required is: Body weight (kg) x base deficit x 0.3.
E |
i |
s |
|
_____________ |
|
_s_s_ e_tna_i_P_ed_iat_ri_c |
_____________ |
_ |
|
One ml of 7.5% sodium bicarbonate provides 0.9 mEq bicarbonate. The recommendation is to replace only half of the total bicarbonate deficit during the first few hours of therapy. This amount is given as continuous infusion over two hours. Rapid correction of acidosis with sodium bicarbonate can lead to extracellular volume expansion, exacerbating pulmonary edema in patients with cardiac failure. In the latter, the rate of infusion should be slower or sodium bicarbonate replaced by THAM [dose (ml) = weight (kg) x base deficit] which is infused over 3-6 hr. If hypernatremia is a concern, sodium bicarbonate may be used as part of the maintenance intravenous solution.
During correction ofacute metabolic acidosis, the effect of sodium bicarbonate in lowering serum potassium and ionized calcium concentrations must also be considered and monitored.Since bicarbonate therapy generates large amount of CO2, ventilation should increase proportion ately otherwise this might worsen intracellular acidosis. The inability to compensate may be especially important in patients with diabetic ketoacidosis who are at risk for cerebral edema. In diabetic ketoacidosis, insulin therapy generally corrects the acidosis.
In newborns, frequent administration of hypertonic solutionssuchassodiumbicarbonatehaveledtointracranial hemorrhage resulting from hyperosmolality and resultant fluid shifts from the intracellular space. Children with inheritedmetabolicabnormalities,poisoning,orrenalfailure may require hemodialysis.
Mild to moderateacidosis in renalfailureor renaltubular acidosis improves on oral alkali therapy, the dose being 0.5 to 2 mEq/kg/day of bicarbonate in 3-4 divided doses. In cases ofacidosisduetovolumedepletion,thevolumedeficit should be corrected.
Metabolic Alkalosis
Metabolic alkalosis (pH >7.45) is an acid-base disturbance caused by elevation in the plasma bicarbonate (HC03) concentration in the extracellular fluid that results from a net loss of acid, net gain of base or loss of fluid with more chloride than bicarbonate. There are 2 types of metabolic alkalosisclassified based on the amount of chloride in the urine, i.e. chloride-responsive or chloride resistant (Table 5.13). Chloride-responsive metabolic alkalosis shows urine chloride levels of less than 10 mEq/1 and is characterized by decreased ECF volume and low serum chloride levels, such as occurs with vomiting or use of diuretics.Thistype responds to administration of chloride salt (usuallyasnormalsaline).Chloride resistant metabolic alkalosis is characterized by urine chloride levels of more than 20 mEq/l. Primary aldosteronism is an example of chloride-resistant metabolic alkalosis and this type resists administration of therapy with chloride.
The body compensates for metabolic alkalosis through buffering of excessbicarbonateandhypoventilation. Intra cellular buffering occurs through sodium-hydrogen and potassium-hydrogen ion exchange, with eventual
Table 5.13: Causes of metabolic alkalosis Chloride responsive
Gastric fluid loss (e.g. vomiting, nasogastric drainage) Volume contraction (e.g. loop or thiazide diuretics, metolazone) Congenital chloride diarrhea, villous adenoma
Cystic fibrosis
Post-hypercapnia syndrome (mechanically ventilated patients with chronic lung disease)
Chloride resistant
Primary aldosteronism (adenoma, hyperplasia) Renovascular hypertension, renin secreting tumor Bartter and Gitelman syndromes
Apparent mineralocorticoid excess Glucocorticoid remediable aldosteronism
Congenital adrenal hyperplasia (11 - and 17a-hydroxylase deficiency)
Liddle syndrome
Excess bicarbonate ingestion
formation of CO2 and water from HC03.Within several hours, elevated levels of HC03- and metabolic alkalosis inhibit the respiratorycenter, resulting in hypoventilation and increased pC02 levels. This mechanism produces a rise in pC02 of as much as 0.7 to 1 mm Hg for each 1 mEq/1 increase in HC03.
Clinical Features
Signs and symptoms observed with metabolic alkalosis usuallyrelatetothespecificdiseaseprocessthatcausedthe acid-basedisorder.Increased neuromuscular excitability (e.g. from hypocalcemia), sometimes causes tetany or seizures.Generalizedweaknessmaybenotedifthepatient also has hypokalemia. Patients who develop metabolic alkalosis from vomiting can have symptoms related to severe volume contraction, with signs of dehydration. Although diarrhea typically produces a hyperchloremic metabolic acidosis, diarrheal stools may rarely contain significantamountsofchloride,asinthecaseofcongenital chloride diarrhea. Children with this condition present at birthwithwatery diarrhea,metabolicalkalosis, andhypo volemia. Weight gain and hypertension may accompany metabolic alkalosis that results from a hyper mineralocorticoid state.
Treatment
The overall prognosis in patients with metabolic alkalosis depends on the underlying etiology. Prognosis is good withprompttreatmentand avoidance of hypoxemia. Mild or moderate metabolic alkalosis or alkalemia rarely requires correction.Forsevere metabolicalkalosis, therapy should address the underlying disease state, in addition to moderating the alkalemia. The initial target pH and bicarbonate level in correcting severe alkalemia are approximately 7.55 and 40 mEq/1, respectively.
Therapy with diuretics (e.g. furosemide, thiazides) should be discontinued. Chloride-responsive metabolic alkalosis responds to volume resuscitation and chloride

repletion. Chloride-resistant metabolic alkalosis may be moredifficulttocontrol.Aswithcorrectionofanyelectrolyte oracid-baseimbalance,thegoalistopreventlife-threatening complications with the least amount of correction.
For persistent severe metabolic alkalosis in the setting of fluid overload, whereinsalinecannotbe given, cautious use of HCl or ammonium chloride may be considered. Acetazolamide may help patients with chloride-resistant metabolic alkalosis provided GFR is adequate. Correction of metabolic alkalosis in patients with renal failure may require hemodialysis or continuous renal replacement therapy with a dialysate that contains high levels of chloride and low HC03.
Respiratory Acidosis
Respiratory acidosis occurs when the alveolar ventilation falls or when carbon dioxide production is increased, so that thearterialpartial pressureofcarbon dioxide (PaCO2) is elevated above the normal range (>44 mm Hg) leading to a blood pH lower than 7.35 (Table 5.14). pC02 isdirectly proportional to carbon dioxide production and inversely proportional to alveolar ventilation. The kidneyscompen
sate for respiratory acidosis by increasing HC0 - reabsor
3
ption, a process that begins in 6-12 hr but takes 3-5 days for maximal compensation.
The kidneys increase excretion of hydrogen ions (pre dominantly in the form of ammonium) that increases the plasma bicarbonate concentration by approximately 3.5--4 mEq/1 for every 10 mm Hg increase in CO2.
Clinical Features
Patientswithacuterespiratoryacidosisfrequentlydemon strate air-hunger with retractions and use of accessory muscles. Neurologic findings include anxiety, disorien tation, confusion and lethargy followed by tremors, som nolence or coma at higher pC02_ Hypercapnic neurologic changes are reversible with no residual effect. Cardio vascular findings include tachycardia, bounding arterial pulses and in severe cases hypotension.
Treatment
The goal of therapy is to correct or compensate for the underlying pathologic process.Failureto consider a mixed
Table 5.14: Causes of respiratory acidosis Decrease in alveolar ventilation
Depressed central respiratory drive Acute paralysis of the respiratory muscles
Acute or chronic parenchymal lung and airway diseases Progressive neuromuscular disease
Worsening scoliosis (restrictive lung disease)
High carbon dioxide production and inability to increase minute ventilation
Extensive burn injury Malignant hyperthermia Fever
Fluid and Electrolyte Disturbances -
acidosis can lead to missed therapies and diagnosis. Assisted ventilation is required in many cases.
Respiratory Alkalosis
Respiratory alkalosis occurs in the setting of a primary decrease in pC02 as a consequence of hyperventilation (Table 5.15). In a child this may result from high fever, sepsis, mild bronchial asthma, central nervous system disorders or overventilation of an intubated child in intensive care setting. In acute respiratory alkalosis, titration is done by intracellular buffers. Renal compen sation begins within several hours and takes several days for the maximal response.
Table 5.15: Causes of respiratory alkalosis Hypoxia and hypoxemia
High altitude or low fraction of inspired oxygen, anemia, hypotension or lung disease
Pulmonary disorders
Pulmonary edema, embolism, airway obstruction, pneumonia, intersititial lung disease
Mechanical ventilation (ventilatory rate or tidal volume too high)
Extrapulmonary disorders (severe respiratory alkalosis)
Stress, neurologic disease (stroke, infection, trauma, tumor) Medications: Catecholamines, progesterone, methylxanthines, salicylates, doxapram, nicotine
Hyperthermia,hepaticencephalopathy,sepsis,recovery from metabolic acidosis
Clinical Features
Patients primarily have clinical manifestations of the underlying disorder. Alkalosis, by promoting the binding of calcium to albumin, can reduce the fraction of ionized calciumin blood which maymanifest as feeling of tingling, paresthesias, dizziness, palpitations, tetany and seizures. Therapy is directed towards the causal process.
Suggested Reading
Carmody JB,Norwood VF. A clinical approach to pediatric acid-base disorders. Postgrad Med J 2012;88:143-51
Holliday MA, RayPE, Friedman AL. Fluid therapy for children: facts, fashions and questions. Arch Dis Child 2007;92:546-50
Lietman SA, Germain-Lee EL, Levine MA. Hypercalcemia in chil dren and adolescents. Curr Opin Pediatr 2010;22:508-15
Masilamani K, van der Voort J. The management of acute hyperkale mia in neonates and children. Arch Dis Child 2012;97:376-80
Moritz ML, Ayus JC. Improving intravenous fluid therapy in chil dren with gastroenteritis. Pediatr Nephrol 2010;25:1383-4
Moritz ML, Ayus JC. New aspects in the pathogenesis, prevention, and treatment of hyponatremic encephalopathy in children. Pediatr Nephrol
Rey C, Los-Arcos M, Hernandez A, Sanchez A, et. al Hypotonic ver
sus isotonic maintenance fluids in critically ill children: a multicenter prospective randomized study. Acta Paediatr 2011;100:1138-43
Shaw N. A practical approach to hypocalcemia in children. Endocr Dev
Nutrition
Nutrition, also called nourishment, isthe provision to cells and organisms of the materials necessary in the form of food to support life. Our food is made up of essential, natural substances called nutrients. There are seven major classes of nutrients: carbohydrates, fats, fiber, minerals, proteins, vitamins and water.These nutrients can be grou ped as macronutrients and micronutrients. The macro nutrients areneeded in large quantities, e.g. carbohydrates, fats and proteins and are building blocks of the body. The micronutrients, e.g. minerals and vitamins are needed in tiny quantities and are crucial for their role in metabolic pathways and inenhancingimmunity. Micronutrientsare discussed in Chapter 7.
MACRONUTRIENTS
Carbohydrates
Carbohydrates are the main source of energy in the Indian diet contributing to 55-60% of total energy intake. Carbohydrates contribute taste, texture and bulk to the diet. Lack of carbohydrates (less than 30%) in the diet may produceketosis,loss of weight and breakdown of proteins. Carbohydrates are divided into simple carbohydrates (monosaccharide and disaccharides such as glucose and fructose in fruits, vegetables and honey, sucrose in sugar and lactose in milk) and complex carbohydrates (oligo saccharides and polysaccharides such as starchin cereals, millets, pulses and root vegetables). The main source of energy in the body is glucose derived from starch and sugars present in the diet. Glucose is used as a fuel by the cells and is converted to glycogen by liver and muscles. Excess carbohydrates are converted to fat. Carbohydrates provide 4 kcal of energy per gram.
Fiber
Dietary fibers include polysaccharides such as cellulose, hemicelluloses, pectin, gums, mucilage and lignin. They have little nutritional value as they are not digested by
Vinod K Paul, Rakesh Lodha, Anuja Agarwala
the enzymes in the gut. Fibers are essential for the normal functioning of the gut, elimination of waste, bile acid binding capacityandformaintainingthegrowth ofnormal intestinal microflora.
Proteins
Proteins are the second most abundant substance in the body, after water. They are required for the growth and synthesis of tissues in the body; formation of digestive juices, hormones, plasma proteins, enzymes and hemo globin; as buffers to maintain acid-base equilibrium in the body; and as alternate source of energy for the body. Aminoacidsthatcanbe synthesized in the body are called nonessential, while essential amino acids require to be supplied in the diet.
Essentialamino acids includeleucine, isoleucine,lysine, methionine, phenylalanine, threonine, tryptophan and valine. Histidineandarginineareessentialduring infancy because the rate of their synthesis is inadequate for sustaining growth.
Protein Quality
Food proteinsdiffer in theirnutritionalqualitydepending on their amino acid profile anddigestibility. Cereal grains are deficient in the essential amino acids like lysine, threonine or tryptophan, whereas pulses are richin lysine but are limited in sulfur containing amino acids, mainly methionine. When cereals are taken in combination with the pulses, the deficiency inone is made good by an excess in other. Proteins provide 4 kcal energy per gram.
The following terms are usedtodescribeproteinquality:
True digestibility (TD) |
= |
Nitrogen absorbed |
|
x 100 |
|
|
|
||||
|
|
|
Nitrogen intake |
||
Biological value (BV) |
|
|
Nitrogen retained |
x 100 |
|
|
|
|
|||
|
|
Nitrogen absorbed |
|||
88
----------------------------------------N_u_tr-it_o_n....-
Net protein utilization (NPU) = TD x BV 100
Egg protein has the highest values for BV and NPU and is therefore taken as the reference protein, and the value of others is expressed as relative to egg (taken as 100%). Generally, animal proteins have a higher BV than the plant proteins. The nutritive value of a mixture of two proteins may be higher than the mean of the two because of mutual complementary effects.
Requirements The protein allowances shown in Table 6.1 are given in terms of the mixed vegetable proteins con tained in Indian diets, the NPU of which is assumed to be 65. Nearly 8-12% of the total energy should be provided from protein sources. An intake of 8% proteins may be sufficient for those having a higher content of animal proteins or high value proteins in the diet.
Fats
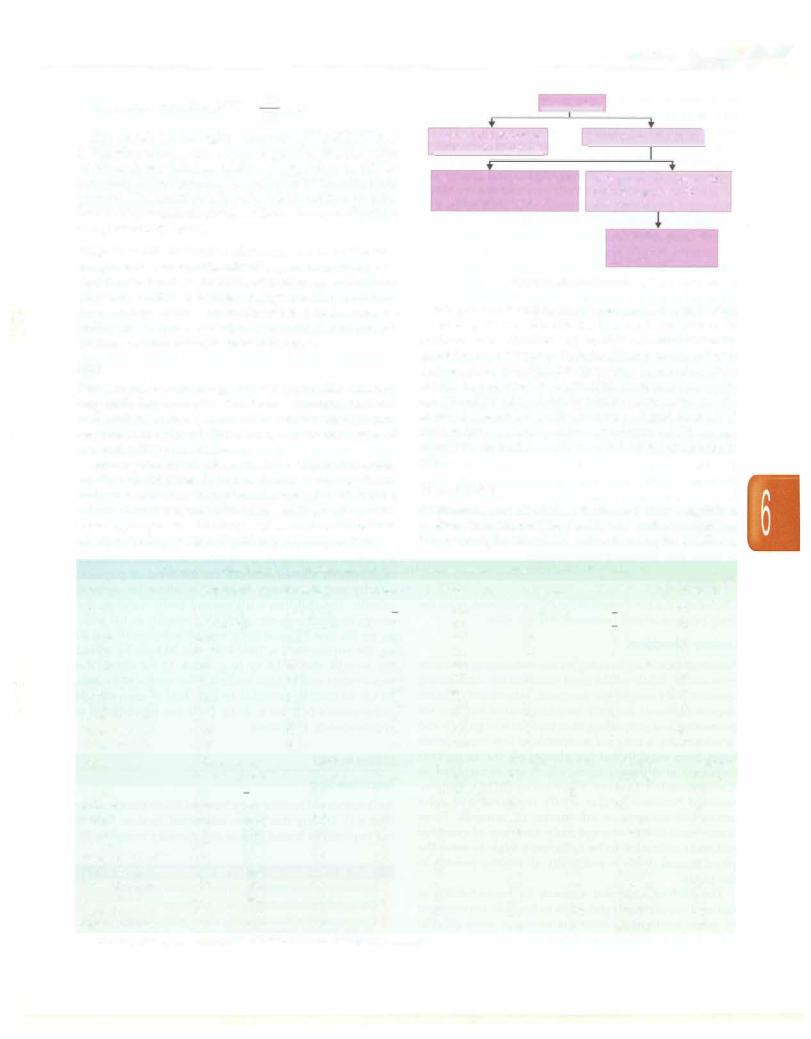
Fats comprise a diverse group of saponifiable esters of long chain fattyacids. Fats function as structural elements of the cell membranes, are a major source of energy, carry fat soluble vitamins (A, D, E and K) and are precursors of prostaglandins and hormones.
Fats are present in the diet or the human body in the form offatty acids (triglycerides), phospholipids andcholesterol. Fatty acids have varying carbon chain length and may be
|
|
Simple lipids |
||
|
|
|
|
|
Saturated fatty acids |
Unsaturated fatty acids I |
|||
Ghee, butter, coconut oil
Monounsaturated fatty acids
Olive oil, palm oil groundnut oil, mustard oil
Polyunsaturated fatty acids
Corn oil, soya bean oil, sunflower oil
Essential fatty acids
Linoleic acid
Linolenic acid
Fig. 6.1: Classification of fats
Fats provide 9 kcal of energy per gram. About 25-30% of energy intake should be from fat. However, in malnourished children, up to 45% of calories can be provided from fat safely. In India, almost 10-15% of fat is derived from invisible fat; therefore, visible fat intake should be restricted to below 20%. Saturated fat should not exceed 7% of the total fat intake; polyunsaturated fat should be restricted to 10% and rest should be derived from monounsaturated fats. A minimum of 3% energy should be derived from linoleic and 0.3% from linolenic acid.
Triglycerides
saturated orunsaturated (Fig. 6.1) depending on the predo minating fatty acids. The degree of saturation determines whether the fat is solid or liquid at room temperature.
Triglycerides are divided on the basis of chain length into medium chain triglycerides (MCT; 6-12 carbon length) or long chain triglycerides (LCT; >12 carbon length). MCTs are
Table 6.1: Daily nutrient requirements and recommended dietary allowances for Indian children
Age
<6mo 6-12mo 1-3 yr 4-6 yr 7-9 yr
Boys, 10-12 yr Girls, 10-12 yr Boys, 13-15 yr Girls, 13-15 yr Boys, 16-17 yr Girls, 16-17 yr
Age
<6mo 6-12mo 1-3 yr 4-6 yr 7-9 yr
Boys, 1012 yr Girls, 10-12 yr Boys, 13-15 yr Girls, 13-15 yr Boys, 16-17 yr Girls, 16-17 yr
Energy,kcal Protein,g
92 kcal/kg |
1.16 g/kg |
80 kcal/kg |
1.69 g/kg |
1060 |
16.7 |
1350 |
20.1 |
1690 |
29.5 |
2190 |
39.9 |
2010 |
40.4 |
2750 |
54.3 |
2330 |
51.9 |
3020 |
61.5 |
2440 |
55.5 |
Vitamin A,µg |
Vitamin |
|
Retinal |
-carotene |
Bl,mg |
350 |
|
0.2 |
350 |
2800 |
0.3 |
400 |
3200 |
0.5 |
400 |
3200 |
0.7 |
600 |
4800 |
0.8 |
600 |
4800 |
1.1 |
600 |
4800 |
1.0 |
600 |
4800 |
1.4 |
600 |
4800 |
1.2 |
600 |
4800 |
1.5 |
600 |
4800 |
1.0 |
Visiblefat,g Calcium,mg
|
500 |
19 |
500 |
27 |
600 |
25 |
600 |
30 |
600 |
35 |
800 |
35 |
800 |
45 |
800 |
40 |
800 |
50 |
800 |
35 |
800 |
Vitamin |
Vitamin |
B2,mg |
B3,mg |
0.3710 µg/kg
0.4650 µg/kg
0.68
0.8 |
11 |
1.0 |
13 |
1.3 |
15 |
1.2 |
13 |
1.616
1.4 |
14 |
1.8 |
17 |
1.2 |
14 |
Iron,mg Zinc,mg Magnesium,mg
46 µg/kg |
|
30 |
|
05 |
|
|
45 |
09 |
|
5 |
50 |
13 |
|
7 |
70 |
16 |
|
8 |
100 |
21 |
|
9 |
120 |
27 |
|
9 |
160 |
32 |
|
11 |
165 |
27 |
|
11 |
210 |
|
|
||
28 |
|
12 |
195 |
26 |
|
12 |
235 |
Vitamin |
Fa/ate |
Vitamin |
Vitamin |
B6,mg |
µg |
B12,µg |
C,mg |
0.1 |
25 |
0.2 |
25 |
0.4 |
25 |
0.2 |
25 |
0.9 |
80 |
0.2-1.0 |
40 |
0.9 |
100 |
0.2-1.0 |
40 |
1.6 |
120 |
0.2-1.0 |
40 |
1.6 |
140 |
0.2-1.0 |
40 |
1.6 |
140 |
0.2-1.0 |
40 |
2.0 |
150 |
0.2-1.0 |
40 |
2.0 |
150 |
0.2-1.0 |
40 |
2.0 |
200 |
0.2-1.0 |
40 |
2.0 |
200 |
0.2-1.0 |
40 |
Based on the 2010 recommendations of Indian Council of Medical Research
- Essential Pediatrics
an immediate source of energy as they are transported directly from the small intestine to liver by portal vein and are burned immediately. Sources of MCT, chiefly comprised of caprylic acid and capric acid, are coconut oil, palm kernel oil and butter (15% MCT). MCTs improve enduranceperformance, promote fat burning, spare mus cle glycogen, increase metabolic rate and lowers blood cholesterol level. Supplementation with MCT is used in the dietary management of cystic fibrosis, pancreatic insufficiency, AIDS, epilepsy, gallstones, high blood cholesterol levels, fat malabsorption and intestinal lymphangiectasia, and are used as energy supplements in athletes. LCT provide essential fatty acids (EFAs) and requires carnitine to produce energy. Prolonged use of MCTs alone leads to EFA deficiency.
Essential Fatty Acids (EFAs)
EFA cannot be synthesized in the body and have to be supplied through dietary fat. Linolenic acid, eicosapen tanoic acid and docosahexanoic acid are omega-3 type of fattyacids. They areimportantcomponentsof gray matter of the brain and improve intellectual performance. It is recommended that omega-3 fatty acid content of the diet should be about 0.5% of the total calories or 1.0-1.5 g/ day. Most omega-6 fatty acids are consumed in the diet in the form of linoleic acid, which gets converted in the body to y-linolenic acid and is further broken down to arachidonic acid. Deficiency of EFAs leads to cessation of growth, alopecia, diarrhea, impaired wound healing, decreasedcalcium absorption, decreasedcalcium deposits in bones and decreased bone strength.
Cholesterol
Cholesterol is a component of thecellmembranes, helpsthe body produce steroid hormones and bile acids.
Dietary Standards
Infants andchildrenhavehigher requirements of nutrients than adults. While adults need nutrients for maintaining constant body weight and functions, infants and children require nutrients not only for maintenance but also for promoting and supporting their rapid rate of growth and development. A range of acceptable or safe intake levels have been established for almost all the important nutrients at different ages, which are recognized as Recommended Dietary Allowances (RDA), Recom mended Nutrient Intakes (RNI), recommended daily amount of nutrients or safe intakes of nutrients. These terms refer to the average daily amounts of essential nutrients estimated to be sufficiently high to meet the physiological needs of practically all healthy persons in the group.
The RDA of a nutrient accounts for the variability in nutrient requirements and refers to the daily requirement of given nutrient to meet the needs of most (97.5%) individuals in a given population, as estimated from the
requirementsof two standard deviations above the mean. Hence, the RDAdeterminesthesatisfactorylevel of intake of a nutrient, since only 2.5% individuals are expected to have requirements above the RDA. However, RDA is not meant tobe used as standard to determine the requirement of a given individual since it exceeds the requirement of most individuals in a given population. The principle of advising intakes by RDA is used for all nutrients except energy.
Energy
Energyrequirementsin ofchildren are computedkeeping in mind the constant andrapid increase in body size, high metabolic rate that regulates body temperature and maintains high level of activities, and marked develop mental changes in organfunction and composition. Energy requirements vary through childhood because of variations in growth rate and physical activity. Although growth rate slows in toddlers, their activity levels are high and appetite and food intake tends to be erratic. In older children, growth is more constant but energy needs vary within and between individuals. During adolescence, energy needs increase due to rapid growth and develop ment. There are 3 critical periods in early life of a young child with regards to energy requirements: around 6 monthswhencomplementaryfeedingisinitiated,between 1 and2 yr whenphysical activity is increased, and between 10 and 12 yr for girls and 15-18 yr for boys when puberty is attained.
In case of energy, advising intakes in excess or below the actual requirements is not safe. Calculation of energy requirement should account for the level of physical activity and the energy required to allow for optimal growth. For children with normal body weights, the energy requirements are calculating roughly as 100 kcal/ kg for the first 10 kg of body weight; between 10 and 20 kg, the requirement is 1000 kcal plus 50 kcal/kg added for weight above 10 kg (e.g. for a 15 kg child, the requirement will be 1250 kcal); andfor weight more than 20 kg, 20 kcal/kg is added to 1500 kcal to estimate the requirements (e.g. for a 30 kg child the requirement is approximately 1700 kcal).
NORMAL DIET
Breastteeding
An infant should be exclusively breastfed till six months of age
(Box 6.1). During this phase, additional food or fluid is not required as breast milk is nutritionally complete for
Box 6.1 : Cardinal principles of breastfeeding practice
•Initiation of breastfeeding within an hour afterbirth
•Exclusive breastfeeding up to 6 mo of age
•Continuation of breastfeeding along with complementary feeding for up to 2 yr of age
----------------------------------------N_u_ tri_tio_n _
the child's growth and development and it protects from infections and strengthens immune system. Breastfeeding issues are discussed in Chapter 8.
Complementary Feeding
After six months of age, breast milk alone is not enough to make an infant grow well. Complementary feeding refers to food which complements breast milk and ensures that the child continues to have enough energy, protein and other nutrients to grow normally. Complementary feeding is started at six months of age, while continuing breastfeeding,
Breastfeeding is encouraged up to two years of age in addition to normal food. Key recommendations for breastfeeding and complementary feeding are given in Table 6.2.
Balanced Diet
Balanced diet is defined as nutritionally adequate and appropriate intake of food items that provide all the nutrients in required amounts and proper proportions. Even at 9 months, infants need small portions of a mix of food groups to be included in their diet to ensure intakes of all macronutrients and micronutrients. A combination of carbohydrate rich food (any cereal, fruit and/or
vegetable), aproteinsource (milk and milkproducts,pulse, egg, meat, fish, nuts) and a fat (visible oil or ghee) and/or sugar or salt should be used to make nutritionally adequate complementary food or feed. A balanced diet should be consumed by children and adolescents to ensure proper growth and development and to stay healthy and disease free. A balanced diet contains 55-60% calories from carbohydrates, 10-12% proteinsand 25-30% fat. Tables 6.3 and 6.4 describe the quality and content of important nutrients of common food items. Table 6.5 lists food exchanges useful in planning diet for children.
Foods are grouped conventionally as: (i) cereals, millets and pulses; (ii) vegetables and fruits; (iii) milk and milk products; (iv) egg, meat, fish; and (v) oils and fats.
Cereals, millets and pulses are the major source of most nutrients in Indian diets. Milk provides good quality protein and calcium and hence, is an essential item of our diet. Eggs, flesh foods and fish enhance the quality of diet but Indians are predominantly a vegetarian society and most of our nutrients are derived from cereals, pulse and milk based diets. Oils and nuts are calorie rich foods and are useful in increasing the caloriedensity. Vegetables and fruits provide protective substances such as vitamins, minerals, fiber and antioxidants.
|
Table 6.2: Counseling for feeding of infants and children |
Age (months) |
Food |
Up to6mo |
Breastfeed as often as the child wants, day and night, at least 8 times in 24 hr |
|
Do not give any other foods or fluids, not even water |
|
Remember: Continue breastfeeding even if the child is sick |
6-12 mo |
Breastfeed as often as the child wants |
|
Complementaryfeedings: Give at least one katori serving at a time of mashed roti/bread/biscuit mixed in |
|
sweetened undiluted milk; or mashed roti, rice, bread mixed in thick dal with added ghee/oil; or khichri |
|
with added oil or ghee |
|
Add cooked vegetables in these servings or use sevian, dalia, halwa, kheer prepared in milk or any cereal |
|
porridge cooked in milk, or mashed boiled or fried potatoes |
|
Offer banana, biscuit, cheeku, mango or papaya as snacks in between the serving |
|
Frequency: 3 times per day if breastfed; 5 times per day if not breastfed |
|
Remember: Keep the child in your lap and feed with your own hands; wash your own and child's hands |
|
with soap and water every time before feeding |
12 mo to 2 yr |
Breastfeed as often as the child wants; offer food from the family pot |
|
Give at least Ph katori serving at a time of mashed roti/rice bread mixed in thick dal or khichri with |
|
added ghee or oil |
|
Add cooked vegetables in the servings, or mashed roti/rice/bread/biscuit mixed in sweetened undiluted |
|
milk, or sevian, dalia, halwa or kheer prepared in milk or any cereal porridge cooked in milk, or mashed |
|
boiled/fried potatoes |
|
Frequency: 5 times a day |
|
Offer banana, biscuit, cheeku, mango or papaya as snacks in between the servings |
|
Remember: Sit by the side of child and help him to finish the serving; wash your child's hands with soap |
|
and water every time before feeding |
2 yr and older |
Give family food as 3 meals each day |
|
Twice daily, also give nutritious snacks between meals, e.g. banana, biscuit, cheeku, mango, or papaya |
|
Remember: Ensure that the child finishes the serving; teach your child to wash his hands with soap and |
|
water every time before feeding |

-Essential Pediatrics
|
Table 6.3: Nutritive value of common food items |
|
|||
Foods |
Quantity |
Household measure |
Calories |
CHO |
Protein |
|
|
(cooked amount) |
kcal |
g |
g |
|
|
|
|
||
Milk and milk products |
|
|
|
|
|
Milk (cow) |
250ml |
1 glass |
166 |
11 |
8 |
Milk buffalo |
250ml |
1glass |
238 |
12.5 |
11 |
Full cream milk |
250ml |
1 glass |
215 |
12 |
8 |
(Mother dairy) |
|
|
|
|
|
Toned milk |
250ml |
1glass |
144 |
11 |
8 |
(Mother dairy) |
|
|
|
|
|
Double toned milk |
250ml |
1glass |
110 |
11 |
8 |
Curd (cow milk) |
125ml |
1katori (medium) |
77 |
4 |
4 |
Paneer (cow milk) |
25g |
1small piece |
64 |
3 |
4 |
Butter milk (cow milk) |
250ml |
1glass |
39 |
1 |
2 |
Skimmed milk (fresh) |
250ml |
1glass |
75 |
12 |
6 |
Skimmed milk (dry) |
25g |
|
93 |
13 |
9.5 |
Cream |
25ml |
|
35 |
1 |
1 |
Processed cheese |
25g |
1small piece |
84 |
1.5 |
6 |
|
|||||
Meat and poultry |
|
|
|
|
|
Meat (muscle) |
100g |
4pieces |
191 |
|
18.5 |
Chicken |
100g |
1portion |
136 |
|
25 |
Fish (rohu) |
100g |
2-3pieces |
106 |
5 |
17 |
|
|||||
Egg (hen) |
50g |
1 |
77 |
0.90 |
6.0 |
Egg white (hen) |
25g |
1Egg white |
13 |
0.18 |
2.73 |
Egg yolk (hen) |
20g |
1Egg yolk |
64 |
0.72 |
3.17 |
Bacon |
25g |
1slice |
188 |
|
2 |
Ham |
25g |
1slice |
29 |
|
5 |
Cereal and pulses |
|
|
|
|
|
Wheat flour |
25g |
1 medium roti |
84 |
17 |
3 |
Rice |
25g (raw) |
3/4katori ( 75g) |
86 |
19 |
2 |
Bread |
25g |
1slice |
61 |
13 |
2 |
Corn flakes |
25g |
112cup |
94 |
21 |
2 |
Wheat dalia |
25g |
112cup |
87 |
18 |
3 |
Green gram |
25g |
1katori |
87 |
15 |
6 |
Lentils |
25g |
1katori |
86 |
15 |
6 |
Rajmah |
25g |
1katori |
87 |
15 |
6 |
Bengal gram |
25g |
1 katori |
89 |
15 |
4 |
Soya beans |
25g |
1katori |
109 |
5 |
11 |
Khichri (rice+ dal 4:1) |
25g |
1katori (cooked) |
89 |
18.2 |
3 |
Vegetables
Fats g
10
16
15 7.5
3.75 5 4 3 0.3 0.3 3 6
13
4
2
5.35
0.04
5.31
20
1
0.4
0.2
0.1
0.2
0.3
0.3
0.2
0.3
1.4 5 1.5
Na
mg
40
47
?
40
60
40
10
175
33
7
101
52
42
10
170
275
5
2
120
251
1
7
10
9
3.2
K mg
350
225
?
165
29
350
25
21
270
50
288
63
41
22
32
85
80
17
20
30
87
211
157
202
33.6
Leafy (spinach, bathua, |
125g |
1katori |
amaranth) |
|
|
Seasonal (cauliflower, bhindi, |
100g |
1katori |
and peas, brinjal) |
|
|
Roots and tubers (potato, arbi |
100g |
1katori |
and zimkand) |
|
|
Fruits |
|
|
Papaya |
100g |
1 slice |
Grapes |
100g |
8-10nos . |
Apricots |
100g |
2nos . |
Lichi |
100g |
4-5nos . |
Pears |
100g |
1medium |
Watermelon |
100g |
1small size |
Musk melon |
100g |
1slice |
42 51 93
32
71
55
61
52
16
17
7.5
10
21
7
16.5
12
13
12 3.3 3.5
1.2 |
0.8 |
100 |
182 |
2.5 |
0.1 |
15 |
96 |
2 |
0.1 |
10 |
345 |
1 |
|
6 |
69 |
0.5 |
0.3 |
|
70 |
1 |
0.3 |
|
430 |
1.5 |
0.3 |
104 |
159 |
0.5 |
0.2 |
6 |
96 |
0.2 |
0.2 |
27 |
160 |
0.3 |
0.2 |
104 |
341 |
Contd.
Foods
Tomato ripe
Apple
Orange
Banana
Guava
Mussambi
Mango
Lemon
Dried fruits and nuts
Raisin (kishmish) Apricot (dried) Dates (fresh) Almonds Cashewnut Walnuts Ground nuts Coconut (fresh) Coconut (dry)
Fats and oils
Oil
Ghee
Butter
Miscellaneous
Sponge cake Ice cream plain Burfi
Rasgulla
Pakora or samosa Puri
Biscuit salt Biscuit sweet
Arrowroot powder Pastry
Sugar cane juice Honey
Sago
Jaggery
Sugar Mushrooms Macaroni Marrnlade Milk chocolate
Horlicks and Viva Protinex
Soya nuggets Custard powder Coffee Ovaltin/Bournvita Cornstarch Dalmoth
Sev
Fried moong dal
|
|
|
|
|
Nutrition |
- |
|
Table 6.3: Nutritive value of common food items (Contd.) |
|
|
|
||||
Quantity |
Household measure |
Calories |
CarbohydrateProtein |
Fats |
Na |
K |
|
|
(cooked amount) |
kcal |
g |
g |
g |
mg |
mg |
100 g |
2 nos |
20 |
3.4 |
1 |
0.2 |
12 |
146 |
100 g |
1 medium |
58 |
13 |
0.2 |
0.5 |
28 |
75 |
100 g |
1 medium |
46 |
10.5 |
0.5 |
0.2 |
5 |
93 |
100 g |
1 medium |
116 |
27 |
1.2 |
0.3 |
37 |
88 |
100 g |
1 medium |
51 |
11 |
1 |
0.3 |
6 |
91 |
100 g |
1 medium |
43 |
9 |
1 |
0.3 |
|
490 |
100 g |
1 small |
72 |
16 |
1 |
0.4 |
26 |
205 |
|
|||||||
100 g |
1 medium |
14 |
3 |
|
0.2 |
|
70 |
25 g |
Ph tsp. |
78 |
19 |
0.5 |
|
8 |
216 |
25 g |
4-6 nos. |
76 |
18 |
0.5 |
0.2 |
8 |
215 |
25 g |
4 nos. |
35 |
8 |
0.5 |
0.1 |
1 |
|
25 g |
8-10 nos. |
163 |
3 |
5 |
14.5 |
1 |
170 |
25 g |
8-10 nos. |
150 |
5.5 |
5 |
12 |
1 |
113 |
25 g |
8-10 nos. |
172 |
3 |
4 |
16 |
1 |
120 |
25 g |
15-20 nos. |
142 |
6.5 |
6.5 |
10 |
|
|
100 g |
|
444 |
13 |
4.5 |
41.6 |
|
|
25 g |
|
165 |
4.6 |
1.7 |
15.5 |
|
|
10 g |
2 teaspoon |
90 |
|
|
10 |
|
|
10 g |
1 teaspoon |
90 |
|
|
10 |
|
|
10 g |
1 teaspoon |
72 |
|
|
8 |
|
|
|
|
|
|
|
|||
|
1 small piece |
114 |
21 |
3 |
2 |
145 |
22 |
100 g |
1 cup |
203 |
21 |
5 |
11 |
63 |
181 |
40 g |
1 piece |
135 |
13 |
5 |
7 |
|
|
35 g |
1 piece |
163 |
32 |
2 |
3 |
30 |
15 |
40 g |
1 piece |
132 |
14 |
1 |
8 |
|
|
40 g |
1 piece |
187 |
19 |
3 |
11 |
|
|
25 g |
8-10 nos. |
132 |
14 |
1 |
8 |
3 |
20 |
25 g |
5-6 nos. |
112 |
18 |
1 |
4 |
|
|
25 g |
5 tablespoons |
84 |
21 |
|
|
1 |
7 |
25 g |
1 small piece |
265 |
35 |
2 |
13 |
|
|
250 ml |
1 glass |
88 |
22 |
|
|
15 |
750 |
25 ml |
5 teaspoons |
80 |
20 |
|
|
6 |
60 |
25 g |
2 tablespoons |
88 |
22 |
|
|
|
|
25 g |
|
96 |
24 |
|
|
|
|
25 g |
5 teaspoons |
100 |
25 |
|
|
|
|
100 g |
|
33 |
1 |
5 |
1 |
4 |
103 |
25 g |
%cup |
88 |
19 |
3 |
|
2 |
221 |
10 g |
1 teaspoon |
28 |
7 |
|
|
7 |
2 |
40 g |
1 slab |
221 |
23 |
3 |
13 |
|
37 |
25 g |
5 teaspoons |
88 |
19 |
3 |
|
|
|
30 g |
|
88 |
5 |
17 |
|
|
|
25 g |
8- 10 nos. |
80 |
7 |
13 |
|
|
80 |
25 g |
5 teaspoons |
25 |
|
|
|
|
100 |
5 g |
1 teaspoon |
|
|
|
|
|
|
5 g |
1 teaspoon |
25 |
3 |
1 |
1 |
|
|
25 g |
5 teaspoons |
100 |
25 |
|
|
|
|
25 g |
|
190 |
12 |
4 |
14 |
150 |
157 |
25 g |
|
105 |
3 |
5 |
105 |
150 |
157 |
25 g |
|
170 |
15 |
5 |
10 |
400 |
157 |
Adaptedfrom the2004recommendationsofthe NationalInstitute of Nutrition (ICMR),Hyderabad onthe NutritiveValueofIndianFoods. Contents of some miscellaneous food items have been standardized at All India Institute of Medical Sciences, New Delhi. K potassium; Na sodium
__E_s_s_e_n_t _ia_i_P_e_d_ i.at_r_ics_ _________________________________
|
Table 6.4: Nutritional characteristics of common food items |
|
Foods |
Main nutrients |
Other characteristics |
Milk and milk products |
Protein, fat, calcium, phosphorus, |
Provide high quality protein lactose and saturated fats; lack |
|
vitamin B2 |
in iron and vitamin C |
Egg (hen) |
Protein, fat, phosphorus, riboflavin |
Provide high quality protein and vitamin B12; lacks in |
|
|
carbohydrates and vitamin C; contains saturated fats |
|
|
and is rich in cholesterol |
Chicken |
Protein, phosphorus |
Provides high quality protein and all B vitamins; does not |
|
|
provide carbohydrate, fat and iron |
Fish |
Protein, fat, calcium, vitamin B12 |
Lacks in carbohydrates; good source of high quality protein and |
|
|
fat containing omega-3 fatty acids |
Cereals grains and |
Carbohydrate, fiber, folic acid, |
Good source of energy; has poor quality protein that lacks in |
products |
vitamins Bl and B2, phytates, iron |
lysine;providesnegligible amountsof unsaturated fat; phytates |
|
|
hinder the absorption of iron |
Pulses, peas, beans |
Carbohydrate, protein, folic acid, |
|
calcium, fiber, vitamins Bl and B2, |
|
iron, phosphorus |
Soya bean |
Protein (35%), fiber, fat (40%), |
|
calcium, iron, zinc, copper, |
|
magnesium, selenium, folic acid, |
|
potassium, all B vitamins, |
|
carotenoids, fiber, isoflavones |
Seasonal vegetables |
Carotenoids, folic acid, calcium, |
|
fiber, vitamin C |
Green leafy vegetables |
Carotenoids, folic acid, calcium |
Good source of energy; contain proteins of lower quality that lack in methionine; provides negligible amount of unsaturated fat; absorption of iron is hindered by phytates
Source of high quality protein (twice of that in pulses) and fat (three times that in pulses); contains polyunsaturated, monounsaturated and saturated fats; vegetarian source of omega-3 fatty acids; deficient in sodium and vitamin C and B12; phytates hinder the absorption of iron and calcium
Good source of carbohydrates in the form of roughage and fiber that provide bulk in diet; deficient in proteins and fat
Good source of soluble fiber; deficient in protein and fat fiber, vitamin C, iron, riboflavin
Root vegetables |
Carbohydrate (chiefly starch) |
Good source of energy; deficient in protein, fat and folic acid; |
|
|
carrots are a rich source of carotene, potatoes provide |
|
|
vitamin C; tapioca is rich in calcium |
Fruits |
Carbohydrate, potassium |
Good source of fiber and roughage; deficient in proteins, fat and |
|
|
folic acid; juicy fruits have high potassium content; banana is a |
|
|
good source of energy but poor source of potassium |
Nuts |
Energy, protein, fat and B vitamins |
Groundnuts are particularly rich in thiamine and nicotinic acid |
Adapted from the 2010 recommendations of the National Institute of Nutrition (ICMR), Hyderabad on the Nutritive Value of Indian Foods
|
|
Table 6.5: |
Food exchanges |
Foods |
Amounts |
Household measure |
Calorie, kcal |
Cow milk |
100 ml |
1/z cup |
67 |
Human milk |
|
|
65 |
Buffalo milk |
|
|
96 |
Full cream milk |
|
|
91 |
Egg |
100 g |
2 nos. |
169 |
Meat |
100 g |
4 pcs. |
191 |
Fish |
100 g |
2-3 pcs |
106 |
Chicken |
100 g |
1 portion |
136 |
Wheat flour |
1 katori raw |
4 chapatis |
336 |
Rice |
1 katori raw |
3 katoris |
345 |
Pulses |
100 g raw |
4 katoris |
345 |
Green leafy veg |
100 g raw |
1/3 katori |
33 |
Seasonal veg |
100 g raw |
1/z katori |
51 |
Root veg |
100 g raw |
1/z cup |
93 |
Fruits |
100 g |
1 portion |
54 |
Banana |
100 g |
1 portion |
116 |
Nuts |
100 g |
Handful |
568 |
Sugar |
100 g |
|
400 |
Fat |
100 g |
|
900 |
Carbohydrate, g
4.4 7.4 5.0 4.8
5
68
76
60
6
10
21
12
27
26
100
Protein, g
3.2
1.1
4.4
4.4
13
18.5
17
25
12
8
24
1
2.5
2
1
1.2
26
Fats, g
4.1
3.4
6.5
6.0
13
13
2
4
1.6
1.0
1.0
0.6
1.0
0.1
0.2
0.3
40
100