

Ghai Essential Pediatrics8th
.pdf
|
|
|
|
|
Normal Growth and its Disorders - |
|
|
Table 2.12: Suggested growth monitoring in children of different ages |
|||||
Age |
Height/length |
Weight |
Head circumference Other |
|||
Birth |
,I' |
|
,I' |
|
,I' |
|
|
|
|
|
|
|
|
Ph, 31h, 6, 9, 15 mo |
,I' |
|
,I' |
|
,I' |
|
|
|
|
|
|
|
|
18 mo-3 yr |
,I' |
(6 monthly) |
,I' |
(6 monthly) |
,1'(6 monthly) |
|
3.5-5.5 yr |
,I' |
(6 monthly) |
,I' |
(6 monthly) |
|
|
6-8 yr |
,I' |
(6 monthly) |
,I' |
(6 monthly) |
BMI (yearly) |
|
9-18 yr |
,I' |
(yearly) |
,I' |
(yearly) |
BMI and SMR (yearly) |
|
Adapted from guidelines given by Indian Academy of Pediatrics (2006)
BMI body mass index, SMR sexual maturity rating
DISORDERS OF GROWTH
Short Stature
Definition and Epidemiology
Short stature is defined as height below third centile or more than 2 standard deviations (SDs) below the median height for age and gender (<-2 SD) according to the population standard. As is evident from the definition, approximately 3% of children in any given populations will be short. Children whose stature is more than 3 SD below the population mean for age and gender (<-3 SD) are more likely tobe suffering from pathological short stature, as compared to those with stature between -2 and -3 SD, who are more likely to be affected by physiological, i.e. familial or constitutional short stature.
Etiology
Shortstaturecanbe attributable tomanycauses(Table2.13). Undernutrition and chronic systemic illness are the common etiological factors, followed by growth hormone deficiency (GHD) and hypothyroidism.
Steps in Assessment
Accurate height measurement. Forchildrenbelow2 yr, supine length should be measured using an infantometer with a rigid headboard on one side and a moveable footboard on the other side, while holding the infant straight on the horizontal board (see Fig. 2.5). For older children, height should be measured with a stadiometer, as explained in previous section (see Fig. 2.6).
Assessment of height velocity. Height velocity is the rate of increase in height over a period of time expressed as cm/year. The average height velocity is 25 cm/yr in the first year, declines to 4-6 cm/yr in prepubertal children between 4 and 9 yr of age and increases during puberty to a peak height velocity of 10-12 cm/yr. If height velocity is lower than expectedforage,thechildislikely to be suffering from a pathological cause of short stature.
Comparison with population norms. The height should be plotted on appropriate growth charts and expressed in centile or as standard deviation score.
Table 2.13: Causes of short stature
Physiological short stature or normal variant
Familial Constitutional
Pathological
Undernutrition Chronic systemic illness
Cerebral palsy
Congenital heart disease, cystic fibrosis, asthma Malabsorption, e.g. celiac disease, chronic liver disease Acquired immunodeficiency syndrome, other chronic infections
Endocrine causes
Growth hormone deficiency, insensitivity Hypothyroidism
Cushing syndrome Pseudohypoparathyroidism Precocious or delayed puberty
Psychosocial dwarfism
Children born small for gestational age
Skeletal dysplasias, e.g. achondroplasia, rickets Genetic syndromes, e.g. Turner, Down syndrome
Comparison with child's own genetic potential. Parents' height significantlyaffectsthe child'sheight.Midparental height (MPH) gives an approximate estimate of the child's genetically determinedpotential.
MPH for boys = |
Mother's+ Father's height (cm) |
+ 6.5 cm |
|
2 |
|
MPH for girls = |
Mother's+ Father's height (cm) |
- 6.5 cm |
|
2 |
|
This value is then plotted on the growth chart at 18-20 yr (adultequivalent)ofage. This gives anestimateof the target height for the child and the percentile that he/she is likely to follow.
Assessment ofbody proportion. Short stature can be propor tionateordisproportionate. Theproportionality isassessed by upper segment (US): lower segment (LS) ratio and comparison of arm spanwith height. US can be measured by taking the sitting height of the child. Childis made to sit on a square stool placed against the vertical rod of the

__E s s e n t ia P e d iat rics _________________________________
_ _ _ _ _ _ _ _ _ _ _ _ _ _ _
stadiometer. The headboard is brought down to the vertex similarly as for taking height. The height of the stool is subtracted from the reading obtained to get sitting height. LS can be obtained by subtracting US from height. Alternatively,LScanbemeasuredbytakingthelength from pubic symphysis to the ground while the child is standing erect. For measuring arm span, child is asked to stand straight with both arms extended outwards parallel to the ground. Length between the tips of the middle finger of the outstretched hands is the arm span.
Normally, US: LS ratio is 1.7 at birth, 1.3 at 3 yr, 1.1 by 6 yr, 1 by 10 yr and 0.9 in adults. Increase in US: LS ratio is seen in rickets, achondroplasia and untreated congenital hypothyroidism. Decrease in US : LS ratio is seen in spondyloepiphyseal dysplasia and vertebral anomalies. Arm span is shorter than length by 2.5 cm at birth, equals height at 11 yr and thereafter is slightly (usually, <1 cm) greater thanheight.
Sexual maturity rating (SMR). SMRstageshouldbeassessed inolderchildren(see Chapter4). Heightspurtisseeninearly pubertyingirlsandmid-pubertyinboys.Preciouspuberty can lead to early height spurt followed by premature epiphyseal fusion andultimate short stature. Onthe other hand,delayedpubertycanalsopresentwithshortstaturein adolescents as the height spurt is also delayed.
Differential Diagnosis
Diagnosis is based on a detailed history, examination and laboratoryevaluation.Careful historyandexaminationcan w1ravel many clues to the etiology of short stature (Tables 2.14 and 2.15). The investigative work up to be done is guided by clues from history and physical examination.
Bone age assessment should be done in all children with shortstature.The appearanceof variousepiphysealcenters and fusion of epiphyses with metaphyses tells about the
Table 2.14: Clues to etiology of short stature from history
History |
Etiology |
Low birthweight |
Small for gestational age |
Polyuria |
Chronic renal failure, renal |
|
tubular acidosis |
Chronic diarrhea, |
Malabsorption |
greasy stools |
|
Neonatal hypoglycemia, |
Hypopituitarism |
jaundice, micropenis |
|
Headache, vomiting, |
Pituitary or hypothalamic space |
visual problem |
occupying lesion, e.g. cranio |
|
pharyngioma |
Lethargy, constipation, |
Hypothyroidism |
weight gain |
|
Inadequate dietary intake |
Undernutrition |
Social history |
Psychosocial dwarfism |
Delayed puberty in |
Constitutional delay of growth |
parent(s) |
and puberty |
Table 2.15: Clues to etiology of short stature from examination
Examinationfinding |
Etiology |
Disproportion |
Skeletal dysplasia, rickets, |
|
hypothyroidism |
Dysmorphism |
Congenital syndromes |
Pallor |
Chronic anemia, chronic renal |
|
failure |
Hypertension |
Chronic renal failure |
Frontal bossing, |
Hypopituitarism |
depressed nasal |
|
bridge, crowded |
|
teeth, small penis |
|
Goiter, coarse skin |
Hypothyroidism |
Central obesity, striae |
Cushing syndrome |
skeletal maturity of the child. Bone age is conventionally readfromradiograph ofthelefthandandwristusingeither Gruelich-Pyle atlas or Tanner-Whitehouse method. It gives an idea as to what proportion of the adult height has been achieved by the child and what is the remaining potential for height gain. Bone age is delayed compared to chronological age in almost all causes of short stature. Exceptions to this are familial short stature, in which bone age equals chronological age, and precocious puberty, in which bone age exceeds chronological age. In case of constitutional delay, undernutrition and systemic illness, bone age isless thanchronological age and corresponds to height age. In cases of growth hormone deficiency and hypothyroidism,bone age may be lower than height age if the endocrine condition is diagnosed late.
In addition, all children with disproportionate short stature require skeletal survey to rule out skeletal dysplasia and rickets. Essential screening investigations that should be done in all children with short stature are listed in Table 2.16. If these investigations are normal andbone age is delayed, level 2 investigations should be done. If these investigations are also normal, then the major diagnostic possibilities are growth hormone deficiency and malabsorption. Ifthe child has borderline short stature, i.e. height between -2 and-3 SD, then it is prudent to wait for 6-12 months and observe for height velocity. On the other hand, if the child is significantly short(<-3 SD) or has documented poor height velocity over 6-12 months, one should proceed to level 3 investigations.
The child is short as per definition (height <3rd centile) but is normal according to his own genetic potentialdeterminedby the parents' height. These children show catch-down growth between birth and 2 yr of age, so that the height and weight come to lie on their target(mid-parental)centilesbytheageof2yr.Subsequently, the growth velocity remains normal throughout childhood and adolescence. The body proportion is appropriate and
----------------------Normal Growth and its Disorders -
Table 2.16: Stepwise investigative work-up for short stature Level 1 (essential) investigations
Complete hemogram with ESR Bone age
Urinalysisincludingmicroscopy, osmolality and pH
Stool examination for parasites, steatorrhea and occult blood Blood urea, creatinine, bicarbonate, pH, calcium, phosphate, alkaline phosphatase, fasting glucose, albumin and trans aminases
Level 2 investigations
Serum thyroxin, thyroid stimulating hormone Karyotype in girls (to rule out Turner syndrome)
Level 3 investigations
Celiac serology (antiendomysial, antitissue transglutaminase antibodies)
Provocative growth hormone testing
Serum insulin-like growth factor-1, and insulin-like growth factor binding protein-3 levels
MRl brain (focussed on pituitary and hypothalamus) for those with low peak growth hormone levels
bone age equals the chronological age. Pubertyis achieved at appropriate age and final height is within their target range (Fig. 2.20).
Constitutional growth delay These children are born with a normal length and weight and grow normally for the first 6-12 months of life. Their growth then shows a deceleration so that the height and weight fall below the 3rdcentile.By3 yr ofage,normalheightvelocityisresumed and they continue to grow just below and parallel to the 3rd centile with a normal height velocity. The onset of puberty and adolescent growth spurt is also delayed in these children butfinal height is within normallimits. Bone age is lowerthan chronological age andcorresponds to the height age.Historyof delayedpubertyanddelayedheight spurt is usually present in one or both parents. (Fig. 2.21).
Table 2.17 lists features that distinguish between these two common causes of short stature.
Undernutrltion Stunted growth caused by chronic undernutrition is one of the commonest cause for short stature in our country. A detailed dietary history and presence of other features of malnutrition such as low mid upperarmcircumferenceandlowweightforheightsuggest the diagnosis.
Endocrine causes These are discussed in detail in Chapter 17.
Skeletal dysplaslas Inborn errors in the formation of cartilage and bone, cause chondrodysplasias or skeletal dysplasias, inherited or sporadic conditions that are usuallyassociatedwith abnormal skeletal proportions and severe short stature (except hypochondroplasia, where growthretardation is mild). A careful elicitationof family
Date Age |
Status Weight |
62 |
1 |
2 |
3 |
|
4 |
5 |
6 |
||
|
|||||||||
|
|||||||||
|
|||||||||
|
|
|
|
|
|
|
|||
61 |
160 |
|
|
|
|
|
|||
605 |
155 |
|
|
|
|
|
|||
9 |
|
|
|
|
|
|
|
||
58 |
145 |
|
|
|
|
|
|||
57 |
|
|
|
|
|
||||
55 140 |
|
|
|
|
|
||||
54 |
|
|
|
|
|
|
|
||
53 135 |
|
|
|
|
|
||||
52 |
130 |
|
|
|
|
|
|||
|
|
51 |
|
|
|
|
|
||
|
|
50 |
|
|
|
|
|
|
|
|
|
49 125 |
|
|
|
|
|
||
|
|
48 |
|
|
|
|
|
|
|
|
|
47 120 |
|
|
|
|
|
||
46 |
115 |
|
|
|
|
|
|||
45 |
|
|
|
|
|
||||
44 |
|
|
|
|
|
|
|
||
43 |
110 |
|
|
|
|
|
|||
|
|
4142 |
105 |
|
|
|
|
|
|
|
|
|
|
|
|
||||
40 |
|
|
|
|
|
|
|
||
39 |
100 |
|
|
|
|
|
|||
38 |
|
95 |
|
|
|
|
|
||
37 |
|
90 |
|
|
|
|
|
||
35 |
|
|
|
|
|
|
|||
33 |
|
85 |
|
|
|
|
|
||
34 |
|
|
|
|
|
|
|
||
32 |
|
|
|
|
|
|
|
||
31 |
|
|
|
|
|
|
|
||
30 |
|
75 |
|
|
|
|
|
||
29 |
|
|
|
|
|
|
|||
28 |
|
|
|
|
|
|
7 |
||
1: |
1: II· |
|
|
||||||
11 |
12 |
13 |
|
7 8-· |
9 10 |
|
w. |
•- - I+ |
,, |
|
.. [Z
9 10 11 12 13
14 |
15 |
16 |
- |
|
|
|
17 |
18 |
|
n |
|||
|
J |
|
l"- |
1 |
76 |
|
|
|
., |
74 |
|||
|
|
|
|
|
|
75 |
|
|
|
|
18! |
|
73 |
|
|
|
|
|
72 |
|
|
|
|
|
181 |
|
71 |
|
|
|
|
|
|
|
|
|
|
|
17! |
|
|
|
|
|
+- |
171 |
|
|
|
|
|
|
16, |
|
|
|
- i:-r |
|
1 |
|
|
|
|
Ta |
ej gl |
15 |
|
|
|
|
· |
·'I |
I) |
|
||
|
|
\lf |
951 |
|
||
|
|
|
ITT |
200 |
||
|
|
|
--,- |
90 |
|
|
|
|
|
r: |
85 |
|
190 |
|
|
|
|
80 |
|
180 |
|
|
|
· |
75 |
|
170 |
|
|
|
|
70 |
|
160 |
|
|
|
' ..... 65 |
|
150 |
|
|
|
|
|
|||
|
|
|
·-+ |
J 60 |
|
140 |
|
|
|
.-· ... 55 |
|
130 |
|
|
|
|
|
50 |
|
120 |
|
|
|
|
45 |
|
110 |
|
|
|
r.T |
40 |
|
100 |
|
|
|
-- |
35 |
|
90 |
|
-+ |
|
|
|
||
|
|
. |
|
80 |
||
|
|
|
30 |
|
||
|
|
|
|
25 |
|
70 |
|
|
|
|
|
60 |
|
|
|
|
|
20 |
|
|
|
|
|
:+ |
15 |
|
50 |
|
|
|
|
|||
|
|
|
|
|
40 |
|
|
|
|
|
:"I |
30 |
|
|
|
|
|
|
|
|
14 |
15 |
16 |
17 |
|
|
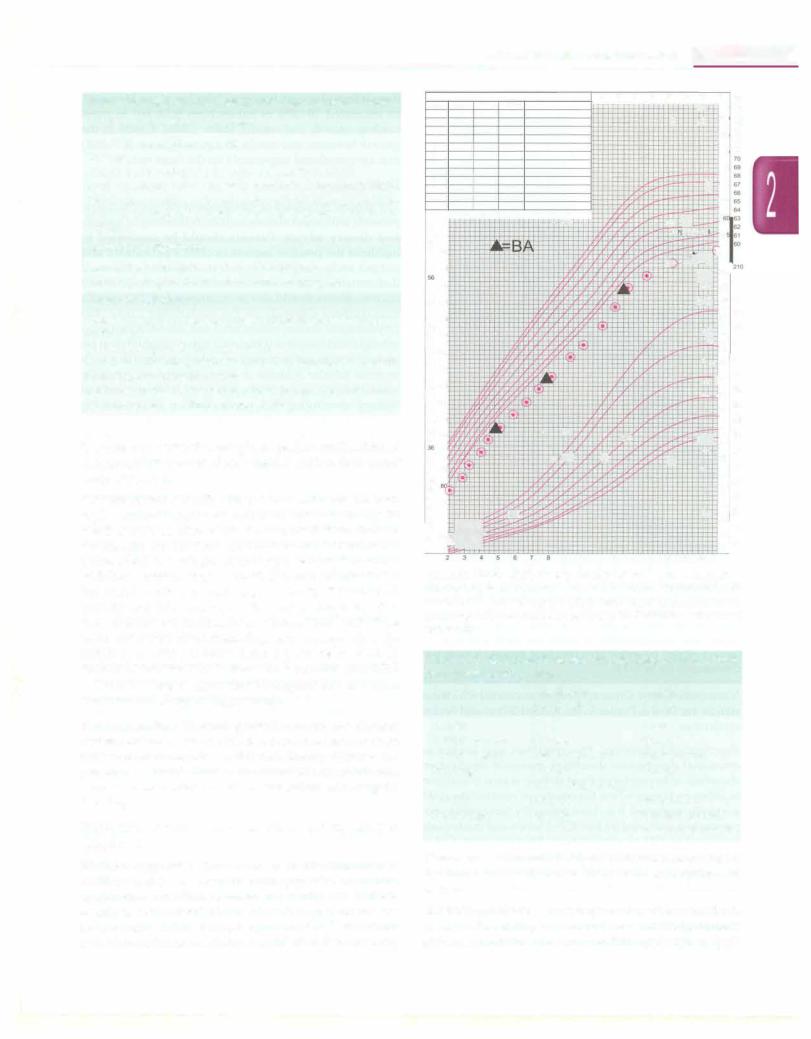
|
Fig. 2.20: Growth chart of a girl with familial short stature. The child is growing below and parallel to 3rd centile from early childhood till adulthood, height velocity is normal, bone age (BA) corresponds to chronological age and target height (range indicated by vertical bold bar) is low
Table 2.17: Distinction between constitutional delay in growth and familial short stature
Feature |
Constitutional |
Familial short |
|
growth delay |
stature |
Height |
Short |
Short |
Height velocity |
Normal |
Normal |
Family history |
Delayed puberty |
Short stature |
Bone age |
Less than |
Normal |
|
chronological age |
|
Puberty |
Delayed |
Normal |
Final height |
Normal |
Low but normal |
|
|
for target height |
history, measurement of bodyproportions,examinationof the limbs and skull and skeletal survey are required for diagnosis.
Geneticsyndromes Turnersyndrome,withan incidence of 1:2000 live births, is a common cause of short stature in girls andshouldberuledouteven if thetypicalphenotypic
__E_s_s_e_n_ _tia_P_e_d_i_atr.ics__________________________________ _
Date Age |
Status Weight |
62 1 |
2 |
3 |
4 |
5 |
6 |
7 |
8 |
|
1 160 |
|
|
|
|
|
|
||
60 |
|
|
|
|
|
|
|
|
59 155 |
|
|
|
|
|
|
||
58 |
|
|
|
|
|
|
||
|
|
|
|
|
|
|
|
|
57 |
145 |
|
|
|
|
|
|
|
56 |
|
|
|
|
|
|
|
|
55 |
140 |
|
|
|
|
|
|
|
54 |
|
|
|
|
|
|
|
|
3 |
135 |
|
|
|
|
|
|
|
52 |
|
|
|
|
|
|
|
|
51 |
130 |
|
|
|
|
|
|
|
so |
|
|
|
|
|
4 V |
|
|
9 125 |
|
|
|
|
|
|
||
48 |
|
|
|
|
|
., |
|
|
7 |
120 |
|
|
|
|
|
|
|
46 |
|
|
,_ |
|
|
/! |
|
,1, |
5 |
115 |
|
|
|
, |
|
|
|
|
|
|
|
|||||
44 |
100 - |
;- |
|
|
||||
409 |
|
|
||||||
43 110 |
i |
|
|
|
|
|
||
42 |
105 |
|
|
|
|
|
|
|
1 |
|
|
|
|
|
|
||
38 |
|
95 |
|
|
|
|
|
|
37 |
|
'N |
,, |
|
|
|
|
|
36 |
|
|
|
|
|
|
|
|
35 |
|
90 |
|
|
|
|
|
|
34 |
|
85 |
|
|
|
|
|
|
33 |
|
|
|
|
|
|
|
|
32 |
|
80 |
|
|
|
|
|
|
31 |
|
|
|
|
|
|
|
|
30 |
|
75 |
|
|
- |
+,;' |
|
|
29 |
|
|
|
|
·- |
|
|
|
|
|
|
|
|
|
|
||
28 |
|
|
|
|
|
|
|
|
40 |
|
|
rl- |
|
|
'I-,, |
|
|
|
|
|
|
|
|
|||
|
|
|
C |
|
|
|
||
30 |
10 |
|
|
|
|
|
|
|
|
|
5 |
|
|
|
|
|
|
|
|
|
3 |
4 |
5 |
6 |
7 |
8 |
11 12 13
. '
,
4
-
9 10 11 12 13
14 15
1-t
ar
v•
t
r-,-
y
'
.L
14 15
16 17 18 H-- 19(
- 18
18(
t i
: - 17( v1 - _ 16,
;, -.!C 16(
15
95
90
85
80 75
'- +- ' 17065
-H 60 11- 55
so
|
|
45 |
|
|
40 |
|
+· rt- |
35 |
|
|
30 |
|
|
25 |
|
|
20 |
|
|
15 |
|
|
10 |
|
|
s |
16 |
17 |
|
767
75
74
723
71 70 9 68 67 68 65 64 63 62
601
21
200
190
18
17
16
1so
14
13
120
11
100
90
80
70
60
so
40
30
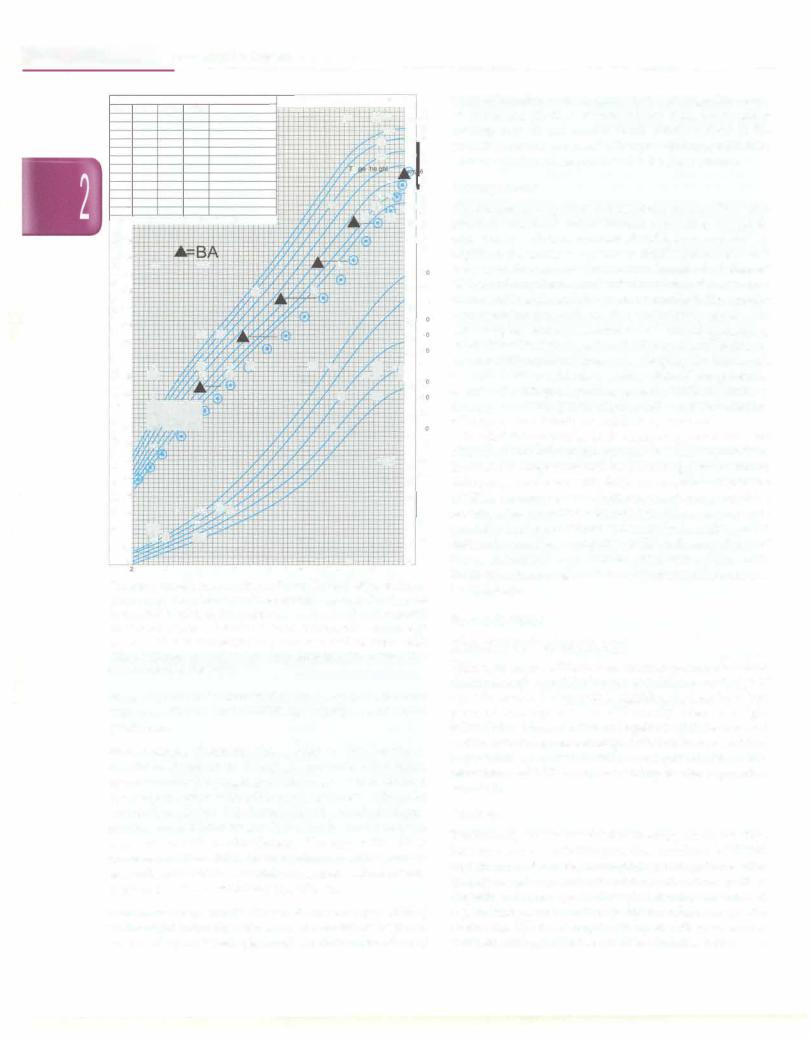
Fig. 2.21: Growth chart of a boy with constitutional delay of growth and puberty. The child falls to a lower centile in early childhood, grows below and parallel to 3rd centile in childhood, with an apparent downward deviation ofgrowthcurve during the normal time of pubertal growth, with later acceleration of growth and reaching target height
(range indicated by vertical bold bar). Bone age (BA) is lower than chronological age by 2-3 yr
features are absent.Othersyndromes associatedwithshort stature are Down, Prader-Willi, Russell-Silver and Seckel syndromes.
Psychosocial dwarfism This condition, also known as emotional deprivation dwarfism, maternal deprivation dwarfism orhyperphagic short stature, is seen in children in unhappy homes where the emotional needs of the child aretotallyneglected.It is characterized by functional hypo pituitarism indicated by low IGF-1 levels and inadequate response of GH to stimulation. Therapy with GH is however, not beneficial. Good catchup growth is usually seen when the child is placed in a less stressful environ ment and nurtured with love and affection.
Children born small for gestational age (SGA)
Birthweight below the 10th centile for gestational age can be caused by maternal, placental or fetal factors. Most of
theseinfantsshow catchupgrowthby 2 yr ofage.However, an estimated 20-30% of babies born SCA fail to show catchup growth and remain short. Subtle defects in the growth hormone and insulin likegrowthfactor (GH-IGF) axis are considered responsible for the short stature.
Management
The general principles of management for any child who presents with short stature include counseling of parents and dietary advice. Parents should be counseled to highlight the positive aspects in child's personality and not put undue emphasis on stature. Intake of a balanced diet containing the recommended amounts of macroand micronutrientsshould also berecommended.The specific management depends on the underlying cause. For physiological causes, reassurance and annual monitoring of height andweight issufficient.Dietary rehabilitationfor undernutrition andtreatment of underlyingconditionsuch as renal tubular acidosis or celiac disease are generally associated with good catchup growth. With any form of therapy, monitoring with regular and accurate recording of height is mandatoryforsatisfactory outcome.
For skeletaldysplasias, limblengtheningproceduresare offered at few orthopedic centers. For hypothyroidism, levothyroxinereplacement is advised. Forgrowthhormone deficiency, treatment with daily subcutaneous injections of GH is recommended. GH therapy is also approved for several other conditions though the doses required are generally higher and improvement in final height smaller and more variable as compared to GH deficiency. Some of these conditions are Turner syndrome, SCA with inadequate catchup growth and chronic renal failure prior to transplant.
Failure to Thrive
Definition and Epidemiology
Failure to thrive (FTT) is a descriptive term rather than diagnosis and is used for infantsandchildren up to 5 yr of age whose physical growth is significantly less than their peers of same age and sex. FIT usually refers to weight below3rdor 5thcentile,failureto gain weight over aperiod of time or a change in rate of growth that has crossed two major centiles, e.g. 75th to 50th, over a period of time. The prevalence of FTT varies according to the population sampled.
Etiology
Traditionally FTT is classified as organic, where the child has some known underlying medical condition, and non organicor psychosocial, wherepoorgrowthis the result of inadequatecaloricprovision andoremotionaldeprivation. Organic and nonorganic etiological factors may coexist, e.g. in children with cerebral palsy or multiple congenital anomalies. FIT is nonorganic in up to 80% of cases. The common etiological factors are listed in Table 2.18.
Table 2.18: Causes of failure to thrive Organic causes
Gastrointestinal: Gastroesophageal reflux, malabsorption, inflammatory bowel disease, pyloric stenosis
Neurological: Mental retardation, cerebral palsy Renal: Renal tubular acidosis, chronic renal failure
Cardiop11/111onary: Congenital heart disease, cystic fibrosis, asthma
Endocrine: Hypothyroidism, diabetes mellitus
Infections: Chronic parasitic infections ofgastrointestinaltract, tuberculosis, human immunodeficiency virus
Genetic: Inborn errors of metabolism, chromosomal anomalies
Miscellaneous: Lead poisoning, malignancy
Nonorganic causes
Poverty
Misperceptions or lack of knowledge about diet and feeding Lack of breastfeeding, feeding diluted formulae Dysfunctional parent child relationship
Clinical Features
These children present with poor growth, often associated with poor development and cognitive functioning. The degree of FTT is usually measured by calculating weight, height and weight-for-height as percentage of the median value for age based on appropriate growth charts (Table 2.19).
Diagnosis
History, physicalexamination and observation of parent child interaction are important. Detailed laboratory investigations are needed only if history and physical examination suggest that an organic cause is responsible for FTT and to localize the systems involved. For initial evaluation the following investigations are adequate:
(i) complete blood count with ESR; (ii) urine and stool microscopy and culture and (iii) renal and liver function test and serum electrolytes. Weight gain in response to adequate calorie feeding establishes the diagnosis of psychosocial FTT.
Management
The goals of management are nutritional rehabilitation, treatment of organic causes if present, and remedial measures for psychosocial factors. Important indications for hospitalization include: (i) severe malnutrition;
Normal Growth and its Disorders -
(ii) diagnostic and laboratory evaluationneededfororganic cause; (iii) lack of catch up growth during outpatient treatment; and (iv) suspected child abuse or neglect. The management of these patients depends on the underlying cause. Nutritional rehabilitation is necessary.
Prognosis
If managed earlyandadequately, the prognosis for physical growthrecoveryisgood.However,the outlook forcognitive, emotional and behavioral development is variable and less certain. The growth and development of these children should be monitored regularly.
ABNORMALITIES OF HEAD SIZE AND SHAPE
Head growth may be affected by abnormal growth of the skull bones or alterations in brain parenchyma, cerebro spinal fluid or bone.
Macrocephaly
Macrocephalyisdefinedasanoccipitofrontalcircumference greater than two standard deviations (SD) above the mean for age and sex. Table 2.20 lists important causes of macro cephaly. Megalencephaly or enlargement of the brain parenchyma may be familial or associated with inherited syndromesor neurometabolicdisease. Infantswith benign familial megalencephaly have increased head size at birth thatpersiststhroughinfancyalongtheupper growth curve percentiles, and is associated with normal body size, neurologic examination and development. Children with metabolic causes have normal head circumference atbirth; macrocephaly is noted as the child gets older. Diagnosis is suggested by accompanying features and biochemical abnormalities. Hydrocephalus, characterized by an excessive amount of CSF, may be caused by increased production,decreasedabsorptionorobstructiontoCSFflow. Mostpatientsshowpostnatalrapidincreaseinheadsizeand are symptomatic due to underlying disease or raised intracranial pressure (nausea, vomiting and irritability). Benignenlargementof the subarachnoidspaceisrelatively common and ischaracterizedby head growth velocitythat slowstonormalby6monthsofage;developmentassessment and neurological examination are normal.
Evaluation for macrocephaly is indicated if the head circumferenceis above 3 SD of the mean for age and sex, or when serial measurementsreveal progressive enlargement, as suggested by an increase by >2 cm per month during first 6 months of life or the crossing of one or more major
|
Table 2.19: Degree of failure to thrive |
|
|
Degree of failure to thrive |
Weight-for-age (% of median) |
Length/height-for-age |
Weight-for-height |
|
|
(% of median) |
(% of median) |
Mild |
75-90 |
90-95 |
81-90 |
Moderate |
60-74 |
85-89 |
70-80 |
Severe |
<60 |
<85 |
<70 |

__E_ss_en_ tia1Ped_ ia tr.ics·----------------------------- |
------ |
|
Table 2.20: Causes of macrocephaly Megalencephaly
Benign familial
Neurocutaneous syndromes: Neurofibromatosis, tuberous sclerosis, Sturge-Weber, Klippel-Trenaunay-Weber, linear sebaceous nevus
Others: Sotos, Fragile X syndrome
Leukodystrophies: Alexander, Canavan, megalencephalic leukoencephalopathy
Lysosomal storage diseases: Tay-Sachs, mucopolysaccharidosis, gangliosidosis
Increased cerebrospinal fluid
Hydrocephalus
Benign enlargement of subarachnoid space Hydranencephaly, choroid plexus papilloma
Enlarged vascular compartment
Arteriovenous malformation
Subdural, epidural, subarachnoid or intraventricular hemorrhage
Increase in bony compartment
Bone disease: Achondroplasia, osteogenesis imperfecta, osteopetrosis, hyperphosphatasia, cleidocranial dysostosis
Bone marrow expansion: Thalassemia major
Miscellaneous causes
Intracranial mass lesions: Cyst, abscess or tumor
Raised intracranial pressure: Idiopathic pseudotumor cerebri, lead poisoning, hypervitarninosis A, galactosemia
percentilelines betweenroutinevisits. Measurement ofhead size in parents is useful in diagnosing familial cases. Majority of patients require cranial imaging, ultra sonography or computed tomography(CT) scan.
Children with asymptomatic familial megalencephaly or benign enlargement of the subarachnoid space do not requiretreatment. Infants with hydrocephalusmay require neurosurgical intervention (e.g. placement of a ventriculo peritoneal shunt).
Microcephaly
Microcephaly is defined as an occipitofrontal circum ference more than 3 standard deviations (SD) below the mean for given age, sex and gestation. Defining micro cephaly as >3 SD below the mean is more likely to be associatedwithgenetic andnon-genetic disorders affecting brain than if defined as >2 SD below the mean, since the latter may include intellectually normal healthy children with head circumference at the lower end of the population distribution. The term primary microcephaly is used to describe conditions associated with reduced generation of neurons during neural development and migration. Secondary microcephaly follows injury or insult to a previously normal brain causing reduction in the number of dendritic processes and synaptic connections. Micro encephaly (micrencephaly) is the term used for an
abnormally small brain, based on findings on neuro imaging or neuropathology. Since head growth is driven by brain growth, microcephaly usually implies micro encephaly (except in craniosynostosis in which skull growth is restricted).
Importantcausesofmicrocephalyarelistedin Table 2.21. Isolated inherited microcephaly, most commonly as an autosomalrecessive phenotype,isassociatedwithreduced OFC since birth, normal cerebral anatomy and absence of neurologic signswith orwithoutlearningdifficulties. Other associations include structural brain malformations, inherited syndromes, congenital or acquired infections, hypoxicischemicinsultsandrarely,metabolicdisorders.
Evaluationformicrocephaly should be initiatedifa single headcircumferencemeasurementismore than2-3 SD below the mean or when serial measurements reveal progressive decrease in head size. Careful history and physical examination are necessary, including development assessment and measurement ofhead size ofparents. Need forneuroimaging is determined bythe age at onset, severity of rnicrocephaly, head circumference in parents, history of antenatal insult(s) and associated clinical features. An abnormalheadshapeand ridges along the suture lines are
Table 2.21: Causes of microcephaly Isolated microcephaly
Autosomal recessive, autosomal dominant or X-linked
Syndromic
Trisomies 21, 18, 13 Monosomy lp36 deletion
Syndromes: William, Cri-du-chat, Seckel, Smith Lemli Opitz, Cornelia de Lange, Rubinstein Taybi, Cockayne, Angelman
Structural diseases
Neural tube defects (anencephaly, hydranencephaly, encephalocele, holoprosencephaly)
Lissencephaly, schizencephaly, polymicrogyria, pachygyria (macrogyria)
Metabolic disorders
Phenylketonuria, methylmalonic aciduria, citrullinemia Neuronal ceroid lipofuscinosis
Maternal: diabetes mellitus, untreated phenylketonuria
Infections
Congenital: Cytomegalovirus, herpes simplex virus, rubella, varicella, toxoplasmosis, HIV, syphilis, enterovirus Meningitis
Teratogens
Alcohol, tobacco, marijuana, cocaine, heroin, toluene Antineoplastic agents, antiepileptic agents Radiation
Perinatal insult
Hypoxic ischemic encephalopathy, hypoglycemia
Endocrine
Hypothyroidism, hypopituitarism, adrenal insufficiency
Metopic suture -- |
- |
|
|
|
-- |
'A ::::'.:: ;:::::- , |
_ |
Frontal bone ---,. , |
____ |
||
___ |
|
||
Anterior fontanel ---t--t---
Parietal bone
Posterior fontanel
Normal Growth and its Disorders -
--------------QJ
B
-------
GW,@ E \ D
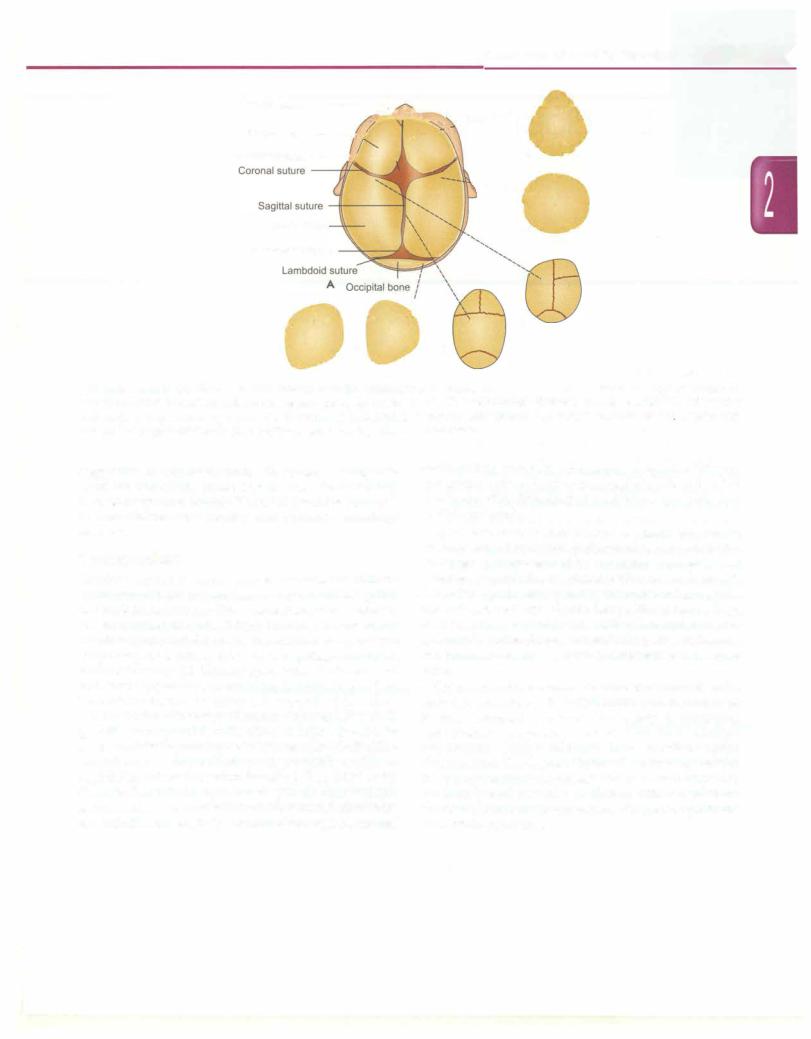
Figs 2.22A and B: (A) Head of normal neonate showing fontanelles and sutures. The common forms of craniosynostosis (secondary to premature fusion of sutures) include; (B) trigonocephaly (metopic suture); (C) brachycephaly (bilateral coronal sutures); (D) left anterior plagiocephaly (left coronal suture); (E) scaphocephaly (sagittal suture); (F) right posterior plagiocephaly (right lambdoid suture) Children with deformation plagiocephaly; (G) have positional skull flattening without sutural fusion
suggestive of craniosynostosis. The prognosis depends upon the underlying cause, and is worse for secondary than primary microcephaly. The child should be managed in consultation with genetics and pediatric neurology services.
Craniosynostosis
Craniosynostosis is the premature fusion of one or more cranial sutures, either major (e.g. metopic, coronal, sagittal, and lambdoid) or minor (frontonasal, temporosquamosal, andfrontosphenoidal) (Fig.2.22A).Cranial sutures normally fuse during earlychildhood, starting with themetopicsuture (beginning at 2 months), followed by sagittal, coronal and lambdoid sutures (22-26 months), such that the frontonasal and frontozygomatic sutures close last (68-72 months). Premature fusion restricts the growth of the skull perpendicular to the affected suture. Compensatory skull growth occurs parallel to the affected suture in order to accommodate the growing brain. The resulting skull defor mity is termed as scaphocephaly, plagiocephaly or trigono cephaly based on the suture involved (Fig. 2.22B to F). Cloverleaf skull deformityiscausedby the fusionofmultiple sutures and is associated with hydrocephalus. Patients with tower skull or acrocephaly have combined sagittal, coronal
and lambdoid synostosis, often as part of Apert or Crouzon syndrome. Oxycephaly or turricephaly refers to a tall cranium resulting from delayed repairofbrachycephaly, and is often syndromic.
Apert syndrome is an autosomal dominant or sporadic disorder caused by defects in the fibroblast growth factor (FGF) gene, characterized by bicoronal synostosis and maxillary hypoplasia, associated with recessed forehead, flat midface, protruding eyes, hypertelorism, antimongoloid slant of eyes and low-set ears. Most patients have a high arched palate, malocclusion, cleft palate and complex syndactyly (mitten hand). Other findings are strabismus, conductive hearing loss, airway compromise and severe acne.
Crouzon syndrome is an autosomal dominant disorder caused by mutations in FGFR2 or FGFR3, and characterized by tall, flattened forehead (secondary to bicoronal synostosis), proptosis, beaked nose and midface hypoplasia. Many patients have cervical spine abnormalities. The degree of facial deformityis milder than in Apert syndrome and patients do not show cleft palate, syndactyly and mental retardation. Other conditions associated with craniosynostosis are Carpenter syndrome and Pfeiffer syndrome.
Development
NORMAL DEVELOPMENT
Development refers to maturation of functions and acquisition of various skills for optimal functioning of an individual. The maturation and myelination of the nervous system is reflected in the sequential attainment of developmental milestones. Developmental milestones are important, easily identifiable events during the conti nuous process of development, e.g. turning over, sitting, reaching for objects, and pointing to objects. Increasingly complex skills are learnt, matching the formation of new synapses in the brain.
While development is a global process reflected in new motor abilities and language, social and cognitive skills, intelligencepertainstothepart of the development dealing with cognitive or adaptive behavior. Intelligence is the ability to apply knowledge to manipulate one's environ ment or to think abstractly and refers to the aggregate or global capacityof the individual to act purposefully, think rationally and to deal effectively with the environment. Different researchers define intelligence variably; an objective measurement is done using multiple criteria in tests of intelligence quotient (IQ).
Rules of Development
Tounderstandthecomplexprocessofhumandevelopment, some basic facts should be understood:
1.Development is a continuous process, starting in utero and progressing in an orderly manner until maturity. The child has to go through many developmental stages
before a milestone is achieved.
ii.Development depends on thefunctional maturation ofthe nervous system. Maturity of the central nervous system is essential for a child to learn a particular milestone or skill; no amount of practice can make a child learn new skills in its absence. However, in absence of practice,the child may be unable to learn skills despite neural maturation, since the capability to perform the skills remains dormant.
Ramesh Agarwal, Vandana Jain, Naveen Sankhyan
iii.The sequence ofattainment ofmilestones is the same in all children. For example, all infants babble before they speak in words and sit before they stand. Variations may exist in the time and manner of their attainment.
iv.The process of development progresses in a cephalocaudal direction. Hence, head control precedes trunk control, which precedes ability to use lower limbs. The control of limbs proceeds in a proximal to distal manner, such that hand use is learnt before control over fingers.
v.Certain primitive reflexes have to be lost before relevant milestones are attained. For example, palmar grasp is lost before voluntary grasp is attained and the asymmetric tonic neck reflexhasto disappear to allow the child to turnover.
vi.The initial disorganized mass activity is gradually replaced by specific and wilful actions. Hence, when shown a bright toy, a 3-4 month old squeals loudly and excitedly moves all limbs, whereas a 3-4 yr old may just smile and ask for it.
Factors Affecting Development
Development depends on avariety ofmutuallyinteractive factors such as hereditary potential, biological integrity, physical and psychosocial environment and emotional stimulation. The brain matures through a dynamic interplay of genetic, biological and psychosocial factors. Infancy and early childhood are the most crucial phases during which development takes place.
Appropriate sensory inputs through hearing and vision, a secure environment and responsive parenting providethe basesfor healthy patterns oflearning,behavior and health. Poverty is among the most important risk factors associated with poor development. Poverty expo ses the child to many other risk factors such as lack of stimulation or excessive stress, malnutrition, exposure to environmentaltoxins,and concurrentdiseasesthatadver sely affect development. Such early influences have
42

negative effect on hypothalamic-pituitary-adrenocortical system and change electrical activity of the brain related to efficiency of cognitive processing. The factors that influence child development are listed below.
Prenatal Factors
Genetic factors Intelligence of parents has direct correlation on the final IQ of the child. Moreover, certain developmental patterns are observed to follow parental patterns like speech. There are numerous genetic causes for developmental delay and subsequent mental retar dation (MR). Prominent genetic factors include chromoso mal abnormalities (e.g. Down syndrome), X-linked MR (fragile X and other mutations), subtelomeric deletions, single gene disorders causing disorders ofbrain formation (lissencephaly) and other metabolic disorders (phenyl ketonuria).
Maternal factors A host of factors which impair growth in utero also can potentially affect brain growth, particularly if they are severe and/or sustained:
1.Maternal nutrition. There is suggestion that maternal malnutrition (of macronutrient as well as micro nutrients) has adverse effect on birth weight and child development. Studies from developing countries suggestthatnutrition supplements including multiple micronutrient supplements have positive impact on birth weight as well as child development. It has been shown that the overall quality of maternal care can produce lasting changes in stress reactivity, anxiety and memory in the child.
ii.Exposure to drugs and toxins. Various drugs and toxins such as maternal drug or alcohol abuse, antiepileptic drugs and environmental toxins can have adverse effect on child development.
iii.Maternal diseases and infections. Pregnancy induced hypertension, hypothyroidism, malnutrition andfeto placental insufficiency due to any cause. Acquired infections (e.g. syphilis, toxoplasmosis, AIDS, rubella, CMV, herpes) can have a severe impact on fetal physical and brain growth. Exposure to free radicals and oxidants in utero (e.g. chorioamnionitis) has been incriminated in the causation of cerebral palsy and developmental impairment.
Neonatal Risk Factors
Intrauterine growth restriction Intrauterine growth restriction (IUGR) indicates constraints in fetal nutrition during a crucial period for brain development. In developing countries, intrauterine growth restriction is mainly due to poor maternal nutrition and infections. Studies have shown that IUGR infants are disadvantaged compared to their normal birth weight counterparts in terms of short-term as well as longterm neurocognitive development.
o_e_v_e_io_p_m_e_n_t__
Prematurity Babies born before 37 weeks of gestation are more likely to have developmental impairment compared to term counterparts with babies born before 32 weeks gestation being at the highest risk. Premature babies are at risk due to complications, including intracranial bleed, white matter injury, hypoxia, hyperbilirubinemia and hypoglycemia.
Perinatal asphyxia Significant asphyxia occurs in approximately 2% of total births. Studies have indicated that over 40% of survivors of significant asphyxia suffer from major neurocognitive disabilities.
Postneonatal Factors
Infant and child nutrition Severe calorie deficiency, as evident by stunting, is associated with apathy, depressed affect, decreased play and activities and insecure attach ment. Calorie deficiency is oftenassociatedwith deficiency of multiple micronutrients and vitamins (including zinc, vitamins A, B12, D, E, riboflavin and iodine) that contribute to developmental impairment.
Linear growth retardation or stunting occurs in nearly one-third of children aged less than 5 yr in low-income andmiddle-incomecountries.Thereispositiveassociation between early height-for-age and cognitive or language ability, rates of school enrolment and grades attained by late adolescence and formal employment at age 20-22 yr.
Early growth faltering (<24 months) seems to be more detrimental to childhood development. Increase in weight to cause a change by one standard deviation from birth to 24 months was associatedwithincreasedratesof schooling and inversely related to grade failures. Macronutrient supplementation to promote better growth consistently shows concurrent developmental benefits.
Iron deficiency Iron deficiency has been shown to be associated with electrophysiological evidence of delayed brain maturation, poorer cognitive, motor and social emotional development in infancy and early childhood.
Iodine deficiency Iodine is a constituent of thyroid hormones, which affect central nervous system develop ment and regulate many physiological processes. Iodine deficiency can lead to congenital hypothyroidism and irreversible mental retardation, making it the most common preventable cause of mental retardation. Child ren growing in iodine deficient areas have an IQ 12.5 points lower than those growing in iodine sufficient areas.
Infectious diseases A variety of infectious morbidities such as diarrhea, malaria, other parasitic infections and HIV are associated with poorer neurodevelopment.
Environmental toxins Children exposed to environ mental toxins (lead, arsenic, pesticides, mercuryandpoly cyclicaromatichydrocarbons)prenatallythroughmaternal exposure andpostnatally through breast milk, food, water,
n |
P_ed_ia_rits_c |
________ |
______ _ |
|
_ E_s_s_ e__t_ia i |
___________________ |
|
|
|
|
|
|
||
house dust, or soil can have adverse influence on their neurocognitive development.
Acquired insults to brain Traumatic orinfectious insults (meningitis, encephalitis, cerebral malaria) and other factors (neardrowning, trauma), particularly during early years of life, can have a permanent adverse effect on brain development.
Associated impairments Impairments particularlythose involving sensory inputs from the eyes or ears can have a significant impact on attainment of milestones. These impairments have to be actively sought in any child with delay as they offer opportunity for intervention.
Psychosocial Factors
During the critical period of development and learning, several social factors have an important bearing on not only cognition but also attitudes, social-emotional competence and sensorimotor development.
Parenting Cognitive stimulation, caregiver's sensitivity and affection (emotional warmth or rejection of child) and responsiveness to the child in the setting of other factors such as poverty, cultural values and practices have an important bearing on child development. Apart from these, parental attitudes, involvement, education and desire for the child also have an impact on the develop ment of the child.
Higher levels of maternal warmth and responsiveness are associated with higher cognitive ability and reduced levels of behavioral problems in young children.
Poverty Thisis possibly the most common underlyingfactor for impaired child development worldwide. It acts throughout the lifetime of the individual and also affects the next generation.
A variety of risk factors such as biological, environ mental, nutritional and psychosocial that are associated with poverty lead to cumulative adverse effect on early child development, which prevent child attaining their full potential and adult productivity and thereby perpetuates the poverty cycle.
Lackofstimulation Socialandemotionaldeprivationand lack of adequate interaction and stimulation is an impor tant cause of developmental impairment, particularly evident in the setting of poverty.
Violence and abuse Domestic andcommunityviolence are emerging threats to child development. Child abuse, physical and sexual, can have a profound psychological effect on the child. Problems of attention and cognition are more common in children exposed to violence or abuse. Apart from the direct effect, there are indirect consequencesdue to change in family dynamics and effect on the caregiver. Early life experiences have been shown to have a bearing on behavioral patterns later in life.
Maternal depression Low to middle income countries have a high incidence of maternal depressive symptoms, which is negatively associated with early child development and quality of parenting by virtue of
unresponsive caregiving.
Institutionalization Institutional care (e.g. orphanages) during early life increases the risk of poor growth, ill health, attachment disorders, attention disorders, poor cognitive function, anxiety, and autistic-like behavior.
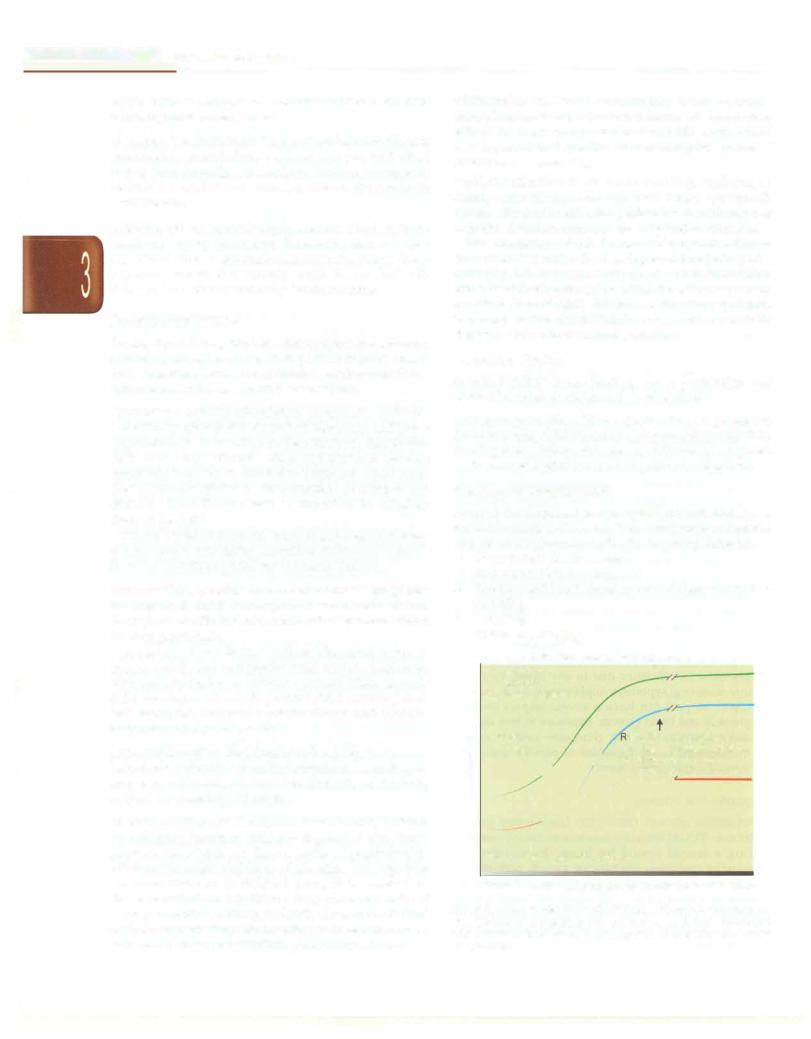
The interaction of risk factors and protective factors interact to determine the developmental trajectory of a child (Fig. 3.1). In presence of protective factors, children attain theirdevelopmental potential. Presence of a variety of risk factors in early life lowers the developmental trajectory of the child. Timely intervention can help children achieve near normal potential.
Protective Factors
Breastfeeding Breastfeeding has a protective and promotive effect on childhood development.
Maternal education Maternal education is a protective factor reducing child mortality and promoting early child development. Infant and young children of educated mothers have higher levels of cognitive development.
Domans of Development i
Normal development is a complex process and has a multitude offacets. However, itisconvenienttounderstand and assess development under the following domains:
i.Gross motor development
ii.Fine motor skill development
iii.Personal and social development and general under standing
iv.Language
v.Vision and hearing
Behavioral competence trajectories
-Optimum
-Recovery
-Below potential
c |
Protective > risk |
J |
eduction in risk factors, |
0 |
I |
increase in protective factors, |
|
g |
factors |
|
|
|
|
or intervention during a |
|
C |
|
|
|
|
+ |
|
Mod |
- |
|
|
|
co |
|
||
t
Risk factors > protective factors
Prenatal Birth Early childhood Adolescence Adulthood
Fig. 3.1: Differing trajectories of brain and behavioral development
as a function of exposure to risk and protective factors. Reproduced
with permission from Walker, et al. Inequalities in early childhood Lancet 2011;378:1325-38