

Fiber_Optics_Physics_Technology
.pdf4.7. Microstructured Fibers |
73 |
Wavelength (nm)
1,500 |
1,200 |
1,000 |
100 |
|
|
50 |
PCF with two zeroes |
|
|
|
|
/km) |
259 |
308 |
|
|
|
2 |
|
|
(ps |
|
|
2 |
|
|
β |
|
|
0 |
|
|
standard |
|
|
fiber |
234 |
304 |
|
|
|
|
PCF with single zero |
|
–50 |
|
|
200 |
250 |
300 |
Frequency (THz)
Figure 4.26: Comparison of dispersion of a standard single-mode fiber (compare Fig. 4.4) with that of two di erent types of holey fibers (both obtained from a commercial vendor). Note that in this figure a linear frequency scale is used, and that dispersion is given as β2. The fiber with a single zero-dispersion wavelength has a 3-μm core diameter, the one with two zero-dispersion points, 2.3 μm. In either case, the zeroes are shifted toward higher frequencies with respect to the standard fiber. The measured zero-dispersion frequencies are indicated in terahertz (arrows); manufacturer’s specifications provide only approximate values.
shown in Fig. 4.16 but at a wavelength considerably shorter than the material’s zero-dispersion wavelength (see Fig. 4.26). Applications have been found for these specialty fibers, but this topic is beyond our present scope.
4.7.2Photonic Crystal Fibers
This type of microstructured fiber is also known as photonic-bandgap photonic crystal fiber. Its most remarkable feature is that the core is also a hollow channel, giving rise to the alternative name of hollow-core photonic crystal fiber. A hollow (i.e., air-filled) core implies that the light-guiding property certainly cannot rely on the index step between core and cladding – this step goes the wrong way. Instead, it is now the regularity of the hole pattern: the periodic array of holes forms what is called a photonic crystal [163]; for the right wavelengths, there is a photonic band gap which keeps the light from leaving the core through a coherent scattering e ect. This is related to periodic structures in nature which, e.g., give butterfly wings their fancy colors. We repeat that for solid core holey fibers, the periodicity of the hole pattern is not decisive, whereas for hollow core photonic crystal fibers it is of crucial importance. By the details of the pattern, an interval of wavelengths, typically 50−150 nm wide, becomes the guiding range of the fiber. The value of the pitch Λ is particularly important: By and large, the range of guidance is shifted proportionally when Λ is varied.
74 |
Chapter 4. Chromatic Dispersion |
In an interesting departure from standard practice, a hollow core photonic crystal fiber with radially varying pitch of the hole pattern was demonstrated in [141] to allow more freedom in designing the dispersion properties.
4.7.3New Possibilities
Microstructured fibers o er a variability in almost all fiber parameters, which is unattainable with conventional fibers. The zero-dispersion wavelength can be shifted to much shorter wavelengths, the strength of nonlinear e ects can be enhanced or reduced, and the single-mode regime can be greatly enlarged. This is why these fibers will find a whole range of applications which were not possible with conventional fibers. On the downside, they are a lot more di cult to manufacture and therefore quite expensive. They also have much higher loss than conventional fibers, and mechanically they are not nearly as robust. It is therefore not anticipated that they will replace conventional fibers in applications like long-haul transmission.

Chapter 5
Losses
Charly Kao, then with Standard Telecommunications Labs in England, proposed in 1966 that it should be possible to produce fibers with loss below 20 dB/km [84]. He had arrived at this conclusion after noting that losses were not an intrinsic property of the glass itself, but rather were due to impurities. His remarkable insight earned him the Nobel prize in physics in 2009.
At the time one could make glass with about 1 dB/m, this was an improvement over glass of ancient Egypt by four orders of magnitude. Then, in less than 20 years, another improvement of four orders of magnitude was reached. The loss came down to 0.2 dB/km, a figure now routinely obtained at 1.5 μm. Part of this progress stems from longer wavelengths now being used: In the visible, the best glass had and has several dB/km loss. Once loss contributions due to impurities had been almost completely eliminated, a fundamental limit was reached, which is defined by the structure of the glass itself.
5.1Loss Mechanisms in Glass
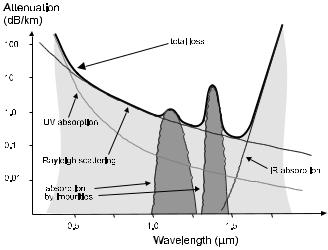
This fundamental limit is determined by three factors: (a) the long-wave tail of material resonances in the ultraviolet (electronic transitions), (b) the shortwave tail of material resonances in the infrared (molecular vibrations), and
(c) Rayleigh scattering due to the statistical structure of the glass. Rayleigh scattering is the same mechanism that makes the sky blue and the sun yellowish (and contributes to its orange to reddish appearance just prior to sunset). The reason is its strong wavelength dependence: The e ciency of Rayleigh scattering scales with the negative fourth power of wavelength.
At the short wavelength end of the visible (in the blue and violet), the contribution from ultraviolet resonances is the leading factor. In much of the the visible spectral range and also in the first and second window for telecommunication, Rayleigh scattering dominates while infrared resonances are irrelevant. The third window finally is in the transition regime: Beginning around 1.6 μm the contribution from infrared resonances overtakes the Rayleigh contribution.
It is not a trivial task to determine with any precision what the theoretical limit for the lowest possible loss is. Taking clues from data taken on bulk glass, a minimum of 0.114 dB/km was derived; this figure corresponds to an energy loss of 2.6%/km. In 1986, researchers at the Sumitomo company succeeded
F. Mitschke, Fiber Optics, DOI 10.1007/978-3-642-03703-0 5, |
75 |
c Springer-Verlag Berlin Heidelberg 2009
76 |
Chapter 5. Losses |
Figure 5.1: Spectral dependence of the contributions to energy loss in a fiber.
in making a single piece of fiber with a confirmed loss as low as 0.154 dB/km. This record was not repeated, much less improved upon, for a long time. Only in 2002, a fiber loss of 0.151 dB/km was reported, and this newer record was then quickly bested to 0.1484 dB/km [118]. In mass production of fibers, industry has routinely obtained 0.2 dB/km since the late 1980s, and occasionally 0.18 dB/km. The reader might think that bargaining for the last few percentage points might be of little relevance, but that would be a wrong conclusion: Implications are enormous. Even a minor reduction in loss allows to use longer spans for transmission. On any long-haul distance, a number of intermediate amplifiers or signal conditioners is required; their number can be reduced as soon as the loss goes down. The consequence of any loss reduction by, say, a few percent then translates into savings of potentially millions of dollars.
As can be seen in Fig. 5.1, there is a local loss peak between the second and third windows, at about 1.39 μm. It is caused by impurity molecules in the glass. Optical materials must be exceedingly pure to be transparent at all at this wavelength; water vapor in the atmosphere is particularly detrimental. The loss peak is caused by molecular vibrations of water molecules embedded in the glass. There is a characteristic strong vibrational resonance of the OH bond at 2.8 μm. Water is always present in our environment and so ambient air is opaque at 2.8 μm. However, these oscillations are not purely harmonic, but have overtones (anharmonicity). The first overtone (the second harmonic) at twice the frequency, i.e., half the wavelength, is the peak that we see in Fig. 5.1. To be sure, this is a weak overtone, and the OH concentration in the fiber is low, but the resonance stands out conspicuously because the Rayleigh background is so low. Since 1998, manufacturers have succeeded to produce fibers with a much reduced OH content so that the peak disappears into the background (e.g., “AllWave Fiber” by Lucent Technologies [13]).
Besides water, numerous other impurities can contribute to loss. Among these are the transition metals Fe, Cu, Co, Cr, Ni, and Mn. To appreciate the
5.2. Bend Loss |
77 |
required purity, consider this: At 800 nm, one ppb of Cu produces an absorption of several tenths of dB/km. (One ppb, or part per billion, indicates a concentration of 10−9.)
5.2Bend Loss
We have seen that the composition of the glass gives rise to loss mechanisms. On top of all that, there are further losses when the fiber is deployed for use, in particular when it is being bent. This may be intuitively plausible since in a bend the cylindrical symmetry is broken (Sect. 3.4). One has to distinguish two contributions to bending loss known as macro-bending loss and micro-bending loss.
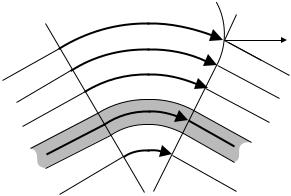
Macro-bending loss occurs when fibers are bent with a “macroscopic” radius of curvature, i.e., in the range of centimeters. If one falls back to a ray-optic view (which is applicable only to multimode fibers, of course), one realizes that the critical angle for total internal reflection can be exceeded in a bent portion. More physically correct, in a wave-optic picture we have seen that the field distribution of any mode is not restricted to the core, but extends into the cladding. As the fiber is being bent, there must be a certain distance from the fiber’s axis toward the outside of the curve where the propagation velocity (as determined by the e ective index for that mode) begins to exceed the maximum possible velocity in the cladding (given its index). Of course, the velocity is not actually exceeded. Rather, the phase fronts cease to be plane and fall behind. There is then a component of the Poynting vector pointing radially outward; this implies energy radiated away from the guided mode (see Fig. 5.2).
 radial
 tangential
Figure 5.2: Bending a fiber creates additional loss. On the outside of the bend, the wave cannot keep up due to its limited velocity. The wavefront gets distorted so that a radial component of radiation is created.
Strictly speaking, there is mechanical tension in the bent fiber so that the inside is compressed, the outside expanded. This creates deviations of the refractive index, e ectively lowering it on the outside. The mechanism just described is counteracted by this, but it is not compensated.
78 |
Chapter 5. Losses |
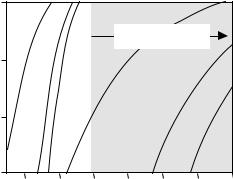
It should be clear that the critical radius at which radiative loss begins must be proportional to the bend radius of the fiber. On the other hand, the modal field radially decays exponentially. Together, it follows that bend loss decreases exponentially when the bend radius increases. It is also implied that the stronger the cladding penetration, the higher is the bend loss. Cladding penetration is high when the index di erence between core and cladding is small; a large value of is thus beneficial in this context. Also, cladding penetration grows with increased wavelength; therefore the highest reasonable V number is also beneficial. It is therefore good practice to operate close to the cuto wavelength of higher-order modes. Higher-order modes also extend farther into the cladding and are more attenuated by bending than the fundamental mode. Bending thus shifts the e ective cuto toward shorter wavelengths (Fig. 5.3). This must be observed when the cuto wavelength is measured, see Sect. 7.5.
Attenuation (dB/km)
106
1000
1
0.001
nominal single-mode regime
2 6 10
|
2 |
|
6 |
|
10 |
|
0.8 |
1.0 |
1.2 |
1.4 |
1.6 |
1.8 |
2.0 |
Wavelength (μm)
Figure 5.3: Macro-bend loss for the LP01 fundamental mode (solid lines) and the LP11 mode (dotted lines), for a loop with radius as indicated in centimeter. In the limit of infinite bend radius the values for the LP11 mode constitute the limit of the single mode regime. At finite radius, the cuto is shifted toward shorter wavelengths. At the same time, loss in the single-mode regime increases. After [120] with kind permission.
It is a standard laboratory trick to shift a fiber’s cuto from, say, 1,200 nm to 1,000 nm by winding it 20 turns on some bobbin with 20 mm diameter.
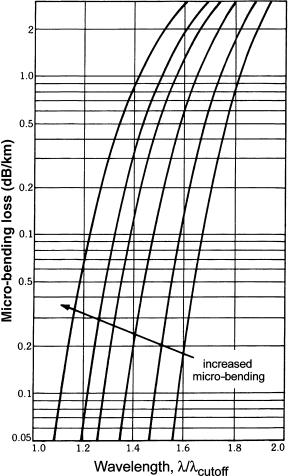
While macro-bending loss is reasonably understood, micro-bending loss is considerably more complicated. At least so much is clear: The e ect is dominated by the statistics of the deviation of the fiber from a straight line. A roughness of 100 nm to 1 μm plays a major role. This raises the issue of the surface material of spools. It is well known in the trade that styrofoam, for example, is particularly bad, probably due to its structure which is best described as air bubbles separated by thin walls. It is also known that micro-bending in multimode fibers creates only a small, wavelength-independent loss contribution while in single-mode fibers there is a sharp loss onset at large wavelength (Fig. 5.4). This tends to shift the wavelength regime of lowest loss, in principle centered around ≈ 1, 600 nm, toward 1550 nm. At V numbers close to 2.4
5.3. Other Losses |
79 |
(i.e., close to the cuto of higher-order modes), this contribution is usually negligible. Since fibers are normally used at 2.1 < V < 2.4 for reasons described in the previous paragraph, the problem is often avoided.
Figure 5.4: Micro-bending loss of the fundamental mode as a function of wavelength (normalized to cuto wavelength). From [48] with kind permission.
5.3Other Losses
Quite a number of influences may give rise, at least in principle, to further loss contributions and must therefore be considered in the design of fibers. These are, of course, taken care of by the fiber’s manufacturer, and the application engineer does not normally deal with such problems. It therefore su ces when we only briefly outline here: Irregularities in the fiber arising in the manufacturing process such as variations of the core diameter, variable deviations from circular symmetry, and variations in refractive index (for example due to fluctuations
80 |
Chapter 5. Losses |
in dopant concentration) can all give rise to increased loss. (Roughness of the core–cladding interface is often considered in the context of micro-bend loss.) Loss is also increased when the cladding glass is of less than the near-perfect purity of the core glass as may happen in certain manufacturing technologies (e.g., in MCVD, see Sect. 6.2). At particularly long wavelengths, even an insu cient outside cladding diameter could cause further loss when the field penetrates the cladding so deeply that it begins to feel the environment, e.g., a plastic coating.
On top of these e ects from manufacturing, there are losses that occur when during operation very gradually the glass composition changes. This can happen through the action of ionizing radiation (see Sect. 12.2.4). Beta radiation (electrons) and gamma rays in particular can damage the material by creating dislocations of nuclei and bonds in the crystal. Such damage can partially, slowly heal after irradiation ceases. These problems are of major concern for space applications, such as aboard spacecraft. In the 1980s, there has been a long-term exposure test called LDEF (long-duration exposure facility) operated by the USA. It went on several years longer than originally planned: After the 1986 Challenger disaster, further space shuttle starts were delayed, and this also involved the return vehicle. Still, the damage found was not too substantial.
There are also chemical e ects a ecting fiber loss. Substances can di use into the glass; this is well known for helium but there is not much helium out there. More relevant is the case of oxygen that is ubiquitous in the atmosphere. Nevertheless, the e ect is subtle enough to be negligible for most applications; in particularly critical cases, one can deposit a barrier layer on the fiber surface.
Finally, it should be remarked that there is indeed one case of impurity that can even lower losses. Embedded OH− groups, while they certainly increase loss in the infrared, can reduce them in parts of the visible and ultraviolet. This happens on a high background of about 1 dB/m and is thus irrelevant for telecommunications applications. On the other hand, sometimes short wavelength light must be guided over short distances; this is the case, e.g., in laser surgery. In such cases, one can exploit this curious fact and use glass with intentionally high OH− content.
5.4Ultimate Reach and Possible Alternative Constructions
At the wavelength of the third window where Rayleigh loss meets the tail of infrared absorption, fibers have their global loss minimum. Does this low loss allow a transoceanic line? Taking a realistic figure of 0.2 dB/km and a typical transoceanic distance of 5,000 km, total loss comes to 1,000 dB. This is too much by any standard. Consider this:
A total of 1,000 dB imply a power attenuation by 100 orders of magnitude. We must certainly demand that at the very least, a single photon must arrive at the detector during the time slot reserved for a single bit. Then, we would have to launch 10100 photons. Since the energy of a single photon is given by E = hν ≈ 10−19 J, the launch energy would have to be 1081 J. Even when we allow a full second for the time slot, 1081 W are about 80 orders of magnitude more than is realistic since, beginning at several watts continuous power, one starts to damage the fiber front face. (In radio engineering a single photon has
5.4. Ultimate Reach |
81 |
much smaller energy; this allows an attenuation of 150 dB from transmitter to receiver without ever reaching a quantum limit. For radio there is a possibility of worldwide reception, e.g., on short wave; in optics, this is not possible).
5.4.1Heavy Molecules
A transoceanic link with 0.2 dB/km is thus not viable without several intermediate amplifiers. How about replacing the silicon dioxide in the glass with heavier molecules? This would shift the infrared resonance toward longer wavelength and postpone the onset of the corresponding loss toward longer wavelengths. One could then move to longer wavelengths and enjoy the benefit that Rayleigh scattering loss is reduced dramatically (according to the negative fourth power of wavelength; (Fig. 5.5)). This is certainly a very appealing idea: If one could change the fiber material so that one could go to wavelengths between 3 and 4 μm, one could reduce loss by a factor of 30. Then the whole 5,000 km length of the span could be taken in one go, without the need for amplification with its associated technical complexity.
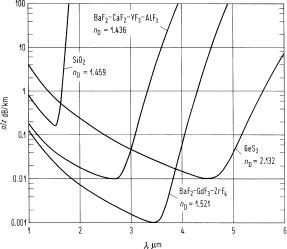
Therefore, researchers have tried for many years to come up with suitable material. In 1978-1979, three groups suggested virtually at the same time that fibers made from fluorides, chalcogenides, or halides would have dramatically lower damping, in principle down to 0.001 dB/km. There is only one problem with all these materials: They o er fantastic perspectives, but so far no one has ever succeeded in making them so that the loss would compete with existing fused silica fibers. This is due to the increased chemical reactivity of all these materials. Also, here are indications that mechanical properties of existing fibers cannot be matched by these more exotic materials: They tend to be brittle and break easily.
Figure 5.5: Theoretical loss of infrared fibers made from various materials, in comparison to SiO2. Infrared absorption sets on at longer wavelengths so that the λ−4 trend of Rayleigh scattering can be exploited toward longer wavelengths. This leads to considerably weaker damping. Unfortunately, these data remain theoretical. After [139] with permission.
82 |
Chapter 5. Losses |
Fluorides. Among fluorides, the most frequently used substance is fluorozirconate or ZBLAN (pronounced zee-blan). The acronym indicates Zr (zirconium), Ba (barium), La (lanthanum), Al (aluminum), and Na (sodium) as constituent elements. In the manufacturing process, the crystalline substances are molten in a crucible and then poured into a rapidly spinning casting mould. The spectral range of reasonably low transmission is between 500 nm and 3.5 μm, with the lowest losses between 1.5 and 2.7 μm. About 15 dB/km at 2.5 μm are obtained commercially. The refractive index is similar to that of fused silica (n ≈ 1.5), dispersion is lower. At 2.8 μm, there is a strong OH− absorption that gives rise to considerable loss; the figure can vary even among fibers by the same manufacturer from 30 to 80 dB/km. Only multimode fibers with core diameters up to 250 μm are available. Critical mechanical tension is quoted at a very low 0.6 MPa, the minimum bend radius at 10 mm. Temperatures above 150◦C pose a problem. Contact with water causes chemical change; coatings need to be employed as barriers.
Chalcogenides. There are very few glasses with good transmission between 3 and 11 μm, including the wavelength of the CO2 laser at 10.6 μm. Chalcogenides composed of arsenic, germanium, and antimony in combination with sulfur, selenium, or tellurium make it possible. The ingredients are mixed, molten, homogenized, and cooled down inside fused silica ampoules under vacuum. There are practical di culties with trapped bubbles, inclusions, and crystallites. In the visible, these fibers are basically opaque. Chemically they are reasonably stable; mechanically at 0.1–0.17 GPa critical tension not very much so. Also, elevated temperatures above 150◦C create di culties. In most cases, these fibers are made without distinction between core and cladding just a cylindrical body. Diameters range from 150 to 500 μm, and there is a plastic coating for protection. The refractive index is about 2.8; therefore coupling both in and out su ers from large Fresnel loss. Overall, loss is much higher than for fluorides, but chalcogenide fibers can be used out to much longer infrared wavelengths.
In view of all the di culties mentioned, e orts to develop such fibers for longdistance use have been reduced. Meanwhile, development has taken an entirely di erent route: Conventional intermediate amplifiers become unnecessary when fibers themselves are transformed into amplifiers (see Sect. 8.8.1).
There are, however, applications when a flexible light guide is used for a short distance on the order of 1 m. This is true in laser material processing – laser surgery is, after all, a particular variant thereof. In this kind of application, these fibers compete with silica fibers and with sapphire fibers (Fig. 5.6). Silica fibers for these applications are usually made without cladding with 400–1, 000 μm diameter; common wavelengths are 1,064 and 532 nm for Nd:YAG Lasers and 514 nm for Argon ion lasers. The advent of the Ho:YAG-Lasers operating at 2.1 μm created the requirement of silica fibers with less than 5 ppm OH−.
5.4.2Hollow Core Fibers
For use with CO2 lasers with their high power at a wavelength of 10.6 μm, one uses a di erent approach: Here, fibers with hollow core are employed. Hollow core fibers have high loss, but that is of minor importance for guiding high power