

Fiber_Optics_Physics_Technology
.pdf94 |
Chapter 6. Fibers of Glass |
sintering process the porosity is removed. Once the glass is compact, one can pull out the ceramic carrier rod; finally, the preform is “collapsed” to fill the central hole and generate a massive object: a scale model of the fiber.
MCVD
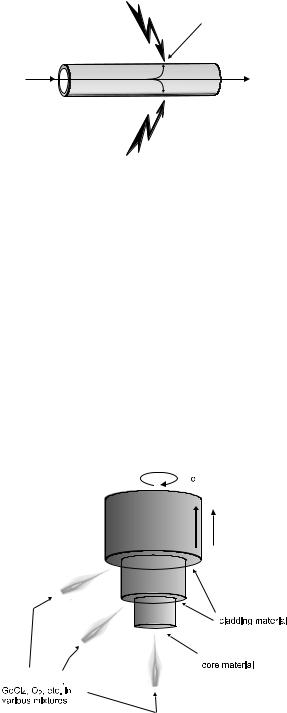
Modified chemical vapor deposition was developed ca. 1974 at Bell Laboratories and is now in widespread use (Fig. 6.7). As compared to OVD, the inside is turned out: One starts with a glass tube (which will later become part of the cladding) and passes the gaseous reactants through the bore. Just as in OVD, a burner is moved along and around the tube; in the heated zone porous glass is deposited. The di erence is that here no residual gas and no water vapor is trapped because there is the wall of the tube between the burner flame and the reaction zone, acting as a barrier. Again, in the next step, the porous glass is sintered. The resulting hollow tube is then collapsed to a massive rod.
The disadvantage to be mentioned here is that the glass tube needs to be of very high purity and uniformity. Also, during the collapsing step, some of the dopant used in the last, innermost layer escapes. This is why the finished fiber often exhibits a central dip in the refractive index profile.
deposition of SiO2 on the inside
supply of SiCl4, GeCl4, O2, etc.
exhaust gas: Cl2
burner flames
 acetylene
Figure 6.7: In modified chemical vapor deposition (MCVD), the glass is formed on the inside surface of a glass carrier tube.
PCVD
Plasma chemical vapor deposition goes back to Philips Research Laboratories in 1975 (Fig. 6.8). This is a variant of MCVD where not a gas burner is used for heating but a microwave generator (3 GHz, several hundreds of watts). Meanwhile, the temperature of the rod is kept at ca. 1000◦C in order to minimize mechanical tensions between tube and deposited layers during heating cycles. The plasma is uniform enough that constant turning of the tube is not required. Also, sintering is unnecessary because the glass is deposited free of pores. Moreover, the process is fast since thermal cycling is much reduced. These items combine into a distinct advantage when very many very thin layers must be deposited for the most precise control over the refractive index profile. It is not at all unusual to deposit 2,000 layers. However, this method also su ers from the central index dip.
6.2. Manufacturing of Fibers |
95 |
deposition of SiO2 on the inside
supply of SiCl4, GeCl4, O2, etc.
exhaust gas: Cl2
microwave irradiation
Figure 6.8: In plasma chemical vapor deposition (PCVD), the glass is deposited inside a carrier tube as in MCVD; however, heat supply is quite di erent and relies on microwave heating.
VAD
Vapor phase axial deposition was developed in ca. 1977 in Japan and is used in that country to this day, and through joint ventures elsewhere, too (Fig. 6.9). This technique is quite di erent from the ones described earlier in that the glass is formed at the end of a rod. One starts at the section of a seed rod, deposits glass, and lets the structure grow longitudinally. The refractive index profile is obtained through an elaborate geometry of burner flames and positions of the nozzles that bring in the reactants. Constant turning helps secure rotational symmetry.
Here, too, the glass is initially porous. One needs to sinter the soot into solid glass by pulling the entire rig through a suitably heated zone. On the other hand, no collapsing is required here.
r 


a


b


d


d


s


Figure 6.9: In vapor phase axial deposition (VAD), the new glass forms right on the end of a carrier rod; this allows to make quasi-endless preforms.
96 |
Chapter 6. Fibers of Glass |
The unique advantage is that the preform can be made to any length; in e ect, endless. This allows to produce very long lengths of fiber in one piece.
Noncircularly Symmetric Fibers
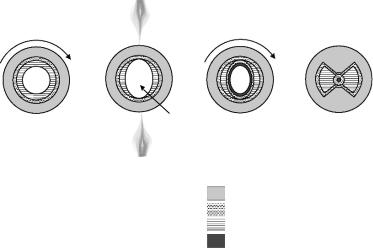
We have seen in Sect. 4.6.2 that polarization-maintaining fibers intentionally deviate from a rotationally symmetric structure. To make such fibers, obviously some process step must be introduced that breaks the circular symmetry. Several approaches have been explored to accomplish this, including mechanically milling a preform to generate an elliptic cross-section. It is more elegant to introduce a highly reactive gas and have it etch away some material on two opposite sides, rather than all around. As is well known, the rate of chemical reactions exponentially depends on temperature (Arrhenius factor). Figure 6.10 shows the procedure, introduced 1982 in Southampton, in the making of a bowtie fiber.
burner
F2 gas
Deposit |
Etch |
Deposit |
Collapse |
SiO2
SiO2 doped with F2 and P2O5
SiO2 doped with B2O3
SiO2 doped with GeO2
Figure 6.10: To make a nonsymmetric bowtie preform, an intermediate step is etching with heating on two opposite sides (rather than uniformly all around). All layers deposited after this step will then grow with a broken symmetry. When the fiber is pulled from the preform, the characteristic bowtie shape is obtained. After [27] with kind permission.
6.2.2Pulling Fibers from the Preform
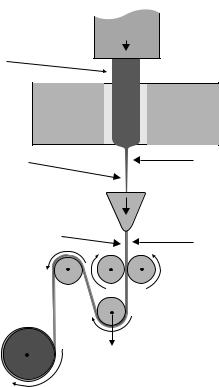
The preceding paragraphs discussed how a preform can be made. Think of a preform as a short (typically 1 m), fat (typical diameter 10–50 mm) version of fibers, complete with all internal structure. In a machine called a draw tower, the preform is heated to the temperature where glass softens and begins to melt, i.e, around 1950–2250 ◦C (Fig. 6.11). One can then catch a thread of glass and pull it into a fiber with a diameter of 70–250 μm, but most frequently 125 μm. In the process, the diameter is reduced some 200-fold; therefore the length increases by 40,000:1 to about 40 km. At a typical, certainly not particularly rapid, speed
6.2. Manufacturing of Fibers |
97 |
|
feed mechanism |
|
|
preform |
|
|
furnace |
|
|
bare fiber |
measurement |
|
|
||
|
of fiber diameter |
|
extruder |
measurement |
|
fiber with coating |
||
of coating diameter |
||
|
capstan |
test for tensile strength
winding drum
Figure 6.11: Schematic depiction of a draw tower. The preform is heated to the onset of melting. The fiber thus formed gets coated with plastic in an extruder and is led over pulleys and onto a receiving drum. Noncontact measurement of fiber and coating diameter is used for closed-loop control of parameters such as advance speed. A test for tensile strength is also applied right here.
of advancing the preform into the heating zone of 200 μm/s, one winds up with a fiber (pun intended) at 8 m/s. At 5,000 s or one and a half hour later, 1 m of preform has been spent, and 40 km of fiber has been made.
This may all sound very simple, but the technical reality is quite involved. Draw towers are two floors high. Temperature and advance speed must be maintained to the most exacting tolerance demands. Online measurements of fiber diameter and other properties are used for elaborate closed-loop control of parameters. As a result, one can maintain the fiber diameter to within 0.1 μm.
Immediately after cooling, a plastic coating is applied by way of an extruder. This is important because it protects the fibers from mechanical factors such as abrasive contact and from chemical influences by water. At the same time, it contributes to minimize micro-bending loss. Frequently the coating consists of two layers: an inner layer is soft, pliable; an outer layer, hard, abrasive-resistant. Epoxides and polyimides are used, also acrylates and silicones. Occasionally, a barrier layer is applied first to keep water out; it can consist of either amorphous carbon or metal like aluminum or gold. Before the fiber is coiled on a spool, a test for tensile strength is conducted.
98 |
Chapter 6. Fibers of Glass |
6.3Mechanical Properties of Fibers
6.3.1Pristine Glass
Contrary to a widely held opinion glass is a material that can withstand quite some mechanical stress. Let us consider tensile strength: Under applied tension, there is deformation and eventually breakage.
At low stress, most materials deform elastically and stretch in proportion to
tension (Hooke’ law): The relative length change, the strain |
l/l, is given by |
|||||||
|
l |
= |
|
1 |
|
F |
. |
(6.4) |
|
l |
|
|
|||||
|
|
E A |
|
|||||
Here F is the applied force (measured in Newton) and A the cross-sectional area (measured in meter square). F/A is then the tension (similar to a negative pressure) and has units of N/m2 = Pa (Pascal). The proportionality constant 1/E contains Young’s modulus of elasticity E; E is also measured in Pa.
There is a certain critical value of tension (F/A)crit, which is called the elastic limit. Beyond this level many materials, depending on their ductility, will undergo plastic deformation. Steel wire deforms plastically, and so does copper wire: it can be stretched 20% longer without snapping. At even higher tension, the ultimate limit is reached and the specimen is destroyed by rupturing. Glass fiber, in contrast to ductile metals, exhibits no plastic deformation but breaks immediately once the critical tension is exceeded. The following table gives some representative values of elastic properties.
The table indicates that the tensile strength of glass is much less in normal specimens than in an idealized situation. In the ideal case (absolutely pure glass without the smallest microscopic scratches in its surface), glass fibers can almost be as strong as steel. At a tension of 20 GPa over a cross-sectional area of A = π4 (125 μm)2, this implies a critical tension of 245 N, corresponding to a fiber suspending a weight of 25 kg. Of course, such ideal circumstances never occur in practice and so the critical strain is at a few percent. This has been studied extensively.
As may be expected, the plastic coating contributes negligibly to the overall tensile strength. The critical tension is strongly influenced by the depth of surface scratches. According to a theory by Gri th, the value stands in inverse proportion to the square root of scratch size. When in practice ca. 5 GPa is obtained, one can conclude that scratches of a few tenths of nanometers are responsible. In this context the plastic coating, applied immediately after drawing the fiber for a good reason, is all-important because it prevents scratches. It also limits the access of water. On the bottom line, the coating is important after all: not by bearing load directly, but by maintaining the initial tensile strength as intact as possible.
The tension for a 1% strain (0.7 GPa) is obtained from |
|
EA × 1% = 8.6 N, |
(6.5) |
so that it is reached at about 880 g load. Fibers are routinely tested for tensile strength right at the draw tower. Standard values are 0.35 GPa, corresponding to 0.5% strain for fibers intended for terrestrial use, and 1.38 GPa, corresponding to 2% strain, for fibers destined for undersea applications. It should be clear
6.3. Mechanical Properties of Fibers |
|
99 |
|||
|
|
|
|
|
|
|
Material |
E (GPa) |
(Δl/l)crit |
(F/A)crit (GPa) |
|
|
Various substances |
|
|
|
|
|
Steel |
210 |
10% |
20 |
|
|
Aluminum |
70 |
|
|
|
|
Copper |
120 |
20% |
|
|
|
Glass |
70 |
1% |
0,05 |
|
|
Lead |
16 |
|
|
|
|
Wood |
10 |
|
|
|
|
|
|
|
|
|
|
Optical fibers |
|
|
|
|
|
Ideal |
70 |
30% |
20 |
|
|
Real |
70 |
3 . . . 7% |
2 . . . 5 |
|
|
|
|
|
|
|
|
Coating materials |
|
|
|
|
|
Thermoplast, polyurethane |
0.04 |
|
|
|
|
Nylon |
1.4 |
|
|
|
|
Acrylate |
0.35 |
|
|
|
Selected values of Young’s modulus, critical strain, and critical tension.
that the latter must withstand greater mechanical stress, in particular in the fiber-laying process.
After deployment, during the intended use, fibers are rarely stressed by more than one fifth of the test level; this gives a safety margin for a life expectancy of several decades. As it is di cult to simulate long-term behavior in a short time one takes resort to statistical extrapolation (Fig. 6.12).
6.3.2Reduction of Structural Stability
Life expectancy of fibers is dominated by all environmental changes that a ect the growth of microscopic cracks. In vacuum or in a chemically inert atmosphere, fibers live longer! Unfortunately, this is of little use for technical applications. There are several ways in which glass can break.
Static fatigue. At constant tensile stress below the critical limit, some fatigue is observed that can create nasty surprises after a while.
Dynamic fatigue. With tensile stress rising linearly with time, one finds critical limits that are lower than described earlier. This phenomenon gives rise to a certain standardized measurement procedure.
Cyclic fatigue. In principle there is no material fatigue in glass as long as the temperature remains su ciently far below the softening temperature. Therefore this process is of minor importance for fibers whereas for many other materials it is quite relevant. On the other hand, during each cycle of tension there is dynamic fatigue.
Zero stress aging. This is a case of unclear, in part contradictory evidence. If glass with a roughened surface is immersed in water at room temperature, it may even happen that the tensile strength is increased (30% have been observed). In an attempt to explain, researchers have conjectured that
100 |
Chapter 6. Fibers of Glass |
the tip of cracks would be rounded through corrosive interaction. In most cases, however, humidity reduces strength. After drying under vacuum, the original strength can be partially restored, indicative of reversibility of the processes involved.
Tension (GPa)
2.5
2.0
1.5
|
minute |
1 hour |
|
day |
month |
1 year |
1 |
1 |
1 week |
||||
|
|
|
1 |
|
|
Life time
Figure 6.12: Reliability test of optical fibers: lifetime under tensile stress. With increasing stress, life expectancy is reduced exponentially. After [159].
The growth of cracks is mostly caused by water from the environment. Static fatigue does not occur when one operates at liquid nitrogen temperature, or in absolutely dry atmosphere or in vacuum. In contrast, when there is an elevated concentration of OH ions, the cracks grow more rapidly. Di erent types of glass are more or less resistant; pure fused silica turns out to be the best.
The crack growth rate increases exponentially both with tension and with temperature. After years of reliable service, static fatigue can lead to an entirely unsuspected sudden rupture of the fiber.
This risk may be typical for all risks that arise when new technologies are introduced. There is always a remote chance that a hidden flaw goes undiscovered until people rely on the seemingly trustworthy technology. The risk can only be held at manageable levels by careful statistical analysis. After some early mishaps, further nasty surprises from optical fibers are no longer anticipated. In this context, it is also important that fibers are used as cables; by suitable construction of the cable, one can keep tensile load away from the fiber and thus increase reliability.

Chapter 7
How to Measure Important Fiber Characteristics
It takes some special procedures to characterize an optical fiber through measurement of its relevant characteristics. These procedures, often developed along with the fibers, are presented in this chapter.
7.1Loss
It is not trivial to measure fiber loss because the value is low, and some precautions and a very good resolution are required to obtain a meaningful value with any degree of precision. At values of a few tenths of dB/km, both resolution and accuracy should be at least a few hundredths of dB/km. Remembering that 0.01 dB = 0.23%, this means that better than one part in thousand is asked for, always a challenge for analog quantities. Here, however, there is one particular obstacle.
The na¨ıve way to do this measurement would be to send light from some source (a lamp, say, or a laser) into the fiber with the help of some suitable focusing lens, then measure power right after and right before the fiber, and compare. However, that strategy fails because the result contains incoupling loss. This loss is mostly due to the fact that only a fraction of the incoupled light ends up in the guided mode (or modes). The rest is lost to the cladding from where it is scattered out. Additionally, there are Fresnel losses at the front and rear fiber face. With utmost care one may reduce these losses to below 10%, but 30% are more realistic in a typical laboratory setting. It is the uncertainty of this value that masks the propagation loss.
This is why one does not use the power before the fiber as a point of reference, but the power shortly after the fiber input end. This requires to first measure the throughput of a very long fiber (length L preferably several kilometers), then cut it after L0 ≈ 1 to 2 m, and repeat the power measurement with the short piece. Provided that the incoupling loss did not change during the procedure, one finds the loss of the piece L −L0. Fresnel losses are also cancelled out. This is known as the cutback technique and is the standard procedure. Still, many sources of error remain. Here are some:
F. Mitschke, Fiber Optics, DOI 10.1007/978-3-642-03703-0 7, |
101 |
c Springer-Verlag Berlin Heidelberg 2009

102 |
Chapter 7. How to Measure Fiber Characteristics |
Lack of constancy of the light source.
Lack of constancy of the incoupling.
Lack of constancy of the detector sensitivity (either due to temperature fluctuations or by inhomogeneity of the detector surface).
Too short L0. Light that is not guided in the mode can travel a short distance in the cladding before it is completely scattered out. Part of it may enter the measurement.
Macroand micro-bending loss.
Around 1980, it became apparent that repeatable loss measurements were a necessity. Throughout the 1980s, several round-robin tests were conducted in various countries in which pieces of fiber were sent around among several institutions for loss measurement and comparison of results. In one such test in 1983/1984, 16 European laboratories in ten countries were involved. Initially, there was a spread in the results of more than 0.2 dB/km, amounting to more than 100% of the value, even though the participants were the best labs from industry and government agencies. It took considerable e ort to reach a satisfactory state of a airs. To achieve constancy of a halogen lamp, for example, it does not su ce to have a constant current run through it: It is also important to have a specific value of that current which is lamp type-dependent but often around 90% of nominal current. At this current, the temporal change of light output is minimized. It is also important to observe the spatial orientation of the filament: For reasons of heat distribution, it makes a di erence whether it hangs horizontally or vertically. If all precautions are scrupulously observed, one may achieve a constant light output within 0.1%. Photodetectors (photodiodes) must be selected for homogeneity of sensitivity across their light-sensitive surface and must be thermostatized to within 0.1◦C.
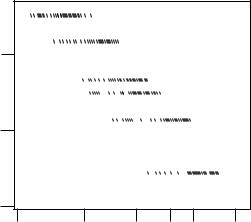
With these and further steps, data can be taken on long fibers with a resolution of one part in thousand of 1 dB/km, and a repeatabiliy of one part in hundred. This makes it possible to obtain data as shown in Fig. 7.1 where the Rayleigh scattering background has been subtracted out so that minute features like impurity absorption bands become visible. It turns out that such data are like fingerprints: It is possible to discern otherwise similar fibers and to identify a particular brand or type of fiber [68].
7.2Dispersion
To measure fiber dispersion usually implies a measurement of the propagation time. There are two avenues one can use: One is the standard procedure in industry but requires a very long piece of fiber, like 100 km. At this length propagation time di erences at di erent wavelengths become directly measurable: To obtain a resolution of 0.1 ps/(nm km), one needs to measure a timing di erential of 10 ps/nm. With two light sources 10 nm apart, this is feasible because fast photodiodes and sampling oscilloscopes easily resolve times well below 100 ps. An example is given in Figs. 7.2 and 7.3.
A di culty to keep in mind is that propagation time also varies due to other causes: The coe cient of thermal expansion of fiber is of the order of 10−5/K

7.2. Dispersion |
103 |
, |
, |
, |
, |
, |
, |
Figure 7.1: Measurement of fiber loss. A term proportional to λ−4 (Rayleigh scattering) was first fitted to the data and then subtracted out; plotted are the residuals. The figure shows two very similar fibers from di erent manufacturers. Absorption bands due to OH groups and other impurities look quite di erent due to slightly di erent manufacturing processes. From [68] with kind permission.
,
.
,
,
Figure 7.2: Scheme to measure fiber dispersion from propagation time. Four di erent wavelengths can be selected. The phase shift of a radio frequency modulation between pairs of wavelengths is measured. It takes very long fibers (≈100 km) to yield useful signals. From [47] with permission.