

- •VOLUME 2
- •CONTRIBUTOR LIST
- •PREFACE
- •LIST OF ARTICLES
- •ABBREVIATIONS AND ACRONYMS
- •CONVERSION FACTORS AND UNIT SYMBOLS
- •CARBON.
- •CARDIAC CATHETERIZATION.
- •CARDIAC LIFE SUPPORT.
- •CARDIAC OUTPUT, FICK TECHNIQUE FOR
- •CARDIAC OUTPUT, INDICATOR DILUTION MEASUREMENT OF
- •CARDIAC PACEMAKER.
- •CARDIAC OUTPUT, THERMODILUTION MEASUREMENT OF
- •CARDIOPULMONARY BYPASS.
- •CARDIOPULMONARY RESUSCITATION
- •CARTILAGE AND MENISCUS, PROPERTIES OF
- •CATARACT EXTRACTION.
- •CELL COUNTER, BLOOD
- •CELLULAR IMAGING
- •CEREBROSPINAL FLUID.
- •CHEMICAL ANALYZERS.
- •CHEMICAL SHIFT IMAGING.
- •CHROMATOGRAPHY
- •CO2 ELECTRODES
- •COBALT-60 UNITS FOR RADIOTHERAPY
- •COCHLEAR PROSTHESES
- •CODES AND REGULATIONS: MEDICAL DEVICES
- •CODES AND REGULATIONS: RADIATION
- •COGNITIVE REHABILITATION.
- •COLORIMETRY
- •COMPUTERS IN CARDIOGRAPHY.
- •COLPOSCOPY
- •COMMUNICATION AIDS FOR THE BLIND.
- •COMMUNICATION DEVICES
- •COMMUNICATION DISORDERS, COMPUTER APPLICATIONS FOR
- •COMPOSITES, RESIN-BASED.
- •COMPUTED RADIOGRAPHY.
- •COMPUTED TOMOGRAPHY
- •COMPUTED TOMOGRAPHY SCREENING
- •COMPUTED TOMOGRAPHY SIMULATOR
- •COMPUTED TOMOGRAPHY, SINGLE PHOTON EMISSION
- •COMPUTER-ASSISTED DETECTION AND DIAGNOSIS
- •COMPUTERS IN CARDIOGRAPHY.
- •COMPUTERS IN THE BIOMEDICAL LABORATORY
- •COMPUTERS IN MEDICAL EDUCATION.
- •COMPUTERS IN MEDICAL RECORDS.
- •COMPUTERS IN NUCLEAR MEDICINE.
- •CONFOCAL MICROSCOPY.
- •CONFORMAL RADIOTHERAPY.
- •CONTACT LENSES
- •CONTINUOUS POSITIVE AIRWAY PRESSURE
- •CONTRACEPTIVE DEVICES
- •CORONARY ANGIOPLASTY AND GUIDEWIRE DIAGNOSTICS
- •CRYOSURGERY
- •CRYOTHERAPY.
- •CT SCAN.
- •CUTANEOUS BLOOD FLOW, DOPPLER MEASUREMENT OF
- •CYSTIC FIBROSIS SWEAT TEST
- •CYTOLOGY, AUTOMATED
- •DECAY, RADIOACTIVE.
- •DECOMPRESSION SICKNESS, TREATMENT.
- •DEFIBRILLATORS
- •DENTISTRY, BIOMATERIALS FOR.
- •DIATHERMY, SURGICAL.
- •DIFFERENTIAL COUNTS, AUTOMATED
- •DIFFERENTIAL TRANSFORMERS.
- •DIGITAL ANGIOGRAPHY
- •DIVING PHYSIOLOGY.
- •DNA SEQUENCING
- •DOPPLER ECHOCARDIOGRAPHY.
- •DOPPLER ULTRASOUND.
- •DOPPLER VELOCIMETRY.
- •DOSIMETRY, RADIOPHARMACEUTICAL.
- •DRUG DELIVERY SYSTEMS
- •DRUG INFUSION SYSTEMS
410 DIFFERENTIAL COUNTS, AUTOMATED
Zipes DP, Jalife J. Cardiac Electrophysiology, From Cell to Bedside, 4th ed. Philadelphia: Saunders; 2004. A comprehensive, multi-author reference book that covers the entire field of cardiac electrophysiology, including chapters on defibrillators. New editions have been appearing about every 4 years.
Hayes DL, Lloyd MA, Friedman PA. Cardiac Pacing and Defibrillation: A Clinical Approach. Armonk, NY: Futura Publishing Co.; 2000. An excellent introduction to both pacing and defibrillation from the point of view of a medical doctor.
Bronzino JD. The Biomedical Engineering Handbook, 2nd ed. Boca Raton, FL: CRC Press; 2000. The definitive source for information about biomedical engineering, with chapters on pacemakers and defibrillators. New editions have been appearing about every 5 years.
See also ARRHYTHMIA ANALYSIS, AUTOMATED; CARDIOPULMONARY RESUSCITATION; PACEMAKERS.
DENTISTRY, BIOMATERIALS FOR. See
BIOMATERIALS FOR DENTISTRY.
DIATHERMY, SURGICAL. See ELECTROSURGICAL UNIT
(ESU).
DIFFERENTIAL COUNTS, AUTOMATED
DAVID ZELMANOVIC
JOLANTA KUNICKA
Bayer HealthCare LLC
Tarrytown, New York
INTRODUCTION
Blood is a tissue composed of a fluid medium called serum, which contains suspended formed elements called blood cells. These include red blood cells (RBCs), white blood cells (WBCs), and platelets. The white blood cells are subcategorized as neutrophils, lymphocytes, monocytes, eosinophils, and basophils. The relative concentrations of the white blood cell types, commonly referred to as white blood cell differential counts, or simply differentials, can provide important diagnostic information regarding the blood donor. In fact, the differential is one of the standard diagnostic tests, ordered by physicians frequently. Originally, differential counts were obtained by microscopic evaluation of 100 or 200 WBCs at 500or 1000-fold magnification. In fact, the microscopic differential counting method remains the recognized reference method, as per NCCLS H20-A (1).
The first automated hematology analyzer was a cell counter based on the Coulter Principle, as described in Ref. 2. According to this principle, a suspension of particles diluted in an electrolyte-containing aqueous medium is drawn through minute apertures on either side of which charged electrodes are positioned. The electrolytic medium and electrodes are part of an electrical circuit, which can be direct current (dc) or radio frequency (RF). As a particle passes through the aperture it raises the impedance of the circuit because of its insulating properties. The momentary change in impedance is recorded as a signal pulse in the
form of a voltage. The number of pulses is proportional to the particle concentration. Additional information about the particles can be obtained from pulse height analysis. White blood cell signals may be subcategorized based on pulse heights as lymphocytes þ basphils, mid-range cells (monocytes þ other large mononuclear forms), and granulocytes (neutrophils þ eosinophils) (Fig. 1) in order to provide a so-called three-part differential counting method. This method is widely used in small laboratories around the world. Hematology analyzers providing three-part differentials are available from all major manufacturers of hematology instrumentation, and from many small manufacturers.
Since the advent of the Coulter principle, other techniques have been developed that permit the automated determination of the full five-part differential. Innovative technology of the current hematology analyzers permits assessment of the patient’s clinical status through a combination of numeric results, morphology flags, cytograms and histograms. Significant technological improvements occurred to the automated analysis of WBCs since the first edition of the EMD (3). Additional automated information on abnormal blood cells combined with microscopic smear review provides an aid in disease diagnosis and patient monitoring. There is a continuing development of more sophisticated analysis to perform extended differential counts that would include differentiation of immature cells, but methods for standardization are not finalized yet.
This article includes a discussion of the cellular properties that are used to automatically analyze white blood cells and describes the techniques used to measure these properties. Examples are provided of the implementation of these techniques on commercial hematology analyzers. Finally, there is a brief discussion of the relative merits of the analysis methods in terms of result accuracy and laboratory efficiency.
MEASURABLE PROPERTIES OF WHITE BLOOD CELLS
Morphology
Cell Size. White blood cells are distinguishable from red blood cells and platelets based on size. In normal individuals all WBCs are larger than red cells or platelets. The lymphocytes and basophils are usually smaller than neutrophils or eosinophils, which are in turn smaller than monocytes. Cell size is used by all automated hematology analyzers to distinguish WBCs from other cells in blood samples, and to further subcategorize WBC types.
Nuclear Size and Shape. White blood cell nuclei may be classified as mononuclear (single lobed) or polymorphonuclear (multilobed). Lymphocytes and monocytes are mononuclear; neutrophils, eosinophils, and basophils are polymorphonuclear. In normal samples lymphocyte nuclei are round and monocyte nuclei are kidney shaped and larger than lymphocyte nuclei. The polymorphonuclear cells typically have two to five nuclear lobes. The nuclei of immature neutrophils may be band-shaped instead of having well-defined lobes. These properties are also used in all automated hematology analyzers.

DIFFERENTIAL COUNTS, AUTOMATED |
411 |
Figure 1. Coulter Principle—Three-part differential histogram.
Granule Number and Size. Cytoplasmic granularity is more pronounced for polymorphonuclear WBCs than mononuclear WBCs. Also, eosinophil granules are larger and more numerous than neutrophil or basophil granules. These properties are used by some automated analyzers to subcategorize WBC types.
Cytochemistry
RNA/DNA Staining. White blood cell nuclei and granules contain ribonucleic acid (RNA) and deoxyribonucleic acid (DNA), which are stained by nucleic acid staining dyes. These properties are used by some automated analyzers to subcategorize WBC types.
Enzyme Activity
Peroxidase. Granules in eosinophils, neutrophils, and to a lesser extent, monocytes, contain peroxidase enzyme, which catalyzes reactions between peroxide and various substrates that can result in deposition of dyes on the granules (4,5). Lymphocyte and basophil granules are peroxidase negative. This property is used in some automated hematology analyzers for subcategorization.
Esterase. Monocytes and neutrophils contain esterase enzymes, and these enzymes can catalyze reactions that result in deposition of dyes (6,7). This method can be used to distinguish monocytes and neutrophils from other cell types. This property is not currently used in automated hematology analysis.
Differential Lysis
Basophils. Basophils are more resistant to lysis than the other WBC types under certain pH conditions (8,9) and this property is used commercially to distinguish them from the other WBC types.
Eosinophils. Eosinophils are more resistant to lysis than other WBC types under certain pH conditions in the presence of polyoxyethylene nonionic surfactants (10) and this property is used commercially to distinguish them from the other WBC types.
Immunocytochemistry
Multidimensional fluorescence flow cytometry uses the measurement of cell physical properties of cell size and cytoplasmic complexity, in addition to surface marker phenotyping using fluorescence-labeled monoclonal antibodies. Monoclonal antibodies have been produced that are specific to WBC generally, such as, CD45, and to specific WBC types, such as, CD3 for T-lymphocytes. These may be labeled with absorbent or fluorescent dyes for identification.
MEASUREMENT TECHNIQUES
Commercial analyzers use some combination of the following six measurement techniques to count WBCs and to distinguish among their subtypes:
Aperture Impedance
This technique uses the electrical insulation properties of WBCs in conjunction with the Coulter principle, described above. As stated, the amplitudes of WBC signals depend on size and to some extent, intracellular properties. Therefore, at least three distinct signal amplitude populations form on impedance signal frequency histograms.
Light Scattering
This technique uses the optical refraction properties of WBCs. White blood cells, suspended in a medium whose
412 DIFFERENTIAL COUNTS, AUTOMATED
refractive index is significantly different (normally lower) than those of the cells, pass essentially in single file through a narrow aperture in a clear glass block. The suspension column is sheathed in a fluid whose refractive index matches that of the medium. A collimated beam of typically monochromatic visible light is incident on the glass cube in a direction that is perpendicular to the direction of the cell stream. As the cells interrupt the beam of light, they scatter it in a manner that is characteristic of their size and refractive index, and to a lesser extent of their internal properties, including granularity and nuclear configuration. Each signal pulse corresponds to an enumerated WBC. Light scattering intensities are a function of the scattering angle, and intensity measurements are usually made over two, three, or even four different scattering-angle intervals. The scattering intensity patterns are characteristic of the WBC subtypes. Twoor higher-dimensional scattering intensity plots form signal clusters that are associated with different WBC subtypes. These scatter–scatter plots are called scattergrams or cytograms, since they are multidimensional plots of the scatter signals generated by cells.
Optical Absorption
This technique uses the cytochemical properties of WBCs that permit the cells to be stained or to accept dye in a manner characteristic of the cell subtype, in conjunction with pretreatment of the cells. The measurement process is similar to that for light scattering, except that a characteristic decrease in light transmission is measured.
Fluorescence
Fluorescence is the reemission, at a lower frequency, of light absorbed at a given frequency. Fluorescence signals are generally larger than absorption signals. This technique uses cytochemical properties, as above, except that the stain is fluorescent rather than absorptive. This technique for obtaining WBC differentials should be distinguished from the immunofluorescence technique that relies on the lineage-specific expression of cell surface antigens to produce distinct so-called clusters of designation (CDs). Although immunofluorescence can be highly specific and therefore very accurate, it is not used in commercial hematology analyzers because of the high costs of the fluorescent-labeled monoclonal antibodies required to specifically tag the cell surface antigens.
Automatic Pattern Recognition
This method relies upon computerized pattern recognition algorithms to classify WBCs. Stained blood film slides are mounted on a microscope stage with motor-driven advancement of the slide in the plane perpendicular to the optical axis. Cellular images are captured on CCD arrays and the images are analyzed by pattern recognition techniques. A WBC differential can be reported based on the classifications. The basic technique was developed in the 1960s by a company called Geometric Data, in a product called the Hematrak (11). A current version of this technology, called Cellavision, is available from a company
called CellaVision, Inc. (1555 Jupiter Park Dr., Suite 6, Jupiter, FL 33458, www.cellavision.com.
This technique is not widely used because the instrumentation, which provides a WBC differential, but not an absolute count, is expensive. The per-sample cost is also high. Further, until recently the throughput was low. Currently, Cellavision claims a throughput of 100 samples per hour, which is comparable to the throughput of major automated hematology analyzers.
One advantage of this technique is that the fixed, stained blood films, which are actual whole blood samples, can be stored for years. Also, since the positions of the imaged cells can be recorded, the cells can be recalled for future manual review. This is not possible with routine automated hematology analyzers, where the analyzed cell suspensions are disposed of immediately.
Image-in-Flow
This technology combines flow cytometry and image analysis. As suspended stained cell flow through a narrow aperture in an optical flow cell, their images are captured on CCD arrays. Pattern recognition algorithms analyze the images and classify the cells. In addition, these instruments act as flow cytometers and provide light scattering intensities and fluorescence intensities. The scattering and/or fluorescence data can be displayed on cytograms. As a result, it is possible to select a point on a cytogram and display the associated image. The Amnis Corporation ImageStream 100 is an example of such a device (12). Sysmex Corporation has reported on an experimental version of such a device, as well (13).
SAMPLE STABILITY
The physical and chemical properties of WBCs are subject to change in vitro. The extents of these changes depend on both storage time and temperature. First, WBC swell, then their membranes become leaky and they release their granules, and ultimately they autolyse. In addition, WBC nuclei undergo subtype-dependent configuration changes in vitro. Degradation is more rapid at ambient temperatures than under refrigeration. The rate of degradation differs according to the WBC subtype.
Swelling affects both cell size and refractive index. Also, since the granules are denser than their cytoplasmic medium, the cells become less dense upon granule release, even without consideration of swelling. Further, granule release affects the cytochemical properties of WBCs in a subtypespecific manner.
Generally, cell morphology is less stable over time in vitro than enzymatic properties, such as peroxidase and esterase activity. It is also less stable than nucleic acid staining capability. Therefore, automated analyzers that use only morphological properties to determine WBC differentials are more limited in terms of the in vitro age of samples that they can accept for analysis than are analyzers that use cytochemical properties. For example; automated analyzers that use light-scattering patterns to distinguish among WBC subtypes based on differences in morphology, use either fixed gates based on typical cell patterns to define
cell populations, or combinations of gates and pattern recognition techniques, such as cluster analysis. Analyzers that use fixed gates provide inferior discrimination to those that include cluster analysis, because cell clusters shift as a result of morphological changes. Even analyzers using cluster analysis cannot distinguish well among cell populations once these begin to merge due to cell degradation. To the extent that cell cluster positions can be maintained, these limitations are overcome. Cytochemical staining based on enzymatic activity of cells, along with absorption or fluorescence measurements, provides added cluster position stability because of the relative stability of these cellular properties.
SAMPLE PREPARATION
White blood cell concentrations in peripheral blood samples normally range from 4 103 11 103 per microliter (mL). Red blood cell concentrations normally range from 4 106 5.5 106 mL 1, and platelet concentrations from 150 103 400 103 mL 1. Individually, WBCs, RBCs, and platelets are mutually distinguishable by size alone. However, in undiluted whole blood samples the concentration of RBC is so large that electronic sensors can detect only a single prolonged signal due to the ever-present red cells. Given typical signal processing conditions for automated analyzers, this remains true even at 50-fold sample dilutions. It is not until approximately a 500-fold dilution that the signal interference from RBCs in a sample becomes manageable, but at this dilution only 100 or so WBCs are counted in a typical cycle in which 50,000 or so RBCs are counted. This is statistically inadequate for automated WBC differential determinations. Automated analyzers deal with this issue by selectively destroying (lysing) the RBCs in a whole blood sample, by adding surfactant and/or by reducing the osmolality of the suspension medium. This is usually done at a dilution ratio of 40–100:1 to maintain adequate WBC concentrations for counting purposes. In the absence of RBCs, at a dilution ratio of 50:1 as many as 100,000 events can be automatically analyzed within 10–20 s.
SIGNAL GENERATION
The number of WBC events analyzed by automated hematology systems during a measurement cycle must be controlled. Typically, 5000–10000 WBC events are counted during the cycle. In addition to controlling the number of events counted, the systems must control the quality of the observations made. This is necessary because in both optical and aperture impedance measurements the signal generated by a particle in the sensing zone depends on the position of the particle within the zone. To minimize particle position variability, the stream of cells in a WBC suspension is centered within the zone. The cell suspension is constricted to the center of the zone by enveloping it in a fluid cladding called a sheath. This constriction is often referred to as hydrodynamic focusing. Sheathing also serves to control event frequency.
The signals generated in aperture impedance systems and in light scatter systems are measures of cellular
DIFFERENTIAL COUNTS, AUTOMATED |
413 |
properties, such as size, density, granule content, nuclear size, and shape. The signals in systems using light absorption or fluorescence measurements are based on the labeling of cellular components by various dyes/stains.
Measurement artifacts that can interfere with signal generation include spurious signals resulting from high frequency electronic noise; often due to improper electrical grounding of electrical components. Spurious signals arising from light output instability, often due to uncontrolled switching from one laser light emission mode to another. Truncation of signals or short-term signal intensity variations associated with either poor hydrodynamic focusing of cells in the flow stream or misalignment of the stream in the signal generation path. Signals associated with particulate matter other than cells. These are often due to impurities in reagent containers or to precipitation of reagent components due to mishandling or improper storage.
SIGNAL DETECTION
Aperture Impedance
In both dc current and RF current versions, signals appear as voltages. Direct currents primarily probe cell size, whereas RF currents probe cell features, such as granularity, nuclear lobularity, and cell density. Impedance measurements are by themselves adequate for automated three-part differentials, but for automated five-part differential analysis they must be combined with at least one other measurement.
Light Scattering
Four scatter regions are usually associated with optical detectors for automated hematology analysis: axial or forward scatter (0–18), low angle scatter (1–58), high angle scatter (5–458), and very high angle scatter (45–908). The axialor forward-scatter detectors are considered to be sensitive mainly to cell size. Low angle scatter is also associated mainly with cell size. The higher angle regions are associated with internal structure, mainly as a result of multiple scattering from numerous granules and/or from multilobed nuclei. Although there is an association of low angle scatter with cell size and high angle scatter with internal cell properties, both types of scatter depend on size, refractive index, and internal cell properties. Also, the angle cutoffs in parentheses are only by way of example and are not definitive, since smaller segments within these regions may be selected for optical detection, or the collection angle range may bridge the regions.
Light Absorption
Light absorption is detected as a loss of transmitted light. Detectors usually encompass up to 208 of forward light scatter. The absorption is the difference between the light transmitted in the absence of and in the presence of a cell. This measurement technique is use in association with the selective uptake of an absorptive dye as a result of a distinguishing chemical feature of a WBC subtype.
Light loss is not identical to light absorption because it also involves light that is not absorbed, but that is instead

414 DIFFERENTIAL COUNTS, AUTOMATED
scattered outside the collection cone of the detector. This is referred to as pseudoabsorption. In practice, pseudoabsorption contributes significantly to axial light loss for cells with large, numerous, and closely spaced granules that cause multiple light scattering to occur, with subsequent scatter at relatively large angles.
Light absorption signals are usually smaller than fluorescence signals and may also be smaller than low angle light scattering signals because the combination of dye extinction coefficient and the short path traversed through a cell usually results in only minor absorption. Certain combinations of concentration of granular material and absorptive dyes, such as eosinophil granules and 4-chloro- naphthol, provide exceptions. Also, light absorption measurements have low signal/noise ratios because they are detected as fractional (1% range) reductions in light transmission values, and can have cell-specific pseudoabsorption contributions.
Fluorescence
Fluorescence detectors are normally placed at 908 to the incident beam to eliminate the contribution from the light source. This is not formally required, since the fluorescence signal is at a longer wavelength than that of the incident light. Therefore, a wavelength-selective beam splitter may be placed directly in the transmitted-light optical path, with the transmitted component following this path and the fluorescence component a diverted path.
Fluorescence signals are normally larger than absorption signals by their nature. Also, they have relatively high signal/noise because they are detected at different wavelengths than that of the incident radiation so that there is no interference from incident radiation. Also, they do not ride on much larger signals, as in the case of light absorption (Table 1).
EXAMPLES OF WBC DIFFERENTIAL ANALYSIS ON HEMATOLOGY SYSTEMS
The systems are listed alphabetically, by manufacturer name.
Abbott Cell-Dyn 4000 Hematology System and Bayer ADVIA 70 Hematology System
The Cell-Dyn 4000 and ADVIA 70 Systems use similar methodologies, and will therefore be described under the
same heading. The ADVIA 70 will be described first, because it is of somewhat simpler design.
The ADVIA 70 Hematology Analyzer (Bayer HealthCare LLC, Diagnostics Division, Tarrytown, NY) combines the results of an optical channel and a dc electrical impedance channel to determine the WBC differential count.
In the impedance channel, a blood sample reacts with a basic reagent that contains a surfactant. The reagent lyses RBCs while maintaining the integrity of the WBCs. As stated previously, the WBC types that may be distinguished on this basis are lymphocytes þ basophils, which generate the smallest WBC signals, so-called midsized cells, which usually contain monocytes, and granulocytes that include neutrophils and eosinophils. Although monocytes are expected to produce the largest impedance signals based on their size, they do not do so in this reaction system. This is because the reagent compromises the cellular integrity of the monocytes more than those of the neutrophils or eosinophils.
In the optical channel, a whole blood sample is diluted in a reagent that contains a surfactant to lyse RBCs and a fixative to maintain the integrity of WBCs. The reaction mixture is analyzed in the optical flow cell similar in design to the one described bwlow for the ADVIA 2120 Nuclear Density Channel. The light source is a laser diode emitting radiation at 633 nm. The analysis channel includes four silicon photodetectors, to determine the following: (1) Light extinction (Ex), which is the loss in transmission along the axis of incident radiation, (2) small-angle scattering intensity (Sa), (3) wide-angle scattering intensity (Wa), and (4) Super-wide-angle scattering intensity (Swa).
The analyzer displays two cytograms that are based on the signals from the four detectors: the Size cytogram is the graph of the small-angle versus wide-angle signal pairs and it is used to distinguish among neutrophils þ eosinophils, monocytes, lymphocytes, and basophils. The distinctions are based on a combination of cell size, to which the Y- axis signals (small-angle) are most sensitive, and refractive index, to which the Y-axis signals (wide angle) are most sensitive. The other is called the Structure cytogram and is used to distinguish eosinophils from the other white cell types based on the eosinophils’ internal structure. Eosinophils have larger, more numerous granules than the other white cell types. These granules scatter more light into larger angles than the other white cell types do because of multiple scattering of incident radiation among the granules. This diffuses the scattered radiation into larger angles than would result from single scattering.
Table 1. Measurement Techniques Used by the Major Manufacturers of Automated Hematology Analyzers for Routine Five-Part WBC Differential Determinationsa
Hematology System/Manufacturer |
dc Impedance |
RF Impedance |
Scatter |
Absorption |
Fluorescence |
|
|
|
|
|
|
CD4000/Abbott |
X |
|
X |
X |
|
Pentra 120/ABX |
X |
|
X |
X |
|
ADVIA 2120/Bayer |
|
|
X |
X |
|
ADVIA 70/Bayer |
(X)a |
|
X |
|
|
LH750/Beckman Coulter |
X |
X |
X |
|
|
XE-2100/Sysmex |
X |
X |
X |
|
X |
aTechniques used for other than routine analyses are not included.
DIFFERENTIAL COUNTS, AUTOMATED |
415 |
The ADVIA 70 optical channel analyzes 10,000 cells for each sample and it provides the WBC percentages only. In combination with the absolute WBC count from the impedance channel, the system provides the absolute white cell type counts. The system also compares the lymphocyte and granulocyte percentages from the two channels as a crosscheck of results validity and to flag for the presence of abnormal WBC types.
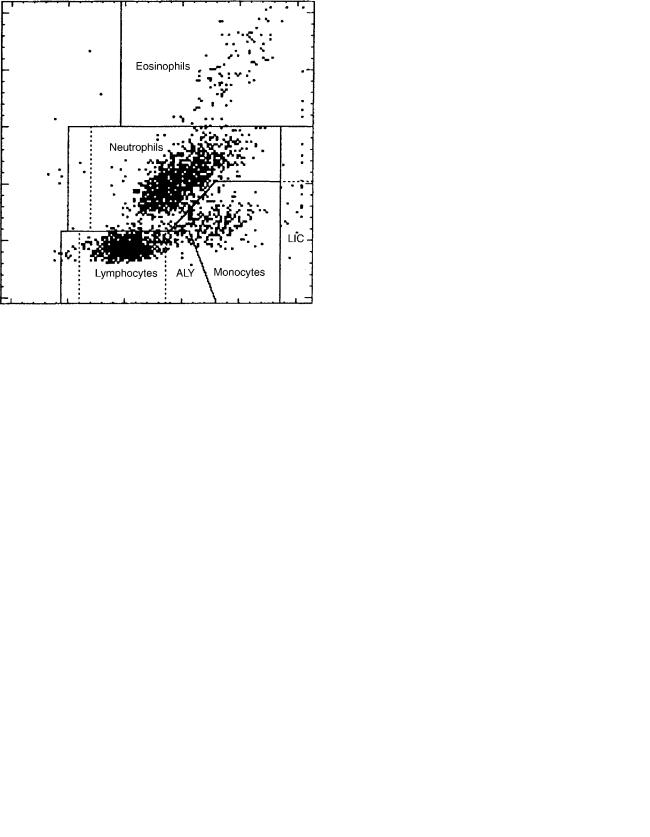
Figure 2 shows associated Size and Structure cytograms. The populations in each figure are labeled and they correspond to lymphocyte signals, mid-range cell signals, and granulocyte signals, respectively. The lymphocyte signals occupy the region closest to the origin since they are the smallest cells and have relatively low refractive index values. The monocyte signals appear higher along the Y- axis, but only slightly to the right of lymphocytes because they are the largest cells, but also have the lowest refractive index values. The Neutrophil þ eosinophil signals appear highest along the Y-axis and furthest along the X-axis because they are larger than lymphocytes and have higher refractive index values than either monocytes or lymphocytes. The basophil signals occupy the region below and to the right of monocyte signals, based on a combination of their sizes and refractive index properties. In the second panel of Fig. 2, the eosinophil signals are located higher along the Y-axis, which corresponds to super-wide angle signal intensity, than signals from the other cell types because of the multiple-scattering properties of the eosinophil granules.
The Cell-Dyn 4000 Hematology System (Abbott Laboratories, Abbott Park, Ill.), is similar in its routine WBC differential analysis technology to the ADVIA 70. It uses both impedance measurements and optical measurements for counting and differentiating WBC types (14–16).
The system differs from the ADVIA 70 system in two ways. First, it uses a 488 nm argon-ion laser instead of a 633 nm diode laser. Scattering patterns are sensitive to wavelength, so that scattering intensity at a given angle is different for 488 nm illumination than 633 nm illumination (16). Second, the CD4000 system distinguishes eosinophils from neutrophils based on 908 depolarized-light scatter ‘‘90D’’ versus 908 polarized-light scatter ‘‘90’’ (Figs. 3–4).
Figure 2. Differentiation of WBC populations based on impedance measurements—ADVIA 70 cytograms.
According to the manufacturer, 908D measurement is especially sensitive to granularity, whereas 908 polarized light is sensitive to lobularity. Since eosinophil granules are generally larger and more numerous than those of neutrophils, they are expected to scatter more light into 90D than neutrophils.
The underlying concept in 90D measurement is the multiple scattering experienced within eosinophils. As the initially polarized light scattered from the first granule encountered is incident on subsequent granules, the polarizarion state of the light is progressively scrambled, so that the depolarized component of light increases at the expense of the polarized component.
ABX Pentra 120 Hematology System
The Pentra 120 Hematology System (ABX, Montpellier, France) uses a combination of dc impedance and light absorbance to determine the routine WBC differential count (17–21). Two reaction mixtures are prepared by
Figure 3. Differentiation of WBC populations based on lightscattering intensity Cell-Dyn 4000 0-degree vs. 10-degree scatter Cytogram.
416 DIFFERENTIAL COUNTS, AUTOMATED
Figure 4. Differentiation of eosinophils from other WBC populations based on polarized vs. depolarized light scattering intensity- Cell-Dyn 4000 polarized light vs. depolarized light Cytogram.
the system. In one, the sample is first mixed with a reagent called Eosinofix, that lyses RBC and stains WBC differentially with chlorazol black, based on cell granularity. The mixture is subsequently diluted with a reagent that stops the reaction process in the first mixture. The suspension passes through a single flow cell that measures both the dc impedance of the WBC and their absorption of incident 488 nm radiation from the argon–ion laser. The resulting signals are displayed on a cytogram, where the X-axis corresponds to cell volume based on dc impedance, and Y-axis corresponds to light absorption (Fig. 5). On this cytogram, lymphocyte signals are clustered nearest to the bottom of the X-axis since they are typically the smallest WBC type. Neutrophil signals are higher along the X- axis since they are larger than lymphocytes. Monocyte and eosinophil signals are higher still, and at roughly the same height, based on their size. Lymphocytess signals are closest to the bottom of the Y-axis because they effectively do not stain with chlorazol black. Monocyte signals are slightly higher because monocytes stain weakly. Neutrophil signals are higher because they stain more heavily, and eosinophil signals are the highest because they stain the most.
This cytochemical staining method is similar to that used on the ADVIA 2120 system. Indeed, this cytogram is similar in appearance to the Peroxidase Channel cytogram of the ADVIA 2120 system when rotated through 90 and viewed in reflection.
In the second reaction mixture RBCs, as well as all WBCs except for basophils are lysed in a reagent called Basolyse (Roche Diagnostics). The resultant reaction mixture passes through the same flow cell as used for the first reaction mixtures and the dc impedance signals of the WBC are recorded (Fig. 6). The intact basophils produce distinctly larger signals than the other WBC types, and are enumerated on this basis. The basophil count is subtracted from the lymphocyte count obtained from the Eosinofix reaction mixture. This method of enumerating basophils is chemically similar to those used in both the Bayer ADVIA 2120 and Sysmex XE-2100 systems.
Figure 5. Differentiation of WBC populations based on DC impedance (to yield volume) and light absorption due to staining by chlorazol black-ABX Pentra 120 volume vs. light absorption cytogram.
Bayer ADVIA 2120 Hematology System
In the ADVIA 2120 Hematology System (Bayer HealthCare LLC, Diagnostics Division, Tarrytown, NY), the results of two optical channels, the Peroxidase Channel and the Lobularity/Nuclear Density Channel, are combined to produce the white blood cell differential count (8,9,22,23).
The Peroxidase Channel measures the peroxidase activity inherent in the WBC types, along with differences in cell type size, to distinguish among the cell types. A whole blood samples is mixed first with a reagent that lyses the sample’s RBCs and fixes the WBCs, and two additional reagents that contain hydrogen peroxide and the dye 4-chloronaphthol are added to the mixture. The cells’ native peroxidase enzyme catalyzes the reaction of the peroxide with the naphthol, resulting in the precipitation of the dye on the cells’ granules. After a few seconds of incubation, the cell suspension is then passed through an optical flow cell for analysis. Two silicon photodetectors
Figure 6. Differentiation of basophils from other WBC populations based on DC impedance (to yield volume)- ABX Pentra 120 volume frequency histogram.
DIFFERENTIAL COUNTS, AUTOMATED |
417 |
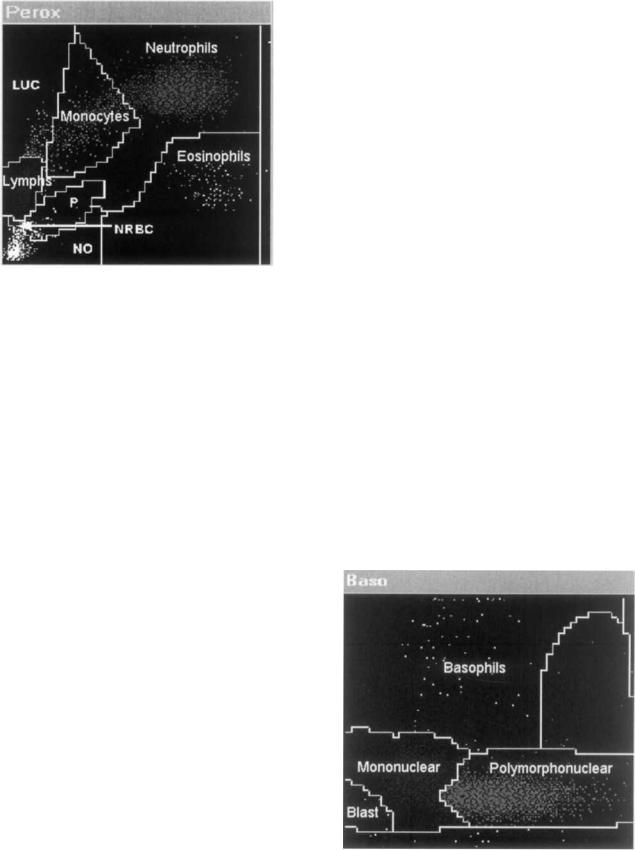
Figure 7. Differentiation of WBC populations based on cytochemistry – ADVIA 2120 Peroxidase Channel Cytogram.
are located such that one collects a component of the small-angle scattering intensity, and the other senses the drop in light transmission due to light absorption by the 4-chloronaphthol deposited on the cells’ granules. A fixed volume at known dilution passes through the flow cell, so that an absolute concentration of cells can be determined. A peroxidase cytogram for a normal blood sample appears in Fig. 7.
The cell types are labeled, including ‘‘noise’’, which consists mainly of platelets. The positions of cells in certain regions of the peroxidase cytogram reflects cell morphology. The lymphocytes are typically the smallest cells and are also peroxidase-negative. Therefore, they appear along the lower part of the Y-axis, which represents the low angle scattering intensity and to the left along the X-axis, which represents light absorption and is sensitive to transmission loss. The LUCs (large unstained cells) are also peroxidase negative, but are larger than normal lymphocytes, so that their signals appear higher along the Y-axis, but at about the same position along the X-axis. Monocyte signals appear above and to the right of normal-sized lymphocytes. They are larger than lymphocytes and slightly peroxidasepositive. Neutrophil signals appear slightly above monocyte signals and to their right. They are typically smaller than monocytes but more peroxidase-positive. Finally, eosinophils, which are typically as large as or larger than neutrophils, have signals that appear to the right of and below the neutrophils.
The Lobularity/Nuclear Density Channel, also called Basophil channel uses the following two WBC features to distinguish among the cell types:
the number of nuclear lobes; the more lobes per nuclear volume, the greater the low angle scattering intensity.
In this channel, a whole blood sample is mixed with a reagent that is acidic and contains a surfactant. The reagent lyses RBC and platelets, and strips all white cell types of their cytoplasm except for basophils. The reaction mixture is passed through an optical flow cell for analysis. The measurement includes light scattered at 2–38 off the axis of the incident beam, and the other measuring light scattered at 5–158.
The Lobularity/Nuclear Density Channel cytogram with cell types labeled is shown in Fig. 8. The basophils, which remain intact, scatter significantly more light than the much smaller nuclei of the other white cell types. Therefore they appear in the upper region of the Y-axis, which corresponds to 2–38 scattering. The nuclei appear near the bottom of the Y-axis due to their small size. However, since the nuclei have a higher refractive index than that of the intact basophils, at least some of them appear to the right of the basophils along the X-axis, which corresponds to 5–158 scatter. As noted above, scattering intensity is a nonlinear function of both size and refractive index. Further, it depends on the number of scattering particles encountered at one time in the sensing zone. The lobes of MNs are single scatterers, whereas the lobes of PMNs behave to a first approximation as multiple scatterers. The scattering pattern of the MNs is due to a combination of their single-lobed nature and their relatively low refractive index. The scattering pattern of the PMNs is due to a combination of their relatively high refractive index and the number of nuclear lobes.
The ADVIA 2120 system uses the Peroxidase Channel results to determine the percentages and absolute numbers of neutrophils, eosinophils, monocytes, lymphocytes þ basophils, and LUCs, and to provide a WBC count for comparison with the Nuclear Density Channel WBC count.
1.Basophils are significantly more resistant to lysis under acidic conditions than the other white cell types.
2.Mononuclear cell nuclei (MNs) scatter light in a
different manner than polymorphonuclear nuclei Figure 8. Differentiation of WBC populations based on scatter (PMNs). The PMN scattering intensity depends on measurements – ADVIA 2120 Nuclear Density Channel Cytogram.
418 DIFFERENTIAL COUNTS, AUTOMATED
The primary WBC count determined and the number and percentage of basophils is determined in this channel. The absolute white cell subtype counts are computed as the product of the differential percentages and the primary WBC count. The system uses the additional information provided by the MN and PMN percentages and counts, and the Peroxidase Channel WBC count to cross-check the validity of the results of the two channels and to test for the presence of abnormal cells.
Beckman Coulter LH 750 Hematology System
The LH 750 Hematology System (Beckman Coulter, Hialeah, FL) uses VCS technology for routine WBC differential analysis (24–27). In the VCS technology (Volume/Conductivity/Scatter), the RBCs in an aliquot of blood are lysed in one reagent and then the WBCs are stabilized in a second reagent. The stabilized WBC suspension passes through a single quartz flow cell that is used for both electrical and optical measurements.
Cell volume (V) is determined based on dc impedance signals. The RF impedance signals provide information about internal structure, such as nuclear volume and internal chemistry. Light scattering signals from 10 to 708, called median angle light scattering (MALS) provide information about cell granularity and lobularity. Since both RF signals and light scattering signals depend on cell size as well as on internal structure, whereas dc impedance is considered to be a function of size only, the RF signals and scattering signals are corrected for the contribution due to cell size, based on the dc signals. The resulting RF signals are called ‘‘opacity’’ because the signals are considered to be sensitive primarily to the density of internal components. For example, opacity is used to distinguish normal lymphocytes from variant lymphocytes, because of characteristic differences between the two cell subtypes in nuclear/cytoplasmic ratio. The volume-compensated MALS signals are called Rotated Light Scatter (RLS) signals. Volume compensation serves to better separate eosinophils from neutrophils on the one hand, and monocytes from lymphocytes on the other hand.
The WBC differential data are displayed as V (DC impedance) signal intensity versus RLS (compensated MALS) intensity signals (Fig. 9). In this cytogram, lymphocytes and monocytes appear to the left along the RLS axis, since they are mononuclear. Monocytes appear above lymphocytes along the V axis since they are larger. In fact, for normal samples they are highest along the V axis since they are the largest cells. Neutrophils and eosinophils appear to the right along the RLS axis, since their nuclei are polymorphonuclear and they have granularity. Eosinophils appear further to the right than neutrophils, because of their larger, more numerous granules. Basophils appear to the right of and somewhat above lymphocytes, based on size, lobularity, and granularity.
Sysmex XE-2100 Hematology System
The XE-2100 Hematology System (Sysmex Corporation, Kobe, Japan) combines fluorescence, forward and side scatter, and dc and RF impedance to determine the fivepart WBC differential (Sysmex 28-36). It also provides
Figure 9. Differentiation of WBC populations based on DC impedance (to yield volume) and light scattering intensityBeckman Coulter LH 750 volume vs. RLS cytograms.
absolute and differential counts of immature WBC, including bands, metamyelocytes, myelocytes, promyelocytes, and myeloblasts as part of the routine differential analysis (28). Three aliquots of whole blood are separately reacted and analyzed.
One aliquot is diluted with a reagent that lyses RBCs and compromises the integrity of WBC membranes, except for basophils. The suspension is passed through an optical flow cell, the suspended cells interrupt a beam of red light from a laser diode, and the forward scattering intensity and side scattering intensity are measured (Fig. 10). The basophils in the suspension produce larger forward scatter and side scatter signals than the other WBC types because they are larger, having retained their cellular integrity and their granules. This method for determining the basophil differential count is similar to that used by the ADVIA 2120 system.
A second aliquot is first diluted with a reagent that lyses the red blood cells and permeabilizes the membranes of the white blood cells to the passage of a red-fluorescent polymethine dye that stains RNA/DNA (29,30). A second reagent containing the dye is then added. As the suspended cells pass through the optical flow cell and interrupt the red laser-diode beam, the side fluorescence and side scatter signal intensities are measured (Fig. 11). Lymphocytes and monocytes produce larger fluorescence signals than neutrophils, basophils, or eosinophils in this reaction channel. This is presumably because the dye preferentially stains RNA, and lymphocytes and monocytes contain more cytoplasmic RNA than neutrophils, basophils, or eosinophils. On the other hand, lymphocyte and monocytes produce smaller side scatter signals than neutrophils and basophils, which in turn produce smaller side scatter signals than eosinophils. The mononuclear cells scatter least because they are less refractile than the polymorphonuclear

DIFFERENTIAL COUNTS, AUTOMATED |
419 |
Figure 10. Differentiation of basophils from other WBC populations based on light scattering intensity. Sysmex XE-2100 forward scatter vs. side scatter cytogram.
cells. Neutrophils and basophils scatter less than eosinophils because they lack the side scatter component provided by eosinophils’ large, numerous granules.
A third aliquot of blood is diluted with a reagent that lyses RBCs and maintains the cellular integrity of immature WBC types in preference to that of mature WBC. The cell suspension is passed through a narrow aperture on either side of which is an electrode. The electrical circuit, completed by the electrodes and the conductive reaction suspension medium, carries both a dc and RF current. The RF and dc impedance signals are measured for each cell as it passes through the aperture (Fig. 12). The mature WBCs and immature white cells produce RF signals of similar magnitude, but the immature cells produce larger dc signals. In this reaction mixture their cellular membrane
Figure 11. Differentiation of WBC populations based on fluorescence intensity and side scatter intensity. Sysmex XE-2100 side fluorescence vs., side scatter cytogram.
Figure 12. Differentiation of immature WBC populations from mature WBC populations based on RF and DC impedance Sysmex XE-2100 RF vs. DC cytogram.
integrity is superior to that of the mature white cells, and the conductivity of the mature cells is reduced because of the compromised cell membrane integrity.
Abbott Cell-Dyn 1700, ABX Micros 60, Bayer ADVIA 60, Beckman Coulter Ac T Diff, Sysmex KX-21N
The above are examples of aperture impedance devices for determining three-part differentials, as described above.
MEASUREMENT TECHNIQUE VERSUS ACCURACY OF RESULTS AND LABORATORY EFFICIENCY
All of the automated five-part differential analyzers described above provide an accurate five-part differential counts for fresh, normal samples as per the specifications listed in the respective operator’s manuals. Differences in performance arise for samples stored in vitro longer than 8 h at room temperature or >24 h at 48 centigrade, as discussed above. Even larger differences may arise for samples with abnormal morphological and/or cytochemical properties. If the cells in the blood samples are morphologically abnormal, but retain their cytochemical properties, then analyzers using cytochemistry will provide accurate enumeration while analyzers using morphological properties will not. On the other hand, retention of cytochemical properties may mask an important underlying cause of abnormal morphology that morphological analysis may reveal through abnormal cytograms.
Laboratory efficiency can be evaluated in terms of throughput and cost. All of the major analyzers produce at least a hundred five-part differential results per hour. Also, the per-test cost, which includes reagents and instrumentation, as well as associated laboratory overhead, such
420 DIFFERENTIAL COUNTS, AUTOMATED
as space and lab personnel, does not vary significantly among manufacturers. However, throughput is affected by factors other than analyzer speed. Even though an analyzer can report 100 results per hour, the laboratory routinely does not immediately release the results without review. The reviews invariably trigger a re-analysis of some fraction of the results. Reanalysis rates, also called review rates, may vary from 10 to 60% depending on a number of factors, listed below. Effective management of review rates optimizes laboratory throughput by creating the proper balance between throughput and accuracy of results. This balance in turn bounds the cost of laboratory operations.
Since the review rate significantly affects laboratory efficiency, it is important to list the factors affecting the review rate, in order to compare the performance of different types of analyzers with respect to these factors. The factors include type of laboratory; donor population; sample age; review criteria.
If the laboratory is in a hospital, then the samples it receives will usually be fresh (<8 h postvenipuncture), so that differences in analyzer performance associated with sample stability will not be a factor. If it is a reference laboratory, which typically receives samples that are 4–48 h old, then these differences may significantly impact the review rate. Analyzers that use cytochemical properties of cells such as enzyme activity or nuclear staining to determine differentials may provide more reliable results and therefore reduce review rates than analyzers that use cell morphology alone to determine differentials.
If the donor population is comprised of mostly normal donors, such as occurs in labs that perform screens for insurance companies and the like, then the review rates can be expected to be low and any of the automated analyzers will provide good results. In this donor population, differences in the low review rate will depend more on differences in analyzer reliability than on differences in method accuracy. If the donors are from a general hospital population where a wide range of conditions apply, then technologies that are robust with respect to hematologic variations can be expected to produce a lower review rate than technologies that are suited to only narrow ranges of hematologic conditions. Hematologic variations may include wide swings in WBC concentration, wide swings in differential ratios, cell morphology abnormalities including size variations, changes to nuclear properties and changes to cytochemical properties. If the donor populations are well defined, such as oncology patients, newborns, end-stage-renal dialysis patients, thalassemics, sickle cell disease sufferers and so on, then analyzers whose measurement techniques are best suited to the given population should be selected, in order to optimize review rate. Although sample age correlates strongly to laboratory type, it also comes into play when samples that are normally run fresh must be stored for extended periods before being analyzed. In this case, analyzers that use more stable cellular properties for analysis and that are also accurate over a wide range of hematologic conditions are preferred.
Although review criteria are expected to vary widely based on differences in sample age and donor population,
they can still vary widely even among laboratories of like type and among laboratories that handle the same types of patient populations. The reason is that there is wide latitude among laboratories in what is considered an accurate result and in what is considered an abnormal result. Therefore, variability in review rate is probably attributable more to the lab’s choice of criteria than to any methodology-related factors.
BIBLIOGRAPHY
1.Reference Leukocyte Differential Count (Proportional) and Evaluation of Instrumental Methods: Approved NCCLS Document H20-A. Villanova (PA): National Committee for Clinical Laboratory Standards; 1992.
2.Wallace Coulter: Means for counting particles suspended in a fluid. US Patent 2656508. 10/20/1953.
3.Eggert AA. Differential counts, automated. In: Encyclopedia of Medical Devices, Webster, JG editor. John Wiley & Sons Inc.; 1988. pp 944–956.
4.Mansberg HP, Saunders AM, Groner W. The Hemaolog –D white cell differential system. J Histochem Cytochem 1974;22: 711–724.
5.Saunders AM. Development of automation of differential leukocyte counts by use of cytochemistry. Clin Chem 1972;18: 783–788.
6.Gomori G. Histochemical differentiation between esterases. Proc Soc Exp Biol Med 1945;67:4.
7.Gomori G. Chloroacyl esters as histochemical substrates. J Histochem Cytochem 1953;1:469.
8.Cremins et al. Method for the determination of a differential white blood cell count. US patent 4,801,549. 1989 Jan 31.
9.Cremins et al. Leukocyte differentiation method. US Patent 5,518,928. 1996 May 21.
10.Hamaguchi et al. Reagent and Method for Measuring Leukocytes and Hemoglobin in Blood. US Patent 5116539. 1992 May 26.
11.Miller MN, et al. Pattern recognition system for generating hematology profile. US Patent 4307376. 1981 Dec 22.
12.George TC, et al. Distinguishing modes of cell death using the ImageStream multispectral imaging flow cytometer. Cytometry A 2004; Jun: 59(2):237–245.
13.Wang FS, Kubota F. A Novel Apoptosis Research Method with Image-Combined Flow Cytometry and HITC or IR-125 Staining. Cytometry (Clini Cytom) 2002;50:267–274.
14.Marshall PN. (to Abbott Laboratories); Flow Cytometric Lytic Agent and Method Enabling 5-Part Leukocyte Differential Count. US Patent 5,510,267. 1996 Apr 23.
15.Uptmore C, et al. Comparison of the Sysmex XE-2100 to the Abbott Cell-Dyn 4000, Automated Hematology Analyzer. Sysmex J Inter 2001;11(1):22–26.
16.CELL-DYN 4000 System Operation Manual, Revision 3-03.doc, Abbott Laboratories.
17.Pentra 120 SPS User Manual. Section 2: Description and Technology. P/N RAB 106 CA. ABX Horiba Diagnostics.
18.Lefevre et al. (to ABX); Apparatus For Counting And Determining At Least One Leucocytic Sub-Population. US Patent 5,196,346. 1992 Aug 11.
19.Lefevre et al. (to ABX); Reagent And Method Of Using Same For Automatically Counting Basphilic Leukocytes In The Blood In Resistivity Variation Measuring Apparatus. US Patent 5,196,346. 1993 Mar 23.
20.Lefevre et al. (to ABX); Reagent For Use In Automatic Analyzers For Distinguisher Leukocyte Sub-Populations In Blood Samples. US Patent 5,282,857. 1993 Aug 3.