

90 CELLULAR IMAGING
distribution in peripheral blood is examined using optical, electrooptical and light scattering techniques. As seen, such experimental modalities can be automated and the resulting hematology analyzers can be used for clinical application. Even though the exact strategy of cell counting varies between various manufacturers of automated cell counters, performance standards for such instrumentation have been established by the National Committee for Clinical Laboratory Standard (NCCLS) and the International Council for Standardization in Hematology (ICSH). The parameters evaluated here include (1) accuracy in measurement within a single batch and between batches of blood samples; (2) carryover of parameters between consecutive samples; (3) linearity or the ability to get similar measurements when the sample is diluted to different levels before being read; and (4) clinical sensitivity or the specificity and efficiency with which flags are generated during analysis to detect abnormal readouts. In order to evaluate the above and to tune the instrument for higher accuracy and sensitivity, blood count calibrators are also available from instrument manufacturers. Suitable preparations of preserved blood can also be made by individual laboratories as described by WHO document LAB/97.2 (Calibration and control of basic blood cell counters. Geneva: World Health Organization, 1997. WHO/DIL/97.2). Besides automated counting, manual and semiautomated methods are also applied by research laboratories. Establishment of such methods requires optimization of blood anticoagulant [ethylenedramenatetraacetic acid (EDTA), heparin, or sodium citrate typically], definition of appropriate electrolyte for sample dilution and design and optimization of lysis reagents required for specific experimental systems.
While the last 50 years have seen the automation of blood counting using hematology analyzers, a plethora of cell-specific antibodies have also been developed more recently. While some of these reagents are already being applied in the modern blood analyzer, their application may increase in the future. Such development can not only increase the range of parameters measured by the analyzer, they can also improve the accuracy and sensitivity of today’s instrumentation.
BIBLIOGRAPHY
1.Armitage JO, editor. Atlas of Clinical Hematology. 2004; Philadelphia: Lippincott Williams & Wilkins; p 266.
2.Stiene-Martin EA, Lotspeich-Steininger CA, Koepke JA, editors. Clinical Hematology: Principles, Procedures, Correlations. 2nd ed. 1998; Philadelphia: Lippincott Williams
&Wilkins Publishers; p 817.
3.Webster JG, editor. Encyclopedia of Medical Devices and Instrumentation, 4 Volume Set. 1988; New York: John Wiley
&Sons; p 3022.
4.Rodak BF. Hematology: Clinical Principles and Applications. 2nd ed. 2002; Philadelphia: WB Saunders.
5.Bain BJ. Blood Cells A Practical Guide. 3rd ed. 2002; Oxford: Blackwell Science Ltd.
6.Fujimoto K. Principles of Measurement in Hematology Analyzers Manufactured by Sysmex Corporation. Sysmex J Iner 1999;9(1):31–44.
7.Groner W, Kanter R. Optical Technology in Blood Cell Technology. Sysmex J Iner 1999;9(1):21–30.
8.Shapiro HM. Practical Flow Cytometry. 4th ed. 2003; New York: John Wiley & Sons, Inc.; p 736.
9.Tatsumi N et al. Principle of Blood Cell Counter-Development of Electric Impedance Method. Sysmex J Iner 1999;9(1):8–20.
10.Hamaguchi Y. Overview of the Principles of Sysmex’s Hemoglobinometry. Sysmex J Iner 1999;9(1):45–51.
Further Reading
Lotspeich-Steininger CA, Stiene-Martin EA, Koepke JA. Clinical Hematology: Principles, Procedures, Correlations. 1992; Philadelphia: Lippincott. xix; p 757.
Carr JH, Rodak BF. Clinical Hematology Atlas. 2nd ed. 2004; St. Louis (MO): Elsevier Saunders.
Brown BA. Hematology: Principles and Procedure. 5th ed. 1988; Philadelphia: Lea & Febiger.
See also ANALYTICAL METHODS, AUTOMATED; BLOOD COLLECTION AND PROCESSING; CYTOLOGY, AUTOMATED; DIFFERENTIAL COUNTS, AUTOMATED.
CELLULAR IMAGING
AMMASI PERIASAMY
University of Virginia
Charlottesville, Virginia
INTRODUCTION
For decades, autoradiography has been used widely to follow the synthesis of macromolecules by using radioactive isotopes (1). Interpretation of autoradiograms depends on knowledge of biochemical pathways and precursors and are carefully chosen so that they are used by the cell to build only one kind of molecule. On the other hand, light microscopy techniques have become a powerful tool for cell biologists to study cells live or fixed noninvasively (2–4). Fixed cells can also be studied using electron microscopy, which provides higher resolution than the light microscopy system (5,6). However, the light microscopy system allows studying live cells in physiological conditions.
The microscope has been an essential tool found in virtually every biological laboratory after the observation and description of protozoa, bacteria, spermatozoa, and red blood cells by Antoni van Leeuwenhoek, in the 1670s (7,8). The ability to study the development, organization, and function of unicellular and higher organisms and to investigate structures and mechanisms at the microscopic level has allowed scientists to better grasp the often misunderstood relationship between microscopic and macroscopic behavior. Further, the microscope preserves temporal and spatial relationships that are frequently lost in traditional biochemical techniques and gives two- (2D) or threedimensional (3D) resolution that other laboratory methods cannot. The benefits of fluorescence microscopy techniques are also numerous (3,9). The inherent specificity and sensitivity of fluorescence, the high temporal, spatial, and 3D resolution that is possible, and the enhancement of contrast resulting from detection of an absolute rather than relative signal (i.e., unlabeled features do not emit) are
several advantages of fluorescence techniques. Additionally, the plethora of well-described spectroscopic techniques providing different types of information, and the commercial availability of fluorescent probes, many of which exhibit an environmentor analytic-sensitive response, broaden the range of possible applications. Recent advancements in light sources, detection systems, data acquisition methods, and image enhancement, analysis, and display methods have further broadened the applications in which fluorescence microscopy can successfully be applied (2,3). Particularly, the fluorescent probes can be used to target many cellular components to follow the cell signaling in space (nm to m) and time (ns to days).
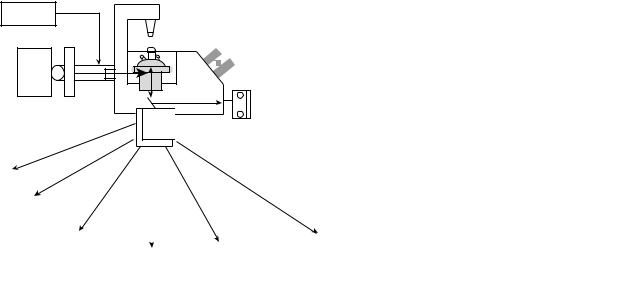
There are a number of microscopic techniques that have been established for cellular imaging including transmitted light–differential interference contrast microscopy (DIC)–phase contrast, reflection contrast microscopy, polarization microscopy, luminescence microscopy, and fluorescence microscopy (2,3,10). Fluorescence microscopy has been categorized into wide-field fluorescence microscopy, laser scanning confocal microscopy, multiphoton excitation microscopy, Fo¨rster (or fluorescence) resonance energy-transfer (FRET) microscopy, fluorescence lifetime imaging (FLIM) microscopy, fluorescence correlation spectroscopy (FCS), total internal reflection fluorescence (TIRF) microscopy, and fluorescence recovery after photobleaching (FRAP) microscopy (2–4,10–15). Some of the other advanced microscopy techniques include near-field microscopy (16,17), atomic force microscopy (18), scanning force–probe microscopy (19), X-ray microscopy (20), and Raman microscopy (21,22). In this article, selected fluorescence microscopy techniques (see Fig. 1) used for cellular imaging such as wide-field, confocal, multiphoton, FRET, FLIM, and CARS microscopy with biological examples are described.
Lasers
FW
AL
M
C
camera |
|
|
CCD |
|
|
-field |
|
|
Wide |
|
|
PMT |
|
|
Confocal |
Multiphoton |
|
|
|
|
|
PMT |
|
Gated camera
|
|
|
Detectors |
|
|
|
|
|
|
|
|
Avalanche |
|
|
|
||
|
|
|
|
|
|
|||
|
|
|
|
|
|
|||
|
ConfocalFCS/image |
|
|
photodiodes/PMT |
||||
|
- |
High |
|
|
||||
|
FLIM |
|
|
correlation |
|
|||
|
field |
|
MP |
|
||||
|
|
|
sensitivity |
|
|
|
||
|
|
|
or |
|
|
|
|
spectroscopy |
|
Wide |
- |
|
|
|
|
||
|
|
|
PMT |
|
|
|
||
|
|
|
FLIM |
|
|
|
|
|
|
|
|
|
|
|
|
|
|
Figure 1. Illustration of various fluorescence microscopy techniques that could be coupled to any upright or inverted epifluorescent microscope. The respective instrumentations are described in the literature. Wide-field (23); confocal (2); multiphoton (3); wide-field FLIM (24); confocal FLIM (25); MPFLIM (26); FCS and image correlation spectroscopy (27,28).
CELLULAR IMAGING |
91 |
BASICS OF FLUORESCENCE
Fluorescence is one of the many different luminescence processes in which molecules emit light. Fluorescence is the emission of light from the excited singlet state. Since this type of transition is usually allowed within the molecular orbitals, the emission rates of fluorescence are in the order of 108 s 1, and fluorescence lifetimes are in nanoseconds. In contrast, phosphorescence is the emission of light from the triplet excited state and this transition is typically forbidden. The emission rates are much in the order of 100– 103 s 1, and phosphorescence lifetimes are typically milliseconds to seconds.
The excitation of molecules by light occurs via the interaction of molecular dipole transition moments with the electric field of the light and, to a much lesser extent, interaction with the magnetic field. The fluorescence processes following light absorption and emission are usually illustrated by a Jabłon´ ski diagram shown in Fig. 2. Examination of the Jabłon´ ski diagram in Fig. 2 reveals that the energy of the emitted photon is typically less then that of the absorbed photon. Hence, the fluorescence occurs at lower energy (longer wavelength) and this process is called Stokes’ shift. The reasons for the Stokes’ shift are rapid transition to the lowest vibrational energy level of the excited state S1, and decay of the fluorophore to a higher vibrational level of S0. The excess of the excitation energy is typically converted to the thermal energy.
Very intense radiation fields, such as those produced by ultrafast femtosecond lasers, can cause simultaneous absorption of two or more photons (two-photon, threephoton absorption, etc.). This phenomenon was originally predicted by Maria Go¨ppert-Mayer in 1931 (30). It is important to realize that fluorescence intensity resulting from oneand two-photon excitation has a different dependence on excitation light intensity (power). Consequently, the fluorescence intensity depends on the squared laser power for two-photon excitation, the cubed (3rd) power for three-photon excitation, and the fourth power for fourphotons excitation. This very strong dependence of fluorescence signal on the excitation power is frequently used to control the mode of excitation.
FLUOROPHORES AND FLUORESCENCE MICROSCOPY
Fluorescence microscopy (FM) plays a vital role in the biological and biomedical sciences, where fluorescence
Figure 2. Jabłon´ ski energy level diagram. S0, S1, and S2 are singlet ground, first, and second electronic states, respectively; T1 ¼ triplet state (4,29).
92 CELLULAR IMAGING
probe specificity and sensitivity can provide important information regarding the biochemical, biophysical, and structural status of cells. The continuing development of fluorescent probes, such as various mutant forms of green fluorescent proteins (GFPs) or fluorophores in conjunction with the strong emergence over the past two decades of confocal and multiphoton microscopy (and specialized applications, such as FRAP, FRET, and FLIM), has been a major contributor to our understanding of dynamic processes in cells and tissue (3,4,12,30–34).
Florescence microscopy can be applied noninvasively to the study of living cells in tissue down to detection levels corresponding to single molecules. Fluorescent probes bound to cellular components with monoclonal antibodies, specific ligand affinities, or covalent bonds allow us to measure chemical properties, such as ion concentrations, membrane potential, and enzymatic activity (35). They allow the experimenter to observe the distribution and function of macromolecules (proteins, lipids, nucleic acids) in living cells and tissues. Techniques have been developed that allow the investigator to place, in cells and tissues, chemically blocked (caged) molecules that can be released or activated (uncaged) by a pulse of light (photolysis) (36). Therefore, a variety of ions, metabolites, drugs, and peptides can be released at carefully controlled times and locations within the specimen. Fluorescent probes and reagents are available from Amersham Pharmacia Biotech, Calbiochem, Fluka, Jackson ImmunoResearch Laboratories, Molecular Probes, Polysciences, Serotec, Sigma-Aldrich, and others. Fluorescent proteins (GFP) and GFP vectors are available from Clontech Laboratories, Quantum Biotechnologies and Life Technologies. Details regarding the selection of fluorophores, labeling, and loading conditions for live cell imaging have been described in the literature (37).
Wide-Field Fluorescence Microscopy
Wide-field fluorescence microscopy is a conventional fluorescence microscope equipped with a movable xyz-axis stage that permits imaging of the specimen at different focus and lateral positions, a higher quantum efficiency CCD camera for quantification of the light emitted by the specimen at different spectra, excitation and emission filter wheels, and an appropriate software package that is capable of synchronizing hardware, acquiring images, and correcting them for distortions and information loss inherent in the imaging process (22). To allow simultaneous monitoring of spectral emissions at two or three wavelengths, a dichroic, double, or triple pass filter is used that reflects the respective excitation wavelength to excite the doubleor triple-labeled cells and transmit the respective emission bands (www.chromatech.com; www.omegaoptical.com).
Wide-field microscopy is the simplest and most widely used technique. It is used for quantitative comparisons of cellular compartments and time-lapse studies for cell motility, intracellular mechanics, and molecular movement (www.api.com). For example, new fluorescent indicators have allowed the measurement of Ca2þ signals in the cytosol and organelles that are often localized (38,39) and nondestructive imaging of dynamic protein tyrosine kinase activities in
single living cells (40). This microscope has also been used for localizing protein molecules in living cells (22,41–43). Moreover, it is essential to implement digital deconvolution approaches to remove the out-of-focus information from the images collected in wide-field microscopy (22) (www.api.com).
Laser Scanning Confocal Microscopy (LSCM)
Wide-field microscopy, however, suffers from a major drawback due to the generation of out-of-focus fluorescent signals. Laser scanning confocal microscopy (LSCM) provides the advantage of rejecting out-of-focus information, and also allows associations occurring inside the cell to be localized in three dimensions. A confocal image with improved lateral resolution yields a wealth of spectral information with several advantages over a wide-field image including controllable depth of field and the ability to collect serial optical sections from thick specimens. Owing to its nanometer depth resolution and nonintrusiveness, confocal provides a new approach to measure viscoelasticity and biochemical responses of living cells and real-time monitoring of cell membrane motion in natural environments (2). The LSCM has been widely used in many biological applications, such as calcium, pH, and membrane potential imaging (2,35).
Confocal microscopy was introduced in 1957. Since then, the technique has gained momentum, particularly after the invention of lasers in the 1960s. Commercially available LSCM generate a clear, thin image (512 512) within 1–3 s or less, free from out-of-focus information. A single diffraction-limited spot of laser or arc lamp light is projected on the specimen using a high numerical aperture objective lens. The light reflected or fluorescence emitted by the specimen is then collected by the objective and focused upon a pinhole aperture where the signal is detected by a photomultiplier tube (PMT). Light originating from above or below the image plane strikes the walls of the pinhole and is not transmitted to the detector (see Fig. 3). To generate a 2D image, the laser beam is scanned across the specimen pixel-by-pixel. To produce an image using LSCM, the laser beam must be moved in a regular 2D raster scan across the specimen. Also, the instantaneous response of the photomultiplier must be displayed with equivalent spatial resolution and relative brightness at all points on the synchronously scanned phosphor screen of a CRT monitor. For a 3D projection of a specimen, one needs to collect a series of images at different z-axis planes. The vertical spatial resolution is 0.5 mm for a 40 1.3 NA objective; for lenses with higher magnification, the vertical spatial resolution is even smaller. Three-dimensional image reconstruction can be accomplished with many commercially available software systems. Another alternative is a commercially available spinning disk based confocal microscope that can be used for cellular imaging (44) (www.perkinelmer.com).
The LSCM has been widely used in many biological applications and as an example here we describe protein localization using Fo¨rster resonance energy transfer (FRET) (4,43,45–48). FRET is a distance-dependent physical process by which energy is transferred nonradiatively from an excited molecular fluorophore (the donor) to

CELLULAR IMAGING |
93 |
another fluorophore (the acceptor) by means of intermolecular long-range dipole–dipole coupling. It can be an accurate measurement of molecular proximity at nanometer distances (1–10 nm) and highly efficient if the donor and acceptor are positioned within the Fo¨rster radius (the distance at which half the excitation energy of the donor is transferred to the acceptor, typically 3–6 nm). The efficiency of FRET is dependent on the inverse sixth power of intermolecular separation (29,49,50) making it a sensitive technique for investigating a variety of biological phenomena that produce changes in molecular proximity (51). As an example Fig. 4 shows acquisition and data analysis for localization of CFPand YFP-C/EBPa proteins expressed in live mouse pituitary GHFT1-5 cell nucleus.
Multiphoton Excitation Microscopy
The instrumentation configuration of multiphoton excitation microscopy (MEM) is generally the same as the LSCM with the exceptions of the excitation light source and the optics. In the LSCM, a visible or ultraviolet (UV) light source is used and an infrared (IR) light source is used for MEM system [see Fig. 3; (52)]. In one-photon (wide-field or confocal) fluorescence microscopy, the absorption of laser energy excites the fluorescent molecules to a higher energy level and results in the emission of one-photon fluorescence. The fluorescence intensity increases at a linear rate with the excitation intensity. Typically, some of the absorbed light energy is dissipated as heat, so the emission wavelength is longer than the absorption wavelength. For example, a fluorophore might
Figure 3. Illumination and detector configuration for wide-field, confocal, and multiphoton microscopy systems. DM ¼ dichroic mirror, WF ¼ wide-field, LSCM ¼ laser scanning confocal microscope, MEFIM ¼ multiphoton excitation fluorescence imaging microscopy, N ¼ nucleus, C ¼ Cytoplasm (22).
absorb one photon at 365 nm and fluoresce at a blue wavelength 420 nm.
The fluorophores exhibit two-photon absorption at approximately twice (730 nm) their one-photon absorption wavelengths, while two-photon (2p) emission is the same as that of one photon (420 nm), allowing the specimen to be imaged in the visible spectrum. When an IR laser beam is focused on a specimen, it illuminates at a single point and the fluorescence emission is localized to the vicinity of the focal point. The fluorescence intensity then falls off rapidly in the lateral and axial direction. In one-photon (1p) microscopy, illumination occurs throughout the excitation beam path, in an hourglass-shaped path (22). This results in absorption along the excitation beam path, giving rise to substantial fluorescence emission both below and above the focal plane. Excitation from other focal planes contributes to photobleaching and photodamage in the specimen planes that are not involved in imaging. The IR illumination in 2p excitation also penetrates deeper into the specimen than visible light excitation due to its higher energy, making it ideal for cellular imaging involving depth penetration through thick sections of tissue.
Two-photon absorption was theoretically predicted by Go¨eppert-Mayer in 1931 and was experimentally observed for the first time in 1961 using a ruby laser as the light source (30,53). Denk and others have experimentally demonstrated 2p imaging in a laser scanning confocal microscopy (54). Two-photon excitation occurs when two photons of ho and ho0 are absorbed simultaneously and a molecule is excited to the state of energy E ¼ ho þ h0o0 (h ¼ Planck’s constant, o ¼ frequency). The probability that

94 CELLULAR IMAGING
Figure 4. Localization of CFPand YFP-C/EBPa proteins expressed in live mouse pituitary GHFT1-5 cells studied using confocal-FRET microscopy. Seven images (a–g) are required to remove the contamination in the FRET image (f). The PFRET (processed FRET) image was obtained after removing the donor (DSBT) and acceptor (ASBT) spectral bleedthrough using the PFRET software (shown on the left panel, www.circusoft.com). The spectral bleedthrough varies depending on the excitation power for the donor and acceptor molecules. The respective histogram for the processed (Hist_PFRET) and the contaminated FRET (Hist_f) demonstrates the importance of removing the spectral bleedthrough signals. The energy-transfer efficiency (E ¼ 20%) was estimated after implementing the detector spectral sensitivity correction for the donor and acceptor channel (43).
2p absorption will occur depends on the colocalization of two photons within the absorption cross-section of the fluorophore. The rate of excitation is proportional to the square of the instantaneous intensity. This extremely high local instantaneous intensity is produced by the combination of diffraction-limited focusing of a single laser beam in the specimen plane and the temporal concentration
of a femtosecond (fs) mode-locked laser (typically of the order of 10 50–10 49 cm4 s 1/photon 1/molecule) (55).
Threeor four photon (or multiphoton) is the extension of two-photon excitation (56).
Two-photon excitation microscopy has been widely used in the area of biomedical sciences including tissue engineering, protein–protein interactions, cell, neuron, molecular, and developmental biology (3,13,22,57–60). Here, we demonstrate as an example the importance of MEM in drug molecule cellular uptake, where MEM is the ideal system for monitoring cellular drug uptake. The separation between excitation and emission wavelengths is considerably more than the 1p (wide-field and confocal) excitation and emission. For example, the excitation for the YK-II-140 drug molecule is 416 nm and emission is at 528 nm and a Stokes shift is 112 nm. In the case of MEM, the excitation for the same drug molecule is 770 nm and the Stokes shift
separation is wider than 112 nm. Moreover, in MEM we were able to detect 100 mM drug cellular uptakes compared to 1.0 mM in the wide-field microscopy. The sensitivity of drug detection is improved largely due to the advantage of the MEM (see Fig. 5 for details).
Spectral Imaging Microscopy
Human color vision is a form of imaging spectroscopy, by which we determine the intensity and proportion of wavelengths present in our environment. Spectral imaging improves on the eye in that it can break up the light content of an image not just into red, green, and blue, but into an arbitrarily large number of wavelength classes. Furthermore, it can extend the range to include the invisible UV and IR regions of the spectrum denied to the unaided eye; this type of imaging is usually known as hyperspectral (61). The result of (hyper) spectral imaging is a data set, known as a data cube, in which spectral information is present at every picture-element (pixel) of a digitally acquired image. Integration of spectral and spatial data in scene analysis remains a challenge.
These multispectral imaging approaches have been used to analyze multiple dyes within a sample. Recently,
CELLULAR IMAGING |
95 |
Figure 5. Comparison of oneand two-photon excitation of a living PC-3 cell loaded with YK-II-140 anticancer drug (1.0 mM concentration). Wide-field microscopy provides more autofluorescence from the cell and media (a) compared to the two-photon microscopy (b) The less autofluorescence improves the detection sensitivity of the drug cellular uptake. Wide-field (Ex 416 nm and Em 528 nm). MEFIM or two-photon (Ex 770 nm and Em 528 nm). Biorad Radiance 2100 confocal– multiphoton microscopy was used for the data acquisition.
Carl Zeiss (www.zeiss.de) introduced the Laser Scanning Microscope (LSM) 510 META system with the revolutionary emission fingerprinting technique permitting the clean separation of several even spectrally overlapping fluorescence signals of a specimen (62). The number of dyes that can be used and detected in the experiment is almost unlimited. The new system overcomes the limits of existing detection methods and permits both qualitative and quantitative analyses quickly and precisely in vitro and in vivo. Furthermore, it is beneficial in many cases for the elimination of unwanted signals, such as background noise or autofluorescence.
The Zeiss 510 Meta system scan head contains two conventional photomultiplier tube detectors (PMT), where the wavelength of the emission light is selected by means of either bandwidth or long passes filters. In the third detector, emission light is passed through a prism and the resulting spectrum is projected onto a detector consisting of a linear array of 32 PMTs, thus enabling the spectral detector to detect a full emission spectrum from a given fluorophore (www.zeiss.com). The advantage of detecting a broad spectrum of emissions is fully realized by the process of linear unmixing (63). This is an image analysis technique that is intrinsic to the LSCM controlling software that compares the experimentally derived emission data to a previously recorded reference spectrum for that fluorophore. In a situation involving samples with multiple overlapping spectra, linear unmixing allows the resolution of fluorophores with closely related emissions, the accurate distinction between GFP and FITC or GFP and YFP being the most often cited example of this feature.
There are other commercial spectral imaging units are available including Leica AOBS (www.leicamicrosystems. com) and Olympus FV1000 (www.olympus.com). The main
differences between these three commercial systems are FV1000 based on Grating/slit/PMT two-channel bidirectional scanning mode; Leica system based on Prism/slit/PMT; and the Zeiss system based on Grating/multi-anode PMT.
Here, as an example we provided the data acquired using the Zeiss multiphoton Meta system to measure FRET signals resulting from protein–protein interactions involving C/EBPa. The GHFT1-5 mouse cells that expressed either the CFPor YFP-C/EBPa fusion protein were used to collect the reference spectra. These reference spectra were used for the linear unmixing of spectra from cells expressing both proteins. Images were then acquired of cells expressing both the CFPand YFP-C/EBPa bound as dimers to DNA elements in regions of heterochromatin that form clearly defined focal bodies in the nuclei of the mouse cells used here (Fig. 6). Images collected (ex 820 nm; em 545 nm) from cells expressing both the CFPand YFP- C/EBPa lambda (l) stacks were spectrally unmixed to reveal the donor bleed-through into the FRET channel (Fig. 6a), allowing the FRET signal to be corrected for the bleed-through signal (Fig. 6b). The emission spectrum for the signal in the FRET channel (Fig. 6c) was determined (b-FRET in panel d) and was then reacquired after selective photobleaching of YFP (a-FRET) using 514 nm, showing the unquenched donor signal. These results demonstrate the power of spectral FRET imaging using the Meta system to detect protein–protein interactions in a single living cell.
Fluorescence Lifetime Imaging Microscopy
Each of the fluorescence microscopy techniques described above uses intensity measurements to reveal fluorophore concentration and distribution in the cell. Recent advances in camera sensitivities and resolutions have improved the

96 CELLULAR IMAGING
Figure 6. Spectral FRET imaging microscopy. Reference spectra (CFP, YFP) were established using cells expressing either CFPor YFP-C/ EBPa; alone, and the emission spectra are shown in panel D. Images were then collected from cells expression both the CFPand YFP-C/EBPa, and the signals were spectrally unmixed to reveal the donor bleed-through (a) into the FRET channel (c), the corrected FRET signal is shown in b. The emission spectrum for the signal in the FRET channel (b-FRET) is shown in panel D, and was reacquired after selective photobleaching of YFP (a-FRET). CFPex 820 nm; YFPex 920 nm. Zeiss510 META system was used for the data acquisition.
capability of these techniques to detect dynamic cellular events (3). Unfortunately, even with the improvements in technology, these fluorescence microscopic techniques do not have high speed time resolution to fully characterize the organization and dynamics of complex cellular structures. In contrast, the time-resolved fluorescence (lifetime) microscopic technique allows the measurement of dynamic events at very high temporal resolution (nanoseconds). Fluorescence lifetime imaging microscopy (FLIM) merges the information of the spatial distribution of the probe with probe lifetime information to enhance the reliability of the concentration measurements. This technique monitors the localized changes in probe fluorescence lifetime (14,24,25,29,43,64–67) and provides an enormous advantage for imaging dynamic events within the living cells.
The fluorescence lifetime (t) is defined as the average time that a molecule remains in an excited state prior to returning to the ground state. In practice, the fluorescence lifetime is defined as the time in which the fluorescence intensity decays to 1/e of the initial intensity (I0) immediately following excitation (i.e., 37% of I0). If a laser pulse excites a large number of similar molecules with a similar local environment and as long as no interaction with another protein or cell organelles occurs, the lifetime is the ‘‘natural fluorescence lifetime’’, t0. If energy is transferred, however, the actual fluorescence lifetime, t, is less
than the natural lifetime, t0, because an additional path for deexcitation is present (28).
Conventional fluorescence microscopy provides images that reveal primarily the distribution and amount of stain in the cell based on measurements of intensity. In contrast, the time-resolved fluorescence microscopic (or FLIM) technique allows the measurement of dynamic events at very high temporal resolution and can monitor interactions between cellular components with very high spatial resolution, as well. A fluorophore in a microscopic sample may exist, for example, in two environmentally distinct regions and have a similar fluorescence intensity distribution in both regions, but different fluorescence lifetimes. Measurements of fluorescence intensity alone would not reveal any difference between two or more regions, but imaging of the fluorescence lifetime would reveal such regional differences (52).
Instrumental methods for measuring fluorescence lifetimes are divided into two major categories: frequencydomain (29,65) and time-domain (52). With the timedomain method (or pulse method), the specimen is excited with a short pulse and the emitted fluorescence is integrated in two or more time windows (24). The relative intensity captured in the time windows is used to calculate the decay characteristics. The determination of prompt fluorescence with lifetime in the range of 0.1–100 ns requires elaborate fast excitation pulses and fast-gated

detection circuits. As an alternative to the time-domain method, the frequency-domain method uses a homodyne detection scheme and requires a modulated light source and a modulated detector. The excitation light is modulated in a sinusoidal fashion. The fluorescence intensity shows a delay or phase shift with respect to the excitation and a smaller modulation depth (29).
The FLIM system can be coupled to any wide-field microscope (24,29,65) (www.tautec.com; www.lambertinstruments.nl). The lifetime method can also be applied to a laser-scanning confocal microscope (www.coord.nl; www.picoquant.com) and multiphoton microscopy (26) (www.becker-hickl.com). The FLIM techniques measure environmental changes within the living cells and can be used in multilabeling experiments. An important advantage of FLIM measurements is that they are independent of change in probe concentration, excitation intensity, and other factors that limit intensity based steady-state measurements. Additionally, FLIM enables the discrimination of fluorescence coming from different dyes, including autofluorescent materials that exhibit similar absorption and emission properties but show a difference in fluorescence lifetime. The FLIM system is not only used for protein– protein interactions, but also for various biological applications from single cell to single molecule as well as deep tissue cellular imaging (3,26,66,68,69).
The data provided here were collected using the twophoton FLIM system to demonstrate the feasibility of implementing the lifetime imaging technique for drug uptake in live cells. The intensity and the lifetime image are shown in Fig. 7 of a prostate cancer (PC-3) cell after adding the drug (1.0-mM concentration) for 2 min. The data clearly demonstrate that there is a considerable difference in lifetime distribution in the cytoplasmic area versus the nucleus, thus allowing the quantitation of the dynamic process of drug molecule uptake in different cellular organelles. The lifetime distribution in the cytoplasm (2 ns) and nucleus (4 ns) clearly reflects differences in molecule uptake between them and both are considerably reduced compared to the natural lifetime (20 ns) of the drug molecule. The FLIM system would reduce background interference and thus enhance measurement precision to yield more accurate understanding of drug molecule associations involved in living cells. These technologies will significantly improve and expand existing capabilities for understanding the drug molecules interactions and for characterizing their binding properties as an ensemble and at the single molecule level.
Fluorescence Correlation Spectroscopy (FCS)
Fluorescence correlation spectroscopy (FCS) is a technique in which spontaneous fluorescence intensity fluctuations are measured in a microscopic detection volume of 10 15 L as defined by a tightly focused laser beam. This spectroscopy is a special case of fluctuation correlation techniques where the laser induced fluorescence from a very small probe volume is autocorrelated in time. Fluorescence intensity fluctuations measured by FCS represent changes in either the number or the fluorescence quantum yield of molecules resident in the detection volume (27). Small,
CELLULAR IMAGING |
97 |
Figure 7. The FLIM microscopy-drug moleculeYK-140 uptake in a single living cell. Multiphoton excitation time-resolved intensity
(a) and lifetime (b) images of PC-3 cell after adding the YK-II-140 drug (1.0-mM concentration). There is a clear difference in distribution of lifetime in the nucleus (‘N’) (mean tN ¼ 3.967 ns) versus cytoplasm (‘C’) (mean tC ¼ 2.009 ns). Moreover, considerable amount of quenching of the drug molecule in the cellular environment demonstrates that the drug molecules were interacting with various cell organelles. Consequently, the lifetime was considerably reduced from its natural lifetime 20 ns. Ex–770 nm; Em–528/30 nm. Becker and Hickl board was used in the Biorad Radiance system to acquire the data.

98 CELLULAR IMAGING
rapidly diffusing molecules produce rapidly fluctuating intensity patterns, whereas larger molecules produce more sustained bursts of fluorescence. If no further effects on fluorescence characteristics are present, fluctuations in the emission light simply arise from occupation number changes in the illuminated region by random particle motion. Excellent article on FCS basics was written by Petra Schwille can be seen in the URL http://www user.gwdg.de/ pschwil/BTOL_FCS.pdf.
Image Correlation Spectroscopy (ICS) was developed as the imaging analog of FCS for measuring protein aggregation in biological membranes. The ICS method entails collecting fluorescence intensity fluctuations as a function of position by using a laser scanning microscope imaging system and analyzing the imaged intensity fluctuations by spatial autocorrelation analysis (28,70). The amplitude of the normalized spatial autocorrelation function is directly related to the absolute concentration of fluorophore in the focal volume and the state of aggregation of the fluorescent entities. Extension of ICS to temporal autocorrelation analysis of image time series also permits measurement of molecular transport occurring on slower time scales characteristic of macromolecules within the plasma membrane. The other related technique, Image CrossCorrelation Spectroscopy (ICCS) allows direct measurement of the interactions of two colocalized proteins labeled with fluorophores having different emission wavelengths. Both ICS and ICCS involve the use of laser scanning confocal microscopy to obtain fluorescence images of fluorescently labeled cell membranes.
RAMAN AND CARS MICROSCOPY
Confocal, multiphoton, and fluorescence lifetime imaging microscopy have become powerful techniques for revealing 3D imaging of molecular distribution and dynamics in living specimens. This followed the development of various natural and artificial fluorophores. For chemical species or cellular components that cannot be fluorescently labeled, Raman microscopy, which measures vibrational properties and does not require molecules to have a fluorescent label, can be used to identify specific signatures of cellular or chemical components (71,72). Raman spectroscopy is an extremely powerful tool for characterizing the physical and chemical properties of the biological molecules. Raman spectroscopy is based upon the Raman effect, which may be described as the scattering of light from a molecule with a shift in wavelength from that of the usually monochromatic excitation wavelength from ultraviolet to infrared light (21). The Raman shifts are thus measures of the amounts of energy involved in the transition between initial and final states of the scattering molecule. Resonance Raman can provide more specific molecular information by working on resonance with particular electronic transitions in the protein (73). Resonant Raman spectroscopy of neutrophilic and eosinophilic granulocytes provided very clear fingerprints of the presence of oxidizing enzymes that these cells require for their functionality (74). With the use of advanced detector technology, single-cell vibrational Raman spectroscopy proved to be sufficiently
sensitive to show the typical spectra of the cell nucleus and cytoplasm in human white blood cells (75). The low scattering cross-section of naturally occurring compounds, such as DNA, RNA, and proteins can be overcome by high peak powers in the laser beams used to generate the Raman signal (76,77). Using the principle of Raman microscopy for cellular imaging, several systems have already been realized: Resonant Raman spectroscopy (75), surfaceenhanced Raman spectroscopy (SERS) (78), coherent antiStokes Raman spectroscopy (CARS) (71,72), and Fourier transform infrared absorption (FTIR) (79).
CARS microscopy relies on the Raman Effect (80). In the spontaneous Raman process, molecules scatter photons, modifying the photon energy with energy quanta that corresponds to the molecule’s vibrational modes. Vibrational contrast in CARS microscopy is inherent to the cellular species, thus requiring no endogenous or exogenous fluorophores that may also be prone to photobleaching. For CARS, two optical beams of frequencies op (1064 nm) and vs (tunable 770–900 nm) interact in the sample to generate an anti-Stokes optical output at oas ¼ 2op os in the phase matched or a specific direction and is resonantly enhanced if op os coincides with the frequency of a Raman active molecular vibration across the entire focal volume. This nonlinear process uses pulsed laser sources. The signal intensity has quadratic and linear dependence on pump and stokes powers, respectively. As a result, it generates signal only within the focus, where the laser intensity is the highest, enabling 3D resolution. The molecular vibrational information obtained by CARS provides a detailed fingerprint of different bonds, functional groups, and conformations of molecules, biopolymers and even microorganisms (71,72). For example, the Raman shift at 2845 cm 1 was used to collect the lipid signal (bright red dots, as shown by arrow in Fig. 8a). When the frequency
Figure 8. Demonstration of CARS and non-CARS image. (a) CARS image of lipids in 3T3 fibroblast cells excited at the vibrational frequency of 2845 cm 1. (b) The frequency was tuned away from the lipids vibrational modes, 2947 cm 1. No lipid is observed as pointed by the arrows. This CARS image was collected at Prof. Sunney Xie’s laboratory (Harvard University) and the CARS microscopy is based on Olympus Fluoview single beam scanning system using synchronizely pumped High Q laser system.
was tuned to 2947 cm 1, the lipid signal disappeared as shown by arrow in Fig. 8b. As described in the Research Activity section above we propose to study the Raman C–H stretching modes and C–C stretching modes in lipid-phase transitions for which we need to tune to different vibrational frequency to calibrate the system. If a particular molecule vibrational frequency is not known, it can be determined by conventional Raman spectrometry. Therefore, vibrational spectroscopy has found wide application in structural characterization of biological materials and in probing interaction dynamics.
CONCLUSION
Multifaceted microscopy technology moved to the center stage in cellular imaging. There is no question that the described microscopy approaches in this paper will continue to increase in all directions, driven by advances in technological development and the growing number of cell biologist researchers who will routinely use this technology for cellular imaging. Even though some of the microscopy techniques are somewhat more complex, they provide an unprecedented level of information about the micromolecular interactions in cells under physiological conditions at a very high temporal and spatial resolution. New fluorophores such as green fluorescent proteins (GFPs) and in particular Quantum Dots will expand the usefulness of cellular imaging qualitatively and quantitatively and that will lead to more detailed insights in studying the cellular dynamics. Raman and CARS microscopy techniques would allow characterizing the physical and chemical properties of the biological without the fluorophore labeling.
ACKNOWLEDGMENTS
The author would like to thank Ms. Ye Chen, Jalan Washington, and Erica Caruso for their help provided in preparation of the manuscript. The author also would like to thank Dr. Milton Brown for providing the drug compounds and Ms. Elise Shumsky, Carl Zeiss for her help in spectral FRET imaging. This work is supported by funds from National Center for Research Resources (NCRR-NIH) and Funds for Excellence in Science and Technology (FEST) at the University of Virginia.
BIBLIOGRAPHY
1.Prescott D. Methods in Cell Physiology. New York: Academic Press; 1968.
2.Pawley JB, editor. Handbook of Biological Confocal Microscopy. 2nd ed. New York: Plenum Press; 1995.
3.Periasamy A, editor. Methods in Cellular Imaging. New York: Oxford University Press; 2001.
4.Periasamy A, Day RN, editors. Molecular Imaging: FRET Microscopy and Spectroscopy. New York: Oxford University Press; 2005.
5.Grimstone A. The Electron Microscope in Biology. New York: St. Martins; 1968.
6.Frank J. Three-dimensional imaging techniques in electron microscopy. Biotechniques 1989;7(2):164–173.
CELLULAR IMAGING |
99 |
7.Hogg J. The Microscope: History, Construction, and Application. London: George Routledge and Sons; 1871.
8.Jones T. 1997. History of the Light Microscope. Available at http://www.utmem.edu/personal/thjones/hist/c1.htm.
9.Periasamy A, Herman B. Computerized fluorescence microscopic vision in the biomedical sciences. J Computer-Assisted Microsc 1994;6:1–26.
10.Inoue S, Spring KR. Video Microscopy: The Fundamentals. New York: Plenum Press; 1986.
11.Wang XF, Herman B, editors. Fluorescence Imaging Spectroscopy and Microscopy. New York: John Wiley & Sons, Inc.; 1996.
12.Lippincott-Schwartz J, Snapp E, Kenworthy A. Studying protein dynamics in living cells. Nat Rev Mol Cell Biol 2001;2(6): 444–456.
13.Diaspro A, editor. Confocal and Two-photon Microscopy: Foundations, Applications, and Advances. New York: John Wiley & Sons, Inc.; 2002.
14.Marriott G, Parker I. Biophotonics, Part A and B. Methods in Enzymology. San Diego: Academic Press; 2003.
15.Prasad PN. Introduction to Biophotonics. New York: WileyInterscience; 2003.
16.Betzig E, Trautman JK. Near-field optics: microscopy, spectroscopy, and surface modification beyond the diffraction limit. Science 1992;257:189–195.
17.Lewis A, Radko A, Ben Ami N, Palanker D, Lieberman K. Near-field scanning optical microscopy in cell biology. Trends Cell Biol 1999;9(2):70–73.
18.Lal R, John SA. Biological applications of atomic force microscopy. Am J Physiol 1994;266(1 Pt. 1):C1–C21.
19.Driscoll RJ, Youngquist MG, Baldeschwieler JD. Atomic-scale imaging of DNA using scanning tunnelling microscopy. Nature (London) 1990;346(6281):294–296.
20.Jacobsen C, Lindaas S, Williams S, Zhang X. Scanning luminescence X-ray microscopy:imaging fluorescence dyes at suboptical resolution. J Microsc 1993;172(2):121–129.
21.Hanlon EB, Manoharan R, Koo TW, Shafer KE, Motz JT, Fitzmaurice M, Kramer JR, Itzkan I, Dasari RR, Feld MS. Prospects for In vivo Raman spectroscopy. Phys Med Biol 2000;45(2):R1–59.
22.Periasamy A, Skoglund P, Noakes C, Keller R. An evaluation of two-photon excitation versus confocal and digital deconvolution fluorescence microscopy imaging in Xenopus morphogenesis. Microsc Res Tech 1999;47(3):172–181.
23.Periasamy A, Day RN. Visualizing protein interactions in living cells using digitized GFP imaging and FRET microscopy. Methods Cell Biol 1999;58:293–314.
24.Elangovan M, Day RN, Periasamy A. Nanosecond fluorescence resonance energy transfer-fluorescence lifetime imaging microscopy to localize the protein interactions in a single living cell. J Microsc 2002;205(Pt. 1):3–14.
25.Gerritsen HC, Asselbergs MA, Agronskaia AV, Van Sark WG. Fluorescence lifetime imaging in scanning microscopes: acquisition speed, photon economy and lifetime resolution. J Microsc 2002;206(Pt. 3):218–224.
26.Chen Y, Periasamy A. Characterization of two-photon excitation fluorescence lifetime imaging microscopy for protein localization. Microsc Res Tech 2004;63(1):72–80.
27.Berland KM, So PT, Gratton E. Two-photon fluorescence correlation spectroscopy: method and application to the intracellular environment. Biophys J 1995;68(2):694–701.
28.Petersen N. FCS and spatial correlations on biological surfaces. In: Rigler R, Elson EL, editors. Fluorescence Correlation Spectroscopy. Berlin: Springer Verlag; 2001. p 2–35.
29.Lakowicz JR. Principles of Fluorescence Spectroscopy. 2nd ed. New York: Plenum Press; 1999.
30.Go¨ppert-Mayer M. Ueber Elementarakte mit Quantenspreungen. Ann Phys 1931;9:273–295.
100 CELLULAR IMAGING
31.Haugland RP. Molecular Probes: Handbook of Fluorescent Probes and Research. Eugene, Oregon: Molecular Probes Inc.; 1989.
32.Tsien RY, Waggoner A. Fluorophores for confocal microscopy: photphysics and photochemistry. In: Pawley JB, editor. Handbook of Biological Confocal Microscopy. New York: Plenum Press; 1995. p 267–279.
33.Tsien RY. Imagining imaging’s future. Nat Rev Mol Cell Biol 2003;(Suppl):SS16–SS21.
34.Wallrabe H, Periasamy A. Imaging protein molecules using FRET and FLIM microscopy. Curr Opin Biotechnol 2005;16: 19–27.
35.Lemasters JJ, Qian T, Trollinger DR, Muller-Borer BJ, Elmore SP, Cascio WE. Laser scanning confocal microscopy applied to living cells and tissues. In: Periasamy A, editor. Methods in Cellular Imaging. New York: Oxford University Press; 2001. p 66–87.
36.Corrie JET, Katayama Y, Reid GP, Anson M. The development and application of photosensitive caged compounds to aid time-resolved structure determination of macromolecules. Philos Trans R Soc London A Ser 1992;340:233–236.
37.Harper IS. Flurophores and their Labeling Procedures for Monitoring Various Biological Signals. In: Periasamy A, editor. Methods in Cellular Imaging. New York: Oxford University Press; 2001. p 20–39.
38.Miyawaki A, Llopis J, Heim R, McCaffery JM, Adams JA, Ikura M, Tsien RY. Fluorescent indicators for Ca2þ based on green fluorescent proteins and calmodulin. Nature (London) 1997;388(6645):882–887.
39.Miyawaki A, Griesbeck O, Heim R, Tsien RY. Dynamic and quantitative Ca2þ measurements using improved cameleons. Proc Natl Acad Sci USA 1999;96(5):2135–2140.
40.Ting AY, Kain KH, Klemke RL, Tsien RY. Genetically encoded fluorescent reporters of protein tyrosine kinase activities in living cells. Proc Natl Acad Sci USA 2001;98 (26):15003–15008.
41.Day RN. Visualization of Pit-1 transcription factor interactions in the living cell nucleus by fluorescence resonance energy transfer microscopy. Mol Endocrinol 1998;12(9): 1410–1419.
42.Chen Y, Periasamy A. Time-correlated single photon counting (TCSPC) FLIM-FRET microscopy for protein localization. In: Periasamy A, Day RN, editors. Molecular Imaging: FRET Microscopy and Spectroscopy. New York: Oxford University Press; 2005. Chapt.13.
43.Chen Y, Elangovan M, Periasamy A. FRET data analysis: The algorithm. In: Periasamy A, Day RN, editors. Molecular Imaging: FRET Microscopy and Spectroscopy. New York: Oxford University Press; 2005. Chap. 7.
44.Maddox P, Desai A, Salmon ED, Mitchison TJ, Oogema K, Kapoor T, Matsumoto B, Inoue S. Dynamic confocal imaging of mitochondria in swimming Tetrahymena and of microtubule poleward flux in Xenopus extract spindles. Biol Bull 1999;197(2):263–265.
45.Elangovan M, Wallrabe H, Chen Y, Day RN, Barroso M, Periasamy A. Characterization of oneand two-photon excitation fluorescence resonance energy transfer microscopy. Methods 2003;29(1):58–73.
46.Mills JD, Stone JR, Rubin DG, Melon DE, Okonkwo DO, Periasamy A, Helm GA. Illuminating protein interactions in tissue using confocal and two-photon excitation fluorescent resonance energy transfer microscopy. J Biomed Opt 2003;8(3):347–356.
47.Sekar RB, Periasamy A. Fluorescence resonance energy transfer (FRET) microscopy imaging of live cell protein localizations. J Cell Biol 2003;160(5):629–633.
48.Wallrabe H, Elangovan M, Burchard A, Periasamy A, Barroso M. Confocal FRET microscopy to measure clustering of ligandreceptor complexes in endocytic membranes. Biophys J 2003; 85(1):559–571.
49.Forster T. Delocalized excitation and excitation transfer. In: Sinanoglu O, editor. Modern Quantum Chemistry Part III: Action of Light and Organic Crystals. New York: Academic Press; p 93–137.
50.Clegg RM. Fluorescence resonance energy transfer. In: Wang XF, Herman B, editors. Fluorescence Imaging Spectroscopy and Microscopy. Volume 137, New York: John Wiley & Sons, Inc.; 1996. p 179–251.
51.dos Remedios CG, Miki M, Barden JA. Fluorescence resonance energy transfer measurements of distances in actin and myosin: A critical evaluation. J Muscle Res Cell Motil 1987;8: 97–117.
52.Periasamy A, Wodnicki P, Wang XF, Kwon S, Gordon GW, Herman B. Time-resolved fluorescence lifetime imaging microscopy using a picosecond pulsed tunable dye laser system. Rev Sci Instrum 1996;67(10):3722–3731.
53.Kaiser W, Garrett CGB. Two-photon excitation in CaF2: Eu2þ. Phys Rev Lett 1961;7:229–231.
54.Denk W, Strickler JH, Webb WW. Two-photon laser scanning fluorescence microscopy. Science 1990;248(4951):73–76.
55.Denk W, Piston DW, Webb WW. Two-photon molecular excitation in laser-scanning microscopy. In: Pawley JB, editor. Handbook of Biological Confocal Microscopy. New York: Plenum Press; 1995. p 445–458.
56.Szmacinski H, Gryczynski I, Lakowicz JR. Three-photon induced fluorescence of the calcium probe Indo-1. Biophys J 1996;70(1):547–555.
57.Svoboda K, Helmchen F, Denk W, Tank DW. Spread of dendritic excitation in layer 2/3 pyramidal neurons in rat barrel cortex In vivo. Nat Neurosci 1999;2(1):65–73.
58.Bacskai BJ, Hickey GA, Skoch J, Kajdasz ST, Wang Y, Huang GF, Mathis CA, Klunk WE, Hyman BT. Four-dimensional multiphoton imaging of brain entry, amyloid binding, and clearance of an amyloid-beta ligand in transgenic mice. Proc Natl Acad Sci USA 2003;100(21):12462–12467.
59.Konig K, Riemann I. High-resolution multiphoton tomography of human skin with subcellular spatial resolution and picosecond time resolution. J Biomed Opt 2003;8(3): 432–439.
60.Soeller C, Jacobs MD, Jones KT, Ellis-Davies GC, Donaldson
PJ, Cannell MB. Application of two-photon flash photolysis to reveal intercellular communication and intracellular Ca2þ movements. J Biomed Opt 2003;8(3):418–427.
61.Farkas D. Spectral microscopy for quantitative cell and tissue imaging. In: Periasamy A, editor. Methods in Cellular Imaging. New York: Oxford University Press; 2001. Chap. 20.
62.Dickinson ME, Simbuerger E, Zimmermann B, Waters CW, Fraser SE. Multiphoton excitation spectra in biological samples. J Biomed Opt 2003;8(3):329–338.
63.Nashmi R, Dickinson ME, McKinney S, Jareb M, Labarca C, Fraser SE, Lester HA. Assembly of alpha4beta2 nicotinic acetylcholine receptors assessed with functional fluorescently labeled subunits: effects of localization, trafficking, and nicotineinduced upregulation in clonal mammalian cells and in cultured midbrain neurons. J Neurosci 2003;23(37): 11554–11567.
64.Gadella TWJ, Jovin TM, Clegg RM. Fluorescence Lifetime Imaging Microscopy (Flim) - Spatial-Resolution of Microstructures on the Nanosecond Time-Scale. Biophys Chem 1993;48(2):221–239.
65.Gratton E, Breusegem S, Sutin J, Ruan Q, Barry N. Fluorescence lifetime imaging for the two-photon microscope: timedomain and frequency-domain methods. J Biomed Opt 2003;8(3):381–390.
66.Krishnan RV, Masuda A, Centonze VE, Herman B. Quantitative imaging of protein-protein interactions by multiphoton fluorescence lifetime imaging microscopy using a streak camera. J Biomed Opt 2003;8(3):362–367.