

- •VOLUME 2
- •CONTRIBUTOR LIST
- •PREFACE
- •LIST OF ARTICLES
- •ABBREVIATIONS AND ACRONYMS
- •CONVERSION FACTORS AND UNIT SYMBOLS
- •CARBON.
- •CARDIAC CATHETERIZATION.
- •CARDIAC LIFE SUPPORT.
- •CARDIAC OUTPUT, FICK TECHNIQUE FOR
- •CARDIAC OUTPUT, INDICATOR DILUTION MEASUREMENT OF
- •CARDIAC PACEMAKER.
- •CARDIAC OUTPUT, THERMODILUTION MEASUREMENT OF
- •CARDIOPULMONARY BYPASS.
- •CARDIOPULMONARY RESUSCITATION
- •CARTILAGE AND MENISCUS, PROPERTIES OF
- •CATARACT EXTRACTION.
- •CELL COUNTER, BLOOD
- •CELLULAR IMAGING
- •CEREBROSPINAL FLUID.
- •CHEMICAL ANALYZERS.
- •CHEMICAL SHIFT IMAGING.
- •CHROMATOGRAPHY
- •CO2 ELECTRODES
- •COBALT-60 UNITS FOR RADIOTHERAPY
- •COCHLEAR PROSTHESES
- •CODES AND REGULATIONS: MEDICAL DEVICES
- •CODES AND REGULATIONS: RADIATION
- •COGNITIVE REHABILITATION.
- •COLORIMETRY
- •COMPUTERS IN CARDIOGRAPHY.
- •COLPOSCOPY
- •COMMUNICATION AIDS FOR THE BLIND.
- •COMMUNICATION DEVICES
- •COMMUNICATION DISORDERS, COMPUTER APPLICATIONS FOR
- •COMPOSITES, RESIN-BASED.
- •COMPUTED RADIOGRAPHY.
- •COMPUTED TOMOGRAPHY
- •COMPUTED TOMOGRAPHY SCREENING
- •COMPUTED TOMOGRAPHY SIMULATOR
- •COMPUTED TOMOGRAPHY, SINGLE PHOTON EMISSION
- •COMPUTER-ASSISTED DETECTION AND DIAGNOSIS
- •COMPUTERS IN CARDIOGRAPHY.
- •COMPUTERS IN THE BIOMEDICAL LABORATORY
- •COMPUTERS IN MEDICAL EDUCATION.
- •COMPUTERS IN MEDICAL RECORDS.
- •COMPUTERS IN NUCLEAR MEDICINE.
- •CONFOCAL MICROSCOPY.
- •CONFORMAL RADIOTHERAPY.
- •CONTACT LENSES
- •CONTINUOUS POSITIVE AIRWAY PRESSURE
- •CONTRACEPTIVE DEVICES
- •CORONARY ANGIOPLASTY AND GUIDEWIRE DIAGNOSTICS
- •CRYOSURGERY
- •CRYOTHERAPY.
- •CT SCAN.
- •CUTANEOUS BLOOD FLOW, DOPPLER MEASUREMENT OF
- •CYSTIC FIBROSIS SWEAT TEST
- •CYTOLOGY, AUTOMATED
- •DECAY, RADIOACTIVE.
- •DECOMPRESSION SICKNESS, TREATMENT.
- •DEFIBRILLATORS
- •DENTISTRY, BIOMATERIALS FOR.
- •DIATHERMY, SURGICAL.
- •DIFFERENTIAL COUNTS, AUTOMATED
- •DIFFERENTIAL TRANSFORMERS.
- •DIGITAL ANGIOGRAPHY
- •DIVING PHYSIOLOGY.
- •DNA SEQUENCING
- •DOPPLER ECHOCARDIOGRAPHY.
- •DOPPLER ULTRASOUND.
- •DOPPLER VELOCIMETRY.
- •DOSIMETRY, RADIOPHARMACEUTICAL.
- •DRUG DELIVERY SYSTEMS
- •DRUG INFUSION SYSTEMS
388 CYTOLOGY, AUTOMATED
11.Gibson LE, Cooke RE. A test for concentration of electrolytes in sweat in cystic fibrosis of the pancreas utilizing pilocarpine electrophoresis. Pediatrics 1959;23:545–549.
12.Smalley CA, Addy DP, Anderson CM. Does that child really have cystic fibrosis? Lancet 1978 Aug. 19; 2(8086):415–417.
13.Baumer JH. Evidence based guidelines for the performance of the sweat test for the investigation of cystic fibrosis in the UK. Arch Dis Childhood 2003;88:1126–1127.
14.Shwachman H, Mahmoodian A. Reappraisal of the chloride plate test as screening test for cystic fibrosis. Arch Dis Child 1981;56(2):137–139.
15.Warwick WJ, Huang NN, Waring WW, Cherian AG, Brown I, Stejskal-Lorenz E, Yeung WH, Duhon G, Hill JG, Strominger D. Evaluation of a cystic fibrosis screening system incorporating a miniature sweat stimulator and disposable chloride sensor. Clin Chem 1986;32(5):850–853.
16.Warwick WJ, Hansen LG, Werness ME. Quantification of chloride in sweat with the Cystic Fibrosis Indicator System. Clin Chem 1990;36(1):96–98.
17.Denning CR, Huang NN, Cuasay LR, Shwachman H, Tocci P, Warwick WJ, Gibson LE. Cooperative study comparing three methods of performing sweat tests to diagnose cystic fibrosis. Pediatrics 1980;66(5):752–757.
18.Warwick WJ, Hansen LG, Brown IV, Laine WC, Hansen KL. Sweat chloride: quantitative patch for collection and measurement. Clin Lab Sci 2001;14(3):155–159.
19.Warwick WJ, Hansen LG, Brown IV, Laine WC, Hansen KL. Sweat chloride: quantitative patch for collection and measurement. Clin Lab Sci 2001;14(3):155–159.
20.Hansen L, Buechele M, Koroshec J, Warwick WJ. Sweat chloride analysis by chloride ionspecific electrode method using heat stimulation. Am J Clin Pathol 1968;49(6):834– 841.
21.Warwick WJ, Hansen LG. Measurement of chloride in sweat by use of a selective electrode and strip-chart recorder. Clin Chem 1978;24(2):381–382.
22.Warwick WJ, Hansen L. Measurement of chloride in sweat with the chloride-selective electrode. Clin Chem 1978;24(11): 2050–2053.
23.Warwick WJ, Hansen L, Viela I, Matheson J. Comparison of the chloride electrode and gravimetric chloride titration sweat tests. Am J Clin Pathol 1979;72(2):142–145.
24.Hammond KB, Turcios NL, Gibson LE. Clinical evaluation of the macroduct sweat collection system and conductivity analyzer in the diagnosis of cystic fibrosis. J Pediatr 1994; 124(2): 255–260.
25.Lezana JL, Vargas MH, Karam-Bechara J, Aldana RS, Furuya ME. Sweat conductivity and chloride titration for cystic fibrosis diagnosis in 3834 subjects. J Cyst Fibros 2003;2(1): 1–7.
26.Barben J, Ammann RA, Metlagel A, Schoeni MH. Conductivity determined by a new sweat analyzer compared with chloride concentrations for the diagnosis of cystic fibrosis. J Pediatr 2005;146(2):183–188.
27.Naruse S, Ishiguro H, Suzuki Y, Fujiki K, Ko SB, Mizuno N, Takemura T, Yamamoto A, Yoshikawa T, Jin C, Suzuki R, Kitagawa M, Tsuda T, Kondo T, Hayakawa T. A finger sweat chloride test for the detection of a high-risk group of chronic pancreatitis. Pancreas 2004;28(3):e80–e85.
Further Reading
Warwick WJ. Cystic fibrosis sweat test for newborns. JAMA 1966 Oct 3; 198(1):177–180.
Warwick WJ, Hansen LG. Measurement of chloride in sweat by use of a selective electrode and strip-chart recorder. Clin Chem 1978;24(2):381–382.
Warwick WJ, Hansen L, Viela I, Matheson J. Comparison of the chloride electrode and gravimetric chloride titration sweat tests. Am J Clin Pathol 1979;72(2):142–145.
Warwick WJ, Viela I, Hansen LG. Comparison of the errors due to the use of gauze and the use of filter paper in the gravimetric chloride titration sweat test. Am J Clin Pathol 1979;72(2):211– 215.
Denning CR, Huang NN, Cuasay LR, Shwachman H, Tocci P, Warwick WJ, Gibson LE. Cooperative study comparing three methods of performing sweat tests to diagnose cystic fibrosis. Pediatrics 1980;66(5):752–757.
Warwick WJ, Huang NN, Waring WW, Cherian AG, Brown I, Stejskal-Lorenz E, Yeung WH, Duhon G, Hill JG, Strominger D. Evaluation of a cystic fibrosis screening system incorporating a miniature sweat stimulator and disposable chloride sensor. Clin Chem 1986;32(5):850–853.
Warwick WJ, Hansen LG, Werness ME. Quantification of chloride in sweat with the Cystic Fibrosis Indicator System. Clin Chem 1990;36(1):96–98.
Warwick WJ, Hansen LG, Brown I. Improved correlation of sweat chloride quantification by the CF Indicator System and the Gibson-Cooke Sweat Test. Clin Chem 1993;39(8):1748.
Warwick WJ, Hansen LG, Brown IV, Laine WC, Hansen KL. Sweat chloride: quantitative patch for collection and measurement. Clin Lab Sci 2001;14(3):155–159.
See also BIOHEAT TRANSFER; FLAME ATOMIC EMISSION SPECTROMETRY AND ATOMIC ABSORPTION SPECTROMETRY.
CYTOLOGY, AUTOMATED
HARRY W. TYRER
University of Missouri-Columbia
Columbia, Missouri
INTRODUCTION
Cytology is the scientific study of cells, which includes their origin, structure, and function. Automated cytology arose from the important medical problem of classifying and enumerating cell types using instrumented means primarily for speed improvements. Automated cytology has also contributed to elucidating cell origin, structure, and function. It provides quantitative methodology directed to establishing relationships between variables to predict cellular behavior.
Understanding automated cytology requires knowledge of cells, the fundamentals of measurements on cells, and subsequent processing of these data. Present and future applications in automated cytology justify the value of automated cytology as well as define its usefulness and promise.
Cytology (Greek: kytos, hollow vessel; logos, word, reason) as a discipline primarily focuses on cell structure. Cell structure deals with those factors that define the shape and spatial distribution of the components within a cell. It is synonymous with cell morphology, which historically has been the primary method to describe cells. More generally, cytology must also encompass cellular function, which describes a cell’s operational characteristics. For example, a red blood cell is a bag of hemoglobin that carries oxygen to all parts of the body, a lymphocyte produces antibodies as a result of stimulation, and squamous cells, which are on the
surface of the skin, become leathery to protect the exposed skin from mechanical assault.
Automated cytology is an area of multidisciplinary specialization initially oriented toward the automated identification and classification of cells. The resulting measurement and computational methodologies provide a database from which relationships between the variables measured can be expressed. These relationships harbor the promise of establishing predictive relationships so that future structural and functional cellular characteristics can be determined. By extension then, the behavior of organs and organisms can then be determined.
CELLS
If we examine unstained cells with a microscope it is apparent that the cell is encased in a membrane. Within that membrane is a second structure encased within its own membrane. Thus the cell is subdivided into the nucleus and the cytoplasm. The nucleus is the control center and the cytoplasm carries out the function to which the cell differentiated. The work described here deals with nucleated or eukaryotic cells; incidentally cells without nuclei are called prokaryotic.
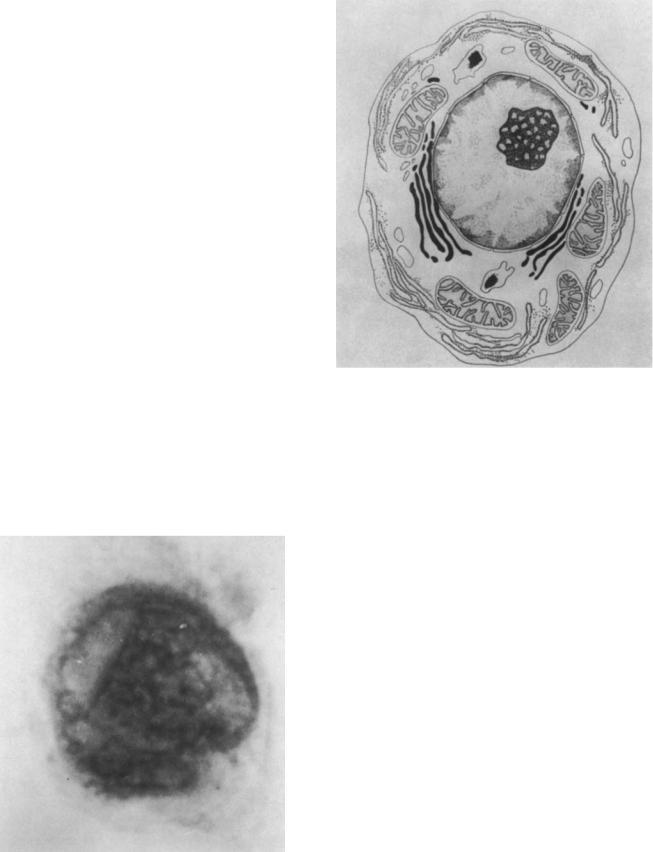
We now add a nucleophylic dye, such as hematoxylin, which binds preferentially to the nucleus. The nucleus is selectively stained and becomes much more apparent than the cytoplasm (Fig. 1). Note that both the nucleus and cytoplasm show spatial variation in light intensity. The cause of these variations can be analyzed by increasing resolution, which may include the use of electron microscopy. As we increase our ability to see into the cell either by optical or electron microscopy, we identify inclusions
Figure 1. A cell, the lighter outside area of which is the cytoplasm and the darker of which is the nucleus.
CYTOLOGY, AUTOMATED |
389 |
Figure 2. Drawing of a cell showing cytoplasmic and nuclear organelles. Cytoplasm: Drawing an imaginary line starting at 4 and ending at 10 o’clock, one traverses the following: cytoplasmic membrane, a granulated endoplasmic reticulum body, a single mitochondrion, a set of Golgi bodies, the nuclear membrane, and finally the nucleus. Continuing on simply reverses the order. Nucleus: On a line from 1 to 7 o’clock, one begins at the nuclear membrane to identify the nuclear elements: the nuclear membrane (note the infoldings at irregular intervals), the inner membrane, chromatin structure, nucleolus, the center of the nucleus, and finally the inner nuclear membrane.
within the cells, which are called organelles. From Fig. 2, we consider some well-defined organelles.
The nucleus, usually the largest organelle, consists almost entirely of nucleic acids. Both deoxyribonucleic (DNA) and ribonucleic acid (RNA) are present. By far, the major constituent is DNA. Within the nucleus and under appropriate conditions DNA molecules replicate giving rise to DNA synthesis and then to cell division. An organelle within the nucleus is the nucleolus. In Fig. 2, it is the darkened mottled body encased in the nucleus. It consists mostly of RNA. In the initial steps of transcription to make protein, DNA produces messenger RNA (mRNA) according to the genetic code. The mRNA then passes through the nuclear envelope into the cell cytoplasm.
The cytoplasm is the entity that performs the cell’s function. These functions are carried out by several organelles. The same organelle of different cells may be substantially different so that the cell may focus its energy to carry out its usually single function.
The mytochondrion (in Fig. 2, the ovoid body with the complex curved inclusions) is an organelle that is responsible for producing the energy required by the cell. It has its own DNA and is able to replicate itself within the cell.
390 CYTOLOGY, AUTOMATED
The Golgi body complex (the long dark strands) provides temporary storage of secretory substances and connects to the endoplasmic reticulum.
The endoplasmic reticulum (light strand) is of two types in the same cell: with granules (the dots) and without granules. The granules are ribosomes. In the final stages of transcription (making protein from DNA), the mRNA travels from the nucleus to the ribosomes (probably in the endoplasmic reticulum) and attaches to the ribosome. The ribosome then binds the transfer RNA (tRNA) corresponding to the genetic code expressed in the mRNA. Each value of the genetic code has one tRNA, which in turn corresponds to one amino acid. One ribosome houses two tRNAs that connect the proper amino acids together to the protein chains. The resulting protein (called a polypeptide) passes through the Golgi complex to be secreted from the cell. Thus the function of a particular cell is to produce a particular protein. Additionally, binding a signal protein will alter the state of the cell, causing it to produce a different protein or to divide and function in a different manner.
As just shown, we can identify cell structure by binding chemicals to the structure to allow its observation. On the other hand, cellular products are determined by several methods. First, one can selectively poison a particular functional entity and compare the results that are produced from nondestroyed entities. Second, one can separate the entities and selectively return them until the tested functionality has been restored. These techniques are routinely performed on samples containing many cells. Unfortunately, the average population behavior masks the individual cell behavior, which may be of interest as a rare event.
Consequently, automated cytology has evolved to enumerate and provide quantitative information on the structural features as well as the functional capabilities of a single cell. Work is done on an intact single cell, which may be viable or nonviable. Viable means that the cell is able to perform its functional activities, whereas a nonviable cell cannot. A nonviable cell is preserved in an appropriate fixative. Such a fixed cell can withstand many of the rigors of experimental treatment compared to a viable cell. Unfortunately, fixation may alter properties that are to be measured. Thus, choice of fixation (including no fixation) requires careful consideration.
CYTOCHEMICAL PROBES
Cytochemistry is the chemical organization and activity of a cell. Numerous chemical probes have been reported for use in determining cell structure and function. The probe binds to the molecule to be detected. If a stochiometric relationship between the probe and detected molecule is maintained (i.e., conditions for binding are fixed so that the relationship between the amount of probe and detected molecule are fixed), then relative quantities of the detected molecule can be obtained. Furthermore, if the amount of detected molecule to quantity of probe molecule can be established, absolute standardization is achieved.
Biochemical probes are used in automated cytology to detect a wide range of structural and functional characteristics of cells. For example, let us consider the steps
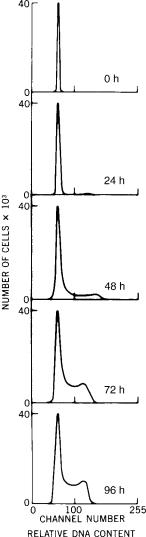
involved in measuring DNA in single cells. Specifically we want to see the activation of DNA synthesis over several days. White blood cells withdrawn from fresh human blood, can be stimulated to replicate by placement in an appropriate tissue culture system. We can remove several cells from the tissue culture system every 24 h, and determine the relative amount of DNA in each cell. A cytochemical probe specific for DNA is propidium iodide (PI), which fluoresces in the red when excited by a 488-nm (blue) light. The fluorescence intensity of each cell is proportional to the amount of PI bound to the DNA, assuming care has been taken to minimize non-DNA binding of PI. From this, we form a histogram of the fluorescence intensity of the cells; that is, we plot for each value of fluorescence the number of cells (frequency) expressing that fluorescence value. The series of histograms in Fig. 3 shows that at first there is a
Figure 3. Each of the graphs displays the DNA distribution of cells in tissue culture. Cells were removed from culture and analyzed every 24 h. The top chart displays the DNA distribution of cells initially placed in culture. The succeeding charts show increasing numbers of cells with increasing amounts of DNA over the 4-day intervals sampled.

CYTOLOGY, AUTOMATED |
391 |
Figure 4. Cell cycle diagram and the corresponding graph of DNA quantity versus time. The Parameter G1 is gap 1, a resting state; S is when the cell synthesizes DNA; G2, gap 2, another resting state; and M is mitosis in which the cell divides.
single population of cells in the blood with a remarkably narrow range of DNA value. Within 24 h there is a barely visible set of cells with twice the normal amount of DNA; by 48 h and beyond, it is apparent that there are also cells with values intermediate to the two values. These distributions demonstrate DNA synthesis and cellular replication.
It is commonly known that cells replicate by dividing, creating daughter cells. In the process of division, from some resting state, the cell synthesizes DNA until two times the normal amount of DNA is present. At this point, the two nuclei are formed and the cell subsequently divides into two presumably identical parts. Figure 4 graphically illustrates the cycling of the cells. At the portion of the circle labeled G1 (resting state, Gap 1), a cell has two times the DNA shown in the lower part of Fig. 4. (Since cell DNA quantity is variable between species, we list the amount of DNA as X; furthermore, egg and sperm have 1X DNA, but most mature cells in the body normally have 2X DNA.) As time increases, the cell goes into the S phase of the cycle
Table 1. Biochemical Probes with DNA Specificity
where it synthesizes DNA. Finally, the cell has 4X DNA and waits some amount of time at G2 (Gap 2) until it divides. The cell divides (M, mitosis), generating two daughter cells in the G1 phase of the cycle.
These observations are based on total DNA of each cell. Had we also observed a cell in mitosis, under proper microscope and staining conditions, we would have observed the nucleolus condensing into well-defined bodies called chromosomes. Preparation of chromosomes is made from cells undergoing division. Such preparations are used to study genetic observations.
The same cytochemical principles are used to classify human chromosomes. DNA consists of chains of adenosine— thiamine (AT) or guanine—cytosine (GC) base pairs. A strategy to increase the information content in measuring the DNA of chromosomes is to use two dyes simultaneously; one with selective affinity to the AT bases the other with affinity to GC bases. Under proper excitation, each chromosome will produce a fluorescence intensity value from each of the two dyes. These two intensities are each proportional to the number of AT or GC bases of each chromosome. Histograms of these two parameters are two dimensional, and each point in the histogram is the number of chromosomes (or particles) with the same pair of fluorescence intensity values. For example, Chromomycin A3 (CA3) has an affinity for AT bases, whereas Hoechst bis-benzimidizole 33258 binds preferentially to GC bases. The increased information provided by the use of the second fluorescent stain increased the resolution for separating the 23 human chromosomes compared to each stain alone.
We have used DNA quantity as an example of the use of cytochemical probes. There are a large number of DNA probes in current use as shown in Table 1. The bibliography can be consulted for additional information on their properties and use.
Cytochemical probes are, of course, useful for detection and quantization of other cellular structures and functions. Table 2 displays a representative set of such probes.
|
|
|
Spectrum Maximum, nm |
|
||
Probea |
|
|
|
|
|
Extinction Coefficient, wavelength, pHb |
Base-Pair Enhancement |
Excitation |
Fluorescence |
||||
|
|
|
|
|
|
|
Acridine Orange |
None |
490 |
530 |
|
50 (492, 7) |
|
Ethidium bromide |
None |
546 |
610 |
|
517 (480, 7) |
|
33258 |
AT |
365 |
450 |
|
4 (338, 7) |
|
Daunomycin |
AT |
500 |
600 |
|
14.8 (480, 7) |
|
EK-4 |
AT |
530 |
560 |
|
36 (570, 7) |
|
LL-585 |
AT |
500 |
600 |
|
32 (510, 7) |
|
Proflavin |
AT |
460 |
|
|
34.9 (454, 7) |
|
Quinacrine |
AT |
436 |
525 |
|
8.9 (424, 7) |
|
VL-772 |
AT |
500 |
600 |
|
32 (510, 7) |
|
7-AAD |
GC |
546 |
610 |
|
21.5 (502, 7) |
|
Chromomycin A3 |
GC |
440 |
585 |
|
8 (490, 7) |
|
aAbbreviations: 33258 ¼ Hoechst bis(benzimidizole) No. 33258; 7-AAD ¼ 7-aminoactinomycin D; A ¼ adenine; C ¼ cytosine; EK-4 ¼ 26-diphenyl-4-(4- dimethylaminophenyl) pyriliumbisulfate; G ¼ guanine; LL-585 ¼ 6-benzothiazolyl-3-ethyl-2-(dimethylamino-stytyl)-benzothiazolium,-p-toluenesulfonate; T ¼ thymine (T); VL-772 ¼ 6-(dimethylamino)-2-[2,5-dimethyl-1-pheny-1H-pyrrol-3-yl ethenyll]-1-methyl-quinolinium methosulfate.
bExtinction coefficient 10 3/(M cm); in parentheses are the values of measurement wavelength (in nanometers) and the pH, respectively.

392 CYTOLOGY, AUTOMATED
Table 2. Fluorescent Probes to Assay Cell Structure and Function
Cell structure |
Probe |
RNA content |
Acridine Orange, pyronin |
Total protein |
Fluorescein isothyocyanate |
Cell cytoskeleton |
NBD-phallacidin |
Cell mitochondria |
Fluorescent tetracyclenes |
Cell function |
|
Membrane permeability |
Fluorescein diacetate, propidium |
(cell viability) |
iodide, 33342a |
Membrane potential |
3,30 -Dihexyloxacarbocyanine |
(cytoplasm and |
|
mitochondria) |
|
Calcium (Ca2þ) |
|
Membrane bound |
Chlortetracycline |
Cytoplasmic |
Quin-2 |
Enzyme activity |
Fluorescein derivatives, |
|
methylumbelliferyll derivative, |
|
napthol derivatives |
Intracellular pH |
1,4-Diacetoxy-2,3-dicyanobsenzene, |
|
carboxyfluorescein |
Phagocytosis |
Fluorescent beads, fluorescent-stained |
|
bacteria and other particles |
aHoechst bis(benzimidizole) No. 33342.
Finally, the biochemical constituents of the cells have physical properties that are directly measurable. A wellknown example is the pigment that makes blood cells red, hemoglobin. Furthermore, it is well known that the important metabolic constituent reduced nicotinemide adenine dinucleotide (NADH) fluoresces as does riboflavin, one of the 13 vitamins. These compounds have optical properties that are useful because of the convenience of use with existing equipment. This is not true of the majority of cell constituents whose physical properties may not be easily detected or measured. For example, proteins with aromatic amino acids, such as tryptophan, will fluoresce when excited by 257 nm light. Such a short wavelength is not conveniently handled because its propagation attenuation in standard optical materials is so severe.
MEASUREMENT OF CELLULAR PARAMETERS
Automated cytology implies that cellular parameters are to be measured. Since the visual quasiquantitative analyses described in the previous section cannot provide the accuracy and discrimination required, technologies have arisen that measure physical phenomena to describe cellular parameters. Commercially available instrumentation use optical or electrical phenomena whereas experimental devices have been used with acoustic, magnetic, and a variety of spectroscopic techniques.
Probes for nucleic acids abound. The probe binding mechanics to the nucleic greatly influences their use and application. Table 3 shows a list of such probes along with their excitation and emission wavelengths.
Protein probes tend to be nonspecific and usually stick to the protein. The stain can be removed by (sometimes) vigorous rinsing. Table 4 shows the excitation and emission
Table 3. Fluorescent Probes for Nucleic Acids with Excitation and Emission Wavelengths in nm
Probea |
Excitation |
Emission |
|
|
|
Hoechst 33342 (AT rich) (UV) |
346 |
460 |
DAPI (UV) |
359 |
461 |
POPO-1 |
434 |
456 |
YOYO-1 |
491 |
509 |
Acridine Orange (AO) (RNA) |
460 |
650 |
Acridine Orange (DNA) |
502 |
536 |
Thiazole Orange (vis) |
509 |
525 |
TOTO-1 |
514 |
533 |
Ethidium Bromide |
526 |
604 |
PI (UV/VIS) |
536 |
620 |
7-Aminoactinomycin D (7AAD) |
555 |
655 |
aAbbreviations: DAPI ¼ 40 ,6-diamidino-2-phenylindole; POPO-1, YOYO- 1,TOTO-1 are cyanine dimers available from Molecular Probes, Inc.; PI: Propidium Iodide; UV ¼ ultraviolet, vis ¼ visible.
wavelengths of various probes used for proteins. The probes are also bound to specific antibodies so that multi wavelength emission due to multiple antibody binding provides a multiparametric analysis. Common pairs are flouresceim isothyocianate (FITC) and Rhodamine (see Tables 4 and 13).
There are a variety of probes of importance to identifying cell parameters. These require care in their use. The following three tables (Tables 5–7) list such probes along with their excitation and fluorescent emission wavelengths. Ion probes are listed in Table 5, pH sensitive indicators appear in Table 6, and probes for oxidation states along with the oxidant appear in Table 7.
Finally, just as there is a dichromatic display for RNA and DNA with acridine orange, where AO can be seen to bind to nucleolus as a red fluorescence and to the nucleus as green fluorescence, so several probes have an affinity for specific organelles. Specifically, the Golgi bodies and mitochondria can be identified with the appropriate stain as Table 8 shows. Finally, the lipid stains help to identify the cell’s membrane and other lipids.
Optical Measurements
By far, most measurements on cells are optical. Spectra obtained from a multiplicity of physical properties are
Table 4. Fluorescent Probes for Proteins with Excitation and Emission Wavelengths in nm
Probea |
Excitation |
Emission |
|
|
|
FITC |
488 |
525 |
PE |
488 |
575 |
APC |
630 |
650 |
PerCP |
488 |
680 |
Cascade Blue |
360 |
450 |
Coumerin-phalloidin |
350 |
450 |
Texas Red |
610 |
630 |
Tetramethylrhodamine-amines |
550 |
575 |
CY3 (indotrimethinecyanines) |
540 |
575 |
CY5 (indopentamethinecyanines) |
640 |
670 |
aAbbreviations: PE ¼ Phycoerythrin; APC ¼ allophycocyanin; PerCP ¼ peridinin chlorophyll.

Table 5. Fluorescent Probes for Ions with Excitation and Emission Wavelengths in nm
Probea |
Excitation |
Emission |
|
|
|
INDO-1 |
350 |
405/480 |
QUIN-2 |
350 |
490 |
Fluo-3 |
488 |
525 |
Fura-2 |
330/360 |
510 |
aINDO-1 ¼ 1H-Indole-6-carboxylic acid, 2-[4-[bis[2-[(acetyloxy)methoxy]-2- oxoethyl]amino]-3-[2-[2-[bis[2- [(acetyloxy)methoxy]-2-oxoetyl]amino]-5- methylphenoxy]ethoxy]phenyl]-, (acetyloxy)methyl ester [C47H51N3O22], FLUO-3 ¼ Glycine, N-[4-[6-[(acetyloxy)methoxy]-2,7- dichloro-3-oxo-3H- xanthen-9-yl]-2-[2-[2- [bis[2-[(acetyloxy)methoxy]-2- oxyethyl]amino]-5- methylphenoxy]ethoxy]phenyl]-N-[2- [(acetyloxy)methoxy]-2-oxyethyl]-, (acetyloxy)methyl ester.
useful in identifying and quantitating cellular biochemical and physical parameters. The most popular optical measurements, namely, light scatter, absorption spectroscopy, and fluorescence spectroscopy, and their use in automated cytology are discussed.
Light Scattering. Light scattering from a single cell has been used to characterize cell volume, shape, internal structures, and other cell properties that produce changes in index of refraction. Light scattering includes diffraction, refraction, and reflection of light from a single cell. From Maxwell’s equations, a series expression was developed by Mie for plane wave propagation perturbed by a solid nonconductive homogeneous sphere with a diameter on the order of the wavelength of illuminating light. Although some cells are spherical and their diameter approximates the wavelength of visible light, cells are not homogeneous. In fact, it may be their optically heterogeneous structures that are important and, therefore, cannot be neglected. There is a large body of literature devoted to light scattering and some of it is directed to the problem of aerosol detection.
Measurements have established the relationship between the amount of light scattered and the size of the cell. For small-angle scattering (< 28 numerical aperture), the signal intensity is proportional to the diameter cubed (in agreement with the Mie solutions). This proportionality is linear and monotonically increasing over a restricted size range. As the numerical aperture increases the relationship is no longer linear and is not monotonic over the entire possible range of sizes. Cell shape also influences scattering. Since most cells are not spherical,
Table 6. Fluorescent pH Sensitive Indicators with Excitation and Emission Wavelengths in nm
Probea |
Excitation |
Emission |
|
|
|
SNARF-1 |
488 |
575 |
BCECF |
488 |
525/620 |
BCECF |
440/488 |
525 |
aSNARF-1 ¼ Benzenedicarboxylic acid, 2(or 4)-[10-(dimethylamino)-3-oxo- 3H- benzo[c]xanthene-7-yl]-, BCECF ¼ Spiro(isobenzofuran-1(3H),90 -(9H) xanthene)-20 ,70 -dipropanoic acid, ar-carboxy-30 ,60 -dihydroxy-3-oxo-.
CYTOLOGY, AUTOMATED |
393 |
Table 7. Fluorescent Probes for Oxidation States with Excitation and Emission Wavelengths in nm
Probea |
Oxidant |
Excitation |
Emission |
|
|
|
|
DCFH-DA |
(H2O2) |
488 |
525 |
HE |
(O2 ) |
488 |
590 |
DHR 123 |
(H2O2) |
488 |
525 |
aDCFH-DA ¼ dichlorofluorescin diacetate, HE ¼ - hydroethidine 3,8-Phe- nanthridinediamine, 5-ethyl-5,6-dihydro-6-phenyl-, DHR-
123 ¼ dihydrorhodamine 123 Benzoic acid, 2-(3,6-diamino-9H-xanthene-9-yl)-, methyl ester.
the relative orientation of the cell to the source and detector can produce different scatter fields. Furthermore as the numerical aperture of detection increases the internal structure is increasingly detected. On some instrumentation, simultaneous detection of 0 and 908 scattering is used to discriminate cells based on internal structures. Light scattering under a highly coherent light source, such as a laser, is a very sensitive indicator of variations of index of refraction. Under normal conditions the cell is encapsulated in some medium and the index of refraction between air and the cellular medium contribute to the entire signal. Furthermore, under abnormal conditions, local differences in index of refraction, as a result of improper fluid mixing, contribute signals that approximate those produced by a cell.
Measurements of light scattering from particle suspensions provide a single datum from which estimates of total particles are obtained. Such measurements produce a signal that is dependent on the number, size, and shape of the suspended particles. Systems measuring either scattering or absorption of suspensions cannot provide discriminatory information for individual particles.
Optical Spectroscopy. When energy interacts with matter, a sequence of events occurs that is explained in terms of the atomic or molecular behavior. This interaction provides quantitative information as well as identification of the species involved. The well-known proportionality of energy E to electromagnetic frequency v is related by Planck’s constant (h), which underscores the discrete nature of
Table 8. Fluorescent Probes for Organelle with Excitation and Emission Wavelengths in nm
Probea |
Organelle |
Excitation |
Emission |
|
|
|
|
BODIPY |
Golgi |
505 |
511 |
NBD |
Golgi |
488 |
525 |
DPH |
Lipid |
350 |
420 |
TMA-DPH |
Lipid |
350 |
420 |
Rhodamine 123 |
Mitochondria |
488 |
525 |
DiO |
Lipid |
488 |
500 |
diI-Cn-(5) |
Lipid |
550 |
565 |
diO-Cn-(3) |
Lipid |
488 |
500 |
aBODIPY ¼ borate-dipyrromethene complexes; NBD ¼ nitrobenzoxadiazoxadiazole; DPH ¼ diphenylhexatriene; TMA ¼ trimethylammonium; DiO ¼ diI-Cn-(5);diO-Cn-(3) ¼ Carbocyanines (DiI, DiA, DiO), e.g., DiI 1,10 - dioctadecyl-3,3,30 ,30 -tetramethylindocarbocyanine perchlorate.

394 |
CYTOLOGY, AUTOMATED |
|
atomic behavior: |
|
|
|
h ¼ 6:6 10 34 J s |
|
|
E ¼ hv |
ð1Þ |
For example, gas discharge tubes supply energy by means of a high voltage between electrodes onto a sealed container with small amounts of gas. The resulting arc has an emission spectrum consisting of lines of light energy at discrete wavelengths that are characteristic of the electronic structure of that gas. The first correct explanation of this phenomenon arose from the Bohr model of the hydrogen atom. The calculated values of energy from the various discrete orbits that the electron could have about the nucleus correspond to the spectral lines obtained from the gas discharge series.
This characteristic spectrum can be used to identify and quantitate the amount of element or compound. The interaction of the constituent atoms of a molecule produces a spectrum that is substantially different from that of each atom. The spectrum is characteristic of the molecule.
The response of the material to light excitation may by considered to occur in two general steps (Fig. 5). In a molecule excited by light, an electron is elevated in energy to an excited state: This results in light absorption. The relaxation of this excited electron back to a lower energy state may result in (1) light being emitted (fluorescence and phosphorescence), (2) heating of the substance, or (3) some combination of the two. The light is not only absorbed but may be scattered (Rayleigh scattering) or be modulated to a different wavelength by the rotational and vibrational motion of the illuminated molecules (Raman scattering).
The emitted light frequency is different from the absorbed frequency n1, except for Rayleigh scattering. In Raman scattering, it is possible for the emitted frequency to exceed the exciting (or absorbed) frequency. In the case of fluorescence or phosphorescence, the loss of energy in the molecule (due to collisions or vibration) results in a lower frequency of emission compared to the excitation (absorbed) frequency. Similarly, because of energy decrease, phosphorescence frequency is less than fluorescence frequency. For the remainder of this article we will no longer deal with frequency of light, but with the more commonly used parameter, wavelength.
Absorption is obtained from the loss of light in a material at a particular wavelength. A homogenous material is irradiated by light of intensity Ir (r, reference). As a result of transmission through the material there is a loss of light resulting in light intensity Is (s, sample) emanating from the material (see Fig. 6). The optical density or absorbance can be defined from these two quantities, which is
log10ðIr=IsÞ ¼ A |
ð2Þ |
The absorbance A (for this discussion, always an upper case A) is directly related to the light path thickness d, the concentration of the material C, and by the proportionality constant e called the extinction coefficient, which is a property of the material. The resulting equality is the Beer–Lambert law, which may be expressed as
A ¼ edC |
ð3Þ |
The self-absorption of the sample material reduces the sensitivity to values 0.1 < A < 1.2. Thus the material is suspended in nonabsorbing solution to disperse it to satisfy the homogeneity assumption. In practice, the
Figure 5. An energy diagram of light absorption by an atom. Light (energy) is provided into the system and is absorbed. It is then scattered (Rayleigh or Raman), dissipated in the system, or emitted by fluorescence or phosphorescence (h, Plank’s constant; v, frequency of light).
concentration of the material in solution can be obtained by using a known concentration of the sample (standard) and determining the ratio of absorbance of the unknown to the standard:
Aunknown |
¼ |
Cunknown |
ð4Þ |
|
Astandard |
|
Cstandard |
||
For species differentiation, a spectrum is usually sufficient to uniquely identify that species.
It is useful to define the quantity ‘‘transmissivity’’ t, which is
t ¼ Is=Ir |
ð5Þ |
In practice, the input intensity Ir is fixed and the sample modulates Is. So, if the sample does not absorb light, t ¼ 1, and if the sample completely blocks out the light, t ¼ 0. Thus, it is convenient to speak of the transmission T, which is a percentage, as
T ¼ 100t |
ð6Þ |
The entire range of intensities is mapped between 0 and 100%.
A homogeneous mixture of particles and solutions can be expected to arise in conditions in which the measured geometries are very large compared to the absorbing particle size. In the microscopic environment, particle sizes are in the order of the measurement geometries, invalidating the homogeneous sample assumption. This is referred to as the distributional error.
The distributional error can be analyzed using Fig. 6 as follows: We wish to determine the true value of absorbance of the sample in solution. Assume that only the light passing through the area [aT ¼ (l1 þ l2)W] under consideration reaches a detector. Let us begin by assuming that the
Figure 6. A uniform beam of light passing through a nonhomgeneous medium in a clear container. A material with extinction coefficient e is suspended in a nonabsorbing medium. The material is uniformly distributed in the lower part of the container so it absorbs light by an amount A2 ¼ dC2 over the surface l2W. A different amount of the material is also uniformly distributed over the upper part of the container, absorbing light in the amount A1 ¼ dC1 over l1W.
CYTOLOGY, AUTOMATED |
395 |
entire mass mT is distributed throughout the total volume (daT). Express Eq. 3 as
AT ¼ ed mT dWl
Now, if we assume, as shown in Fig. 6, an amount m2 constitutes most of the absorbing material in the lower part of the volume and a different amount m1 is in the upper part, we can substitute and cancel to get
m1 þ m2
aT
Now, we observe that the dry mass of the dissolved material is determined by m ¼ (A/)a; that is, the viewing area a determines the measured dry mass, so that with further substitution and cancelation,
1
AT ¼ aT ðA1a1 þ A2a2Þ
We can generalize: First, our derivation deals only with areas so that any arbitrary area could be used; second, we can expand the preceding equation to get
1 |
X |
|
|
AT ¼ |
|
Aiai |
ð7Þ |
aT |
|||
|
|
all i |
|
Thus, the solution to the distributional error problem in quantitative microscopy is to measure the absorption over a small area and sum each measurement so that the entire object is covered. It is assumed that each area is so small that it is homogeneous. Thus, the absorption of a cell at a given wavelength is obtained by measuring the absorbance of contiguous areas over the boundaries of the cell.
Finally, we observe that had we summed the individual transmittances (see Eq. 2), a different and incorrect value would have been obtained. Summing the absorbencies is based on the conservation of mass: total absorbance depends on total mass regardless of its distribution.
Fluorescence properties, wavelength, and intensity also provide information on molecular species and concentration, respectively. The fluorescence intensity F is proportional to the absorbed light intensity, Ia (a, absorbed), which is the difference between incident Ir and exiting Is light intensity. The constant of proportionality q is related to the efficiency of the conversion of absorbed energy to emitted energy and is called the quantum efficiency,
q ¼ number of quanta emitted number of quanta absorbed
So that we get
F ¼ Iaq
Now inserting Eq. (3) into Eq. (2) and solving for Is, we get
Is ¼ Ir 10 e dC
so that
F ¼ qIrð1 10 edCÞ |
ð8Þ |
396 CYTOLOGY, AUTOMATED
Again we have a parameter of material property and quantity relating to a measurable optical parameter. This relation using the McLaurin expansion, can be linearized by which assumes that A < 0.05 (e.g., small values of absorption). Now we can write
F ¼ qIrð2:3 e dCÞ |
ð9Þ |
Again, if we have a standard and an unknown sample, the following relation holds, since we now assume that fluorescence is linearly related to concentration
Funknown ¼ Cunknown
Fstandard Cstandard
where both values of F are measured, and Cstandard is determined by the experimenter.
We have covered the fundamental issues of absorption and fluorescence spectroscopy directed to identifying and quantifying various molecular species. There are numerous other optical techniques that use biochemical probes to provide mechanistic information of cellular function. We will discuss only two: fluorescence polarization and resonance energy transfer.
Fluorescence polarization has been used to assess molecular motion with respect to the cell to which the molecule is bound. In general, the exciting light is polarized in a given direction and the absorbing probe is polarized in some other direction making an angle f. The probability of absorption is proportional to the cos2 f, so that maximum absorption occurs in those probes parallel to the exciting light. The fluorescence emission is detected in two directions, parallel and perpendicular to the excitation source. These intensities can be used to form the quantity called emission anisotropy R,
R ¼ Ik I?
Ik þ 2I?
We introduce the notion of an absorption and emission vector, each an independent directed quantity in space. In a rigid system, it can be surmized that the relative motion between the absorption and the emission vector is very small. However, in nonrigid systems there is motion between the absorption and emission vectors within the lifetime of the fluorescence emission. Thus, material probe motion occurring within the fluorescence lifetime is detected as an anisotropic increase in fluorescence.
Resonance energy transfer is used to assess the so-called nearest-neighbor distance. Energy transfer occurs between two resonating probes, that is, a donor transfers energy to an acceptor probe by nonradiative energy transfer. The prime condition is that there be a reasonable overlap between the donor emission spectrum and the acceptor absorption spectra. Obviously, quantum yields and donor– acceptor orientations must be satisfactory. This technique is used to determine the separation of the donor and acceptor probes. A critical parameter is R0, which is defined as the distance for 50% energy transfer. Table 9 shows various acceptor and donor combinations and their respective values of R0 that have been reported in the literature (4–7).
Table 9. Energy-Transfer Combinationsa
Donor |
Acceptor |
Separationb |
|
|
|
Fluorescein |
Rhodamine |
5.6 |
isothyocyanate |
isothiocyanate |
|
Quinacrine |
Ethidium bromide |
2.2 |
Quinacrine |
7-Aminoactinomycin |
3.0 |
33258c |
Ethidium bromide |
3.1 |
33258c |
Daunomycin |
4.0 |
33258c |
Chromomycin A3 |
8.3 |
Chromomycin A3 |
Ethidium bromide |
2.0 |
aFor more information, see Refs. 4–7.
bValue of R0 for 50% energy transfer in nanometers. cHoechst bis(benzimidizole) No. 33258.
Electrical Resistance
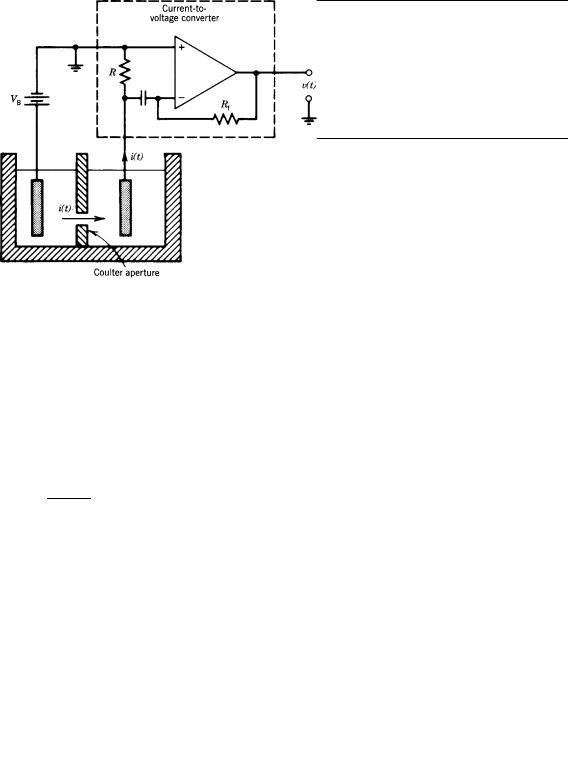
The Coulter effect is the name given to the phenomenon (Fig. 7) whereby current through a small aperture in an aqueous conducting medium is modulated by the passage of particles through it. This was first used to develop cell counters; later, it was observed that the change in resistance was related to cell volume. The large amount of data produced by the many blood cells is easily reduced if one uses a histogram of cell size, similar to those discussed previously. The substantially increased number of cells improved the counting statistics. This along with the improved speed measurements made such blood cell counting and sizing instrumentation the methodologies of choice.
Figure 7. Coulter principle. A conducting physiologic fluid supports the current i(t), resulting from the potential difference VB in the immersed conducting plates. A particle passing through the Coulter aperture interrupts i(t) by an amount depending on the relative size of the particle the feedback resistor Rf and the input resistor R convert the current i(t) to the output voltage waveform v(t). Processing of i(t) provides data for counting and sizing particles.

Other Measurements
Various physical measurements have been (or should be) adapted for use in automated cytology. These include mechanical techniques such as acoustics, electromagnetic techniques (e.g., nuclear magnetic resonance, NMR), and other spectroscopic techniques. Acoustic microscopes have been constructed that are used for identifying cellular microstructure. On the other hand, NMR has been used to identify metabolic constituents in cells. Raman spectroscopy has been suggested to be useful for identifying chemical constituents in intact cells if the signal-to-noise ratio problems can be overcome. Finally, optical rotatory dispersion and circular dichroism have been used to study nucleic acids. Table 10 summarizes the measurement systems in common use and the cell features they measure.
Devices used in Automated Cytology for Cell Measurement and Isolation
Automated cytology makes use of instrumentation for cell analysis and for cell isolation. Cell analysis instrumentation is classified further into three types according to the information content obtained from the cell: (1) zeroresolution instrumentation, which generates a single datum for each parameter from a cell; (2) high resolution instrumentation, which generates a very large number of data from a single parameter measured from a cell; and (3) low resolution instrumentation, which obtains more information than zero-resolution devices from each cell as a result of a slight increase in resolution.
Instrumentation for isolation is of two general types. The first type is physical placement of the cell in a desired location in space. The second type identifies and localizes the cell with respect to some origin on a fixed medium such
Table 10. Correlation of Selected Cell Measurements and
Features
Measurement |
Feature |
|
|
Resistance (Coulter) |
Cell volume |
orifice |
|
Light scattering |
|
Low angle (2–208) |
Size and shape |
Large angle (to 908) |
Size, shape, internal structure, |
|
and viability |
Polarized |
Macromolecular conformation |
Acoustic energy |
Cell compressibility and |
|
deformation |
Pulse shape analysis |
|
Slit scan |
Particle shape information; |
|
distribution of stain within the cell |
Time of flight |
Double-cell detection; particle shape |
|
information; particle diameter; |
|
resolution of cell structure |
Time |
Kinetics |
Fluorescence intensity |
Amount of fluoregen |
Fluorescence |
Macromolecular viscosity |
depolarization |
|
Energy transfer |
Nearest-neighbor detection (spatial |
|
separation); molecular mobility |
|
|
CYTOLOGY, AUTOMATED |
397 |
as a microscopic slide; cell identity and position data are stored in a computer.
Flow Cytometry and Sorting. Flow cytometry and cell sorting have been developed for the rapid identification and isolation of cells. By causing cells in a suspending medium to flow past detection devices, identification is accomplished. With appropriate electronics and data processing devices, cell analysis is effected. Based on the analysis, cells are isolated by physically moving the suspension medium.
Cell analysis includes detection of the parameter desired, appropriately converting the detected energy to some electrical signal, and processing that signal. A cell riding in the stream passes by the laser beam. The cell causes light to scatter and depending on its preparation may fluoresce. If the Coulter effect is implemented, the cell flows through the Coulter aperture and the modulating current flow is detected. Each cell causes a signal to appear at the output of the various detectors. In a sense, the cell has been identified according to the value of the detected parameter. This data is in essence real-time data; it can be used with further treatment for sorting (see below) or stored in the appropriate form for data reduction. In practice, all detection schemes have involved optical parameters or cellular resistance to measure cell size, cellular fluorescence, and other properties.
Cell sorting begins with identifying a detected cell as the one to sort. Essentially the suspending medium or stream is an electronically conducting fluid jet. Fortunately, the ions that imbue electronic conduction properties in the medium also provide the fluid with physiologically useful properties. The stream breaks up into droplets that contain the desired cells. The droplets are charged, and in turn are acted on by an electrostatic field that deflects the charged droplets containing the cells to appropriate containers. Sorting the droplets containing the desired cells and no other plays a major role in determining the purity of the sorted fraction. This is guaranteed by using acoustic energy vibrating the nozzle to create instability on the stream so that the stream breaks into droplets at a predictable point.
We demonstrate these principles with the aid of Fig. 8. The conducting physiologic fluid (sheath) flows into the nozzle and is ejected as a jet through a circular orifice of50 mm. A sample consisting of cells in suspension flows into the nozzle, is injected into the sheath, and is also ejected with the jet. The nozzle is designed to establish laminar flow conditions; this enables the sample to be accurately centered on the stream. If the radius of the sample in the sheath is on the order of the cell size, the cell is highly localized in the center of the stream. The acoustic drive assures the predictability of the location of droplet separation from the stream.
Table 11 lists lasers and their emission lines in common use. Argon ion lasers are capable of delivering several watts of laser energy in the blue-green region of the visible spectrum. Since they require high power input, and a very high discharge current, this laser is very bulky and emits a large amount of heat. Similarly, krypton ion lasers deliver several watts of laser energy in the visible spectrum, and
398 CYTOLOGY, AUTOMATED
Figure 8. A simplified block diagram of a cell sorter. Mirrors directing the laser beam, M1, M2, and M3; lens to focus the laser beam, L1; lenses to image the laser illuminated cell on the detectors L2 and L3; beam splitters to deflect the light, BS1 and BS2; filters to separate the laser excitation from the emitted light of the particle; F1 and F2; photomultipliers to detect fluorescence, P1 and P2; and diode to detect forward scatter, D1. Courtesy FACS Division, Becton, Dickinson Electronics Laboratories, Mountain View, California.
require high power input and a very high discharge current. Mixtures of Argon and Krypton are sometimes referred to as ‘‘white light’’ lasers because of the coverage over the visible spectrum the combination of the two gases produces.
For a zero-resolution device implemented as shown in Fig. 8, each signal produces a pulse 10 ms wide, whose height is proportional to the total light energy detected. Thus, for each cell, the peak of three pulses is obtained: light scatter and two fluorescence wavelengths. Typically, 50,000 cells can be analyzed in 1 min. With 150,000 data points, powerful data reduction capability is required. For sorting, the cell requires 250 ms to arrive at the point in the stream just prior to breaking up into droplets. This
Table 11. Lines of Laser Emissiona
Helium– |
Argon |
Krypton |
Violet |
Krypton– |
Helium– |
Cadmium |
Ion |
Ion |
Diode |
Argon |
Neon |
|
|
|
|
|
|
325 |
|
350.7 |
|
|
|
|
351.1 |
356.4 |
|
|
|
|
364.8 |
|
405 |
|
|
450 |
|
|
|
|
|
|
457.9 |
|
|
|
|
|
476.4 |
|
|
|
|
|
488.0 |
|
|
488 |
|
|
496.5 |
|
|
|
|
|
514.5 |
|
|
|
|
|
|
530.9 |
|
|
|
|
|
568.2 |
|
568.2 |
|
|
|
|
|
|
632.8 |
|
|
648.1 |
|
648.1 |
|
|
|
752.5 |
|
|
|
aWavelengths of light in nanometers.
distance is programmed into the electronics causing the delay required for the identified cell to reach the end of the stream. When the cell reaches that point, the entire stream is charged by the conduction of the ions in the buffer (investigations indicate that <0.01 M salt solution can conduct satisfactorily). The drop containing the cell is separated from the stream and carries the charge imparted to it. The charged drop traverses between electrostatic plates; and due to the interaction of the electric field on the charge, the drop is deflected.
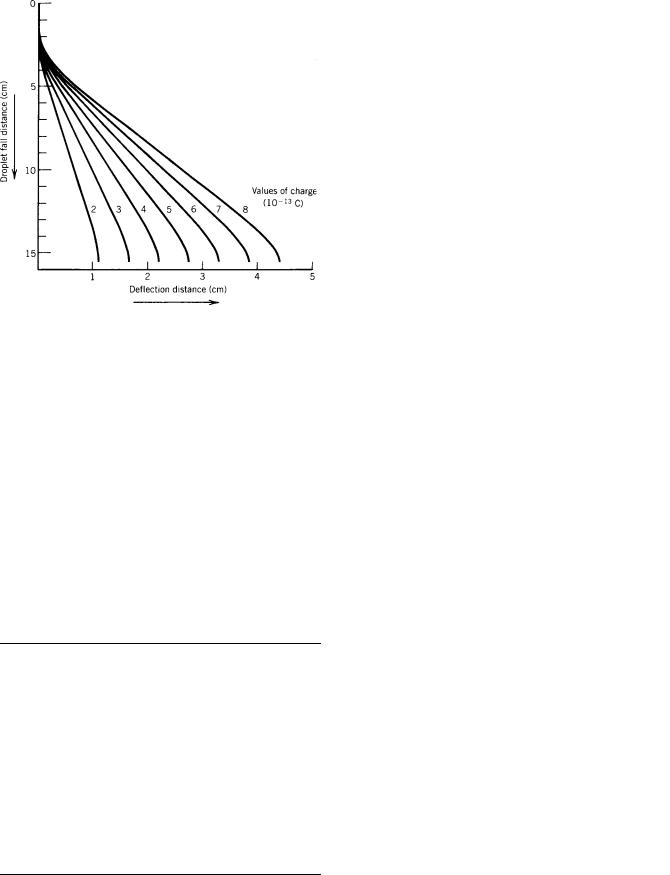
An interesting variation is to replace the electronics with a computer. The data placed into the computers will consist of scattered light intensity, two fluorescence intensities, and relative time of detection. The computer is used to analyze the data and within the 250 ms limit, outputs the sort word. If the sort word is variable so is the charge on the stream. Consequently, one can sort the droplets containing the cells at a defined location on a microscope slide. If the cell’s data and position are stored in the computer, that cell can be retrieved by a computerized microscope (described later). The ability to correlate flow cytometric data with visual data is important in identifying the properties of rare cells, such as cancer cells. Analytical studies of the sort trajectory under conditions of drag show that a ‘‘knee’’ is produced when the horizontal velocity is zero (Fig. 9).
The cytometer just described illuminates and detects cells orthogonally to their traversing path. A different implementation is to place the illumination and detection optical path along the same axis as the path of cell traversal. In this way, the cell passes through the source and detector focal plane. After the cell has passed through the focal point, it is directed away from the optical axis.
Figure 9. Trajectories of charged droplets for seven values of charge. The trajectories were obtained by solving the equations of motion, assuming that the drag on the droplet was a linear function of velocity.
Since the cell passes through the focal plane of the optical system, errors due to focusing and misalignment are reduced, particularly if the same objective is used for excitation and detection.
Most fluorescence spectra has uninteresting shape and the single value obtained by zero resolution systems is adequate. This limits the usefulness of spectral analysis of the fluorescent moiety. Nevertheless some effort has been carried out in this direction. The easiest is the use of a variable color filter and to select the resulting wave for shape (see slit scan systems below). Also some have used white light pulses and processing to identify the spectra. By far the solution has been to use multiple lasers for excitation and to detect the different emission on separate detectors. There are technical limitations as well, the need for UV light means expensive powerful lasers or substantial Xenon light sources, furthermore the speed of processing has now gone up an order of magnitude from the time between cells to the time that the cell is in the laser beam.
An interesting application is the use of fluorescence lifetimes or the so-called phase detection systems. One selects probes with overlapping spectra and different singlet excited states. Using a modulated laser beam and measuring the phase shift in the fluorescence signals gives a measure of differential lifetime.
Low Resolution Systems. In the flow system just described, the cell flowed past a laser beam and the detected energy resulted in a pulse that was peak detected. Clearly, any other parameters could be obtained from the pulse, including pulse area and pulse width, and each descriptor is a single number. Cells are analyzed and sorted based on a single value of a descriptor; thus, each parameter of a zero-resolution system takes a single value from each cell.
There is potential for greater information available from the pulse. For example, if the laser is flattened into a ribbon whose thickness is small compared to the length of the
CYTOLOGY, AUTOMATED |
399 |
traversing cell, the resulting pulse will contain information concerning the shape of the cell. Proper analysis of the pulse can provide increased information about the cell because of the slight increase in resolution. This technology is referred to as ‘‘slit-scan’’. The very narrow laser beam is 4 mm in width and the flow system is slower than the normal
10m/s.
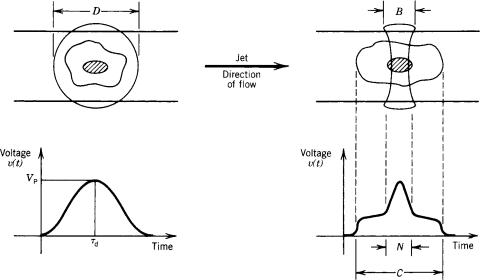
Figure 10 shows the schematic diagram of a cell traver-
sing through the laser beam. The figure on the left shows a zero-resolution wave form in which only the peak-detected value is used to represent the data from the cell. The low resolution system (right) shows some structure as the cell traverses through the laser beam: First the cytoplasm (C) is detected, then the nucleus (N), and then again the cytoplasm.
The development of automated cytology was largely motivated by the requirement to diagnose cancer by finding cancer cells in a sample. Cancer cells can be distinguished from normal cells based on their DNA content (as distinguished by, e.g., AO) and other parameters such as size and RNA. Patient samples for the purpose of detecting early cancers contain highly variable and usually very small numbers of diagnostic cells. Consequently, the problem is not in distinguishing cancer cells from normal cells, which is easily accomplished, but in distinguishing particles whose values fall in the space consistent with cancer cells, but are in fact not cancer cells. This requires additional information provided by low resolution systems, but not by zero-resolution systems.
High Resolution Cytometry. We now consider cell image analyzers usually implemented as a computer-controlled microscope. This high resolution instrumentation is characterized by the ability to obtain large amounts of data on a few cells and to perform complex analyses on those cells.
A microscope is connected to a computer so that data reduction and control of the object in the microscope can be performed. These data are used for automating cell recognition.
Figure 10. Axial view of a circular laser beam of diameter D and cylindrical laser beam of width B, both intersected by a cell. The circular laser beam produces a pulse signal from which a single parameter of information, such as peak height, can be obtained. For example, at time Td, v(t) has a peak value Vp corresonding to the cell in the center of the laser beam. The cylindricalshaped laser beam is a ribbon of light inter-sectedbyaportionofthecell.The output signal, which is the convolution of cell structure with laser light, allows cell structure information to be retrieved easily. For example, the cytoplasm in the laser beam for time C is easily distinguished from the nucleus in the laser beam for time N.

400 CYTOLOGY, AUTOMATED
Figure 11. Schematic diagram of a microscope. Light from the transmission source traverses through to the image plane. Epiillumination is reflected to the object that in turn emits fluorescence, which passes through the dichroic mirror onto the image plane. The computer provides scanning and illumination control and reads the electronically detected data.
The essential features of a computerized microscope are shown in Fig. 11. This is a schematic diagram of a modernday microscope supporting transmission and reflection (fluorescence) microscopy. For transmission microscopy, the light path from the source is treated so that parallel light is transmitted through the object plane. The objective and eyepiece lenses function together to provide the visually detected image at the image plane. Fluorescence excitation (epi-illumination) is by short-wavelength light (violet), which is reflected by the dichroic mirror, then passes through the objective lens onto the object. The object’s fluorescence emission passes through the dichroic mirror, which allows the long-wavelength light to pass; it is then detected in the image plane.
The computer interface provides data exchange between the computer and the controllers of stage motion, illumination, and detection. A photodetector at the image plane measures the intensity of light emanating from the object and a common implementation passes light through a pinhole on to the optical access. In this case, the moving stage controls the object so that its spatial variation of light intensity is acquired. The entire object is imaged one point at a time. Each point is a picture element (pixel) emitting light. Light from each object point produces a datum point, which is stored in a matrix such that the value of the ijth element is the intensity of the light at the ijth pixel.
We abstract the microscope to consist of a light source, an object plane, and detector. Any one moving with respect to the other two can produce the scanning required to image the object. Table 12 shows the characteristics of the scanning components of a microscope.
These systems have high degrees of flexibility since performance is controlled by means of software. In such a system, a cell is located for analysis, appropriately illuminated, and contiguous absorbance values of the image are detected. The image is made up of pixels (say 1 1 mm squares) and the pixel’s intensities are digitized and stored. Software controls data acquisition, performs mathematical operations, and formats the data to a convenient form. For example, the absorbance values of a cell are converted to digital values, gray scale histograms are formed from which cluster analysis in a multiparameter space is performed. Consequently, statistical decision rules can be invoked to assess characteristics of a cell within some statistical confidence interval.
DATA ACQUISITION, PROCESSING, AND MODELING
In the previous section, we described cell measurement systems. Now, we concern ourselves with the acquisition and manipulation of the data produced by these systems. We will begin with data lists produced by zero-resolution devices and proceed to high resolution images produced by cell-scanning devices.
Zero-Resolution Systems
In zero-resolution systems, a cell produces a single value for each parameter measured. If only light scattering is measured, each cell produces only single values of scattering; if additionally two values of fluorescence are
Table 12. Scanning Components on Microscope
|
|
Characteristics of Components |
|
Component |
|
|
|
|
|
|
|
Performing Scan |
Source |
Object |
Detector |
|
|
|
|
Source |
Point scanner (laser illumination) |
Stationary |
Stationary |
Object |
Stationary (uniformly illuminated field) |
Scanning stage |
Stationary (pinhole) |
Detector |
Stationary (uniformly illuminated field) |
Stationary |
Point detector (television camera) |
|
|
|
|

measured, each cell produces three data points. The acquired data are listed one point after the other as
———————————————————————————
Cell Number Parameter 1 Parameter 2 Parameter 3
Cell 1 |
255 |
10 |
128 |
Cell 2 |
128 |
210 |
197 |
|
|
|
|
|
|
|
|
|
|
|
|
Cell n |
37 |
196 |
212 |
———————————————————————————
Such list mode data can be stored and reduced into histograms of the data.
Histograms. A common form of data reduction is the production of histograms of the data. An n-parameter histogram is in n þ 1 dimensions, where the additional dimension is frequency of events.
A single-parameter histogram substantially reduces the amount of data compared to the list mode. For example, a 256-bin histogram (28) requires 256 words of storage compared to the 25,000 words required for storing the 50,000 bytes of data obtained from a single run. Examples of single-parameter histograms are shown in Fig. 3.
Dual-Parameter Histograms. Data from two parameters,
P1 and P2, can be displayed so that each pair (p1, p2) contains the number of cells that express that pair of values. For data storage, the multiplicative effect of the number of dimensions reduces the histogram’s value. A two-parameter histogram of 256 channels requires 2562 (64 k) locations, which is approximately the number of data points acquired. Furthermore, the data will not cluster well when insufficient numbers of cells have been acquired. A common way around this problem is to reduce the resolution from 8 bits to 6 bits (256 to 64). Now, only 4096 channels are required for that histogram display. The increased ability to visually cluster the data is achieved with a loss in additional information.
Three-Dimensional Histograms. Although this is a fourdimensional system, a common method of displaying threeparameter data is to plot each triple for a given frequency. For example, Gaussian-distributed data in three parameters (with equal variances) is displayed as a spherical cloud in the three-parameter space at each frequency. Since the storage space for such a histogram is 2563 (16 million), clearly storage of the list data is more efficient than storing the data in histogram form.
A useful method of analyzing data displays one or more parameters as a function of a specified set of values of another parameter. For example, it is convenient to analyze two fluorescence parameters resulting from the largest cells. The set of values representing the largest cells is called a window. For each value in the window, there corresponds one or more parameters that can be displayed.
CYTOLOGY, AUTOMATED |
401 |
The values within the window act as a gate to display the other parameters.
Finally, a physical interpretation of the histogram occurs when we consider its mean value. Assume we acquire data from a multiplicity of cells. Further, we wish to measure the presence of some molecule by causing a radioactive tag to bind to it. The resulting measurement of radioactivity is the sum of the contributions of the individual cells. If this is normalized to the number of cells, the result is a mean value. Now the histogram, of course, displays the number of cells that contain each value of data for all the values of data. So it provides substantially more information than the single mean-value datum. Furthermore, the mean of the histogram corresponds to the mean-value result. For example, the distribution of DNA in a cycling population is very uneven, a fact that would not be elucidated from mean values over the population.
Histogram Analysis. Parametric and Nonparametric Analysis of Histograms. Parametric analysis assumes a model or distribution is used to compare, or analyze, the data. Nonparametric analysis assumes no such model.
Nonparametric Analysis. It is useful to compare histograms so that the effect of different treatments can be statistically assessed; two techniques are generally used. The first one requires three or more identical histograms and sums up the individual channels to obtain a mean and variance of each channel. Based on this model a channel- by-channel t test is made of the sample histograms to decide if statistical significance is valid.
A second technique uses the Kolmogorov–Smirnoff technique (see Fig. 12). In this case the histogram [Fig. 12a] is normalized, then summed to a cumulative distribution [Fig. 12b]. The two cumulative distributions are compared. The comparison is in the form of the absolute value of the difference between the two histograms. If this value exceeds a certain critical value that determines the level of confidence, the two histograms are statistically significantly different.
Parametric Analysis. The majority of work in this area has been to develop models that will aid in finding the number of cells in the various compartments of the cell cycle from DNA histograms. It is assumed that the ‘‘true’’ DNA histogram consists of two impulses with DNA values at 2n (for G0/G1 cells), the other at 4n (for G2/M), and cells in S are in between. As a result of the imprecision of measurements, the impulses at 2n and 4n values of DNA have been broadened. More generally, we write the expression used to model single-parameter DNA distributions.
FðkÞ ¼ F1ð2ps1Þ 1=2 exp½ ðk m1Þ2=2s21&
þ F2ð2ps2Þ 1=2exp½ ðk m2Þ2=2s22& þ sðkÞ
In parametric analyses of the DNA histograms, the broadened pulses are assumed to be Gaussian with means m1, m2 and variances s1, s2, respectively. The critical issue is the shape of the s-phase distribution, s(k). In the earliest modeling systems a second-degree polynomial

402 CYTOLOGY, AUTOMATED
Figure 12. (a) Histograms of the size distribution of cells either infected ( ) or not infected ( ) with herpes virus. (b) The cumulative distribution of each of the above histograms.
was assumed to be the fit. Other models have assumed Gaussian curves of various values to try and fit the data to the s values. The distinction between the cells that are in G1 and S is not sharp and these populations overlap each other. Consequently, methods that distinguish between G1 and S without models (e.g., graphical) usually underestimate G1 compared to S by 20%. The number of cells in S is small compared to the number of cells in G1; furthermore, the width of the G1 peak is also very small; consequently a small error in defining the G1 compartment can result in substantial errors in estimating S and G2.
Unfortunately, these models are good only for wellbehaved populations whose value of DNA does not exceed 4n, such as tissue culture cells. The DNA distribution of cells from cancer patients are complex due to cell clones arising with increased amounts of DNA, increased number of chromosomes (aneuploidy), and the presence of multinucleated cells.
Finally, these models seek only to fit curves to the values of DNA. They are not intended to elucidate the production of such distributions from fundamental principles, although some authors have tried such derivations, and achieved limited success.
Image Analysis
Cell data acquired by high-resolution systems consist of a list of photometric values of light intensity and the corresponding source point address. Scanning is sequential so the source addresses (or locations of the source points) need not be explicit. Each source point (pixel) on the cell is really an area of the cell that produces a uniform intensity. The pixel size determines the resolution of the image.
The light-intensity list can be manipulated, resulting in classification of the object by techniques referred to as pattern recognition. This is distinct from other operations on the image such as restoration. Image restoration uses the mathematical properties of the image generation system to obtain an inversion that will remove the errors introduced during image generation. Pattern recognition uses image features to distinguish between objects and to express that distinction in statistical terms. The general sequence of events for pattern recognition is shown in Fig. 13.
Pattern Recognition. The preprocessor operates on the digitized image, which is the list of pixel values. In preparation for feature extraction, sections of the image are defined (automatically or by human interaction) using edge detection filters to distinguish boundaries.
A second operation is the formation of a gray scale (and other) histograms. The gray scale histogram lists the number of pixels for each gray value (intensity value) for the entire dynamic range of gray values in the system. Image characteristics cluster about some value of gray in the histogram. For example, a cell typically displays a cluster value representing the nucleus and second cluster about the lesser dense values of the cytoplasm. Thus, a separation of the nucleus and cytoplasm can be effected depending on the degree of separation between the two clusters. The cell shown in Fig. 14 has had all its cytoplasmic values truncated to a particular gray value; this gives prominence to the highly variable but more dense values of the nucleus.
Figure 13. Sequence of events in pattern recognition.
Figure 14. Display of a digitized cell showing the truncated values of the cytoplasm.
A second operation is equalization of the gray scale histogram. This is a nonlinear transformation resulting in a histogram with reduced number of gray levels at approximately equal frequency. Since the frequency of gray level occurrences contains no information about the texture of the image, this permits images to be placed into a consistent format prior to comparisons.
Feature Extraction. After preprocessing the image data to yield measures based on image data, it is possible to obtain cell characteristics, called features, that are based on geometric parameters, texture parameters, optical density, or gray level parameters.
For example, statistical texture analysis, such as is typically used in medical imaging, uses conditional probability matrices to obtain features. Picture analysis proceeds by forming a transition probability matrix from the image data. From this matrix the texture features used for classifying objects in the image are determined. Each element in the matrix, PL(I/J), is defined as the conditional probability of gray level occurring L picture points after gray level J occurs. Each of L matrices is square of dimension n, where n is also the number of gray values. Operations on these matrices can be performed to produce parameters, such as the second moment of the matrix or the moment of inertia about the diagonal of the matrix, for all values of I and J. Clearly, a very large number of parameters can be chosen in this manner. Texture analysis has been used successfully to classify cytological samples.
Classifier. The last step in the pattern recognition chain is classifying the cell based on the measured features. Each feature is a dimension in feature space. A range of values of each feature are obtained from a training set, that is, a set of objects whose classifications are known. This feature space is sectioned by boundaries defined by the class or
CYTOLOGY, AUTOMATED |
403 |
members of the training set. These boundaries separate the objects into the different classification regions. The features of an unclassified or unknown object can then be compared to the classification obtained from the training set. The probability of the unknown object belonging to a particular class as then determined. An interesting problem is that the vectors produced by the features may not be orthogonal. If such vectors are correlated, the feature provides little new information in addition to its correlative feature. Consequently it is important to have features with different information content.
CURRENT USAGE
DNA Measurements
In previous examples, we discussed the measurement of DNA in intact cells, which are now providing new and useful information in both biology and medicine. We briefly mention three applications of interest: bacterial analysis, chromosome analysis, and sperm analysis.
Flow systems can be used to classify bacteria types by the difference in dye uptake by the DNA base pairs. Fluorescent CGor AT-specific dyes are used to generate a twodimensional histogram that can be used to differentiate bacterial species. This may be useful in a biology laboratory for rapid identification of bacterial types. In medicine, such a detection system would be useful in urine samples. However, with blood its usefulness is limited. First, the level of infection in blood is produced by very few bacterial cells. Their small size and the presence of overwhelming numbers of red blood cells makes detection extremely difficult. A second major difficulty is that the information of importance in medical practice is sensitivity: which and how much antibiotic kills the bacterium, not which bacterial cell is causing the infection.
Chromosome Analysis. As yet neither zero-resolution systems nor low resolution systems provide adequate separation between the human chromosomes to completely perform a human karyotype. It is interesting, though, that errors in karyotyping due to chromosomal particles produced by disease are constant and repeatable and thus can be expected to show exceptions to the normal.
Flow systems have been used to analyze sperm cells, primarily to measure the DNA of the cell types. Spermatids, which are spherical precursors to the mature sperm, are easily analyzed by flow cytometry and produce a separation between the X and Y chromosome. This separation implies that a distinction can be made between spermatids whose sperm will give rise to females (X chromosome) or males (Y chromosomes). These data were obtained with an axial flow analysis device and with a very small coefficient of variation (0.9%). Unfortunately, the mature sperm cells are not well-behaved spheres, but flattened bags of DNA with a comparatively long tail. Thus, an orientation artifact blurs the 2% difference in DNA resulting from the X–Y chromosome mismatch. However, flow analysis can be used for fertility determinations and where the number of sperm is an important parameter.

404 CYTOLOGY, AUTOMATED
Hematology
An important area is hematology, the discipline concerned with the study of blood and its components.
Differential blood cell counters place white blood cells into five basic classes: lymphocyte, eosinophil, basophil, monocyte, and neutrophil. Since red blood cells outnumber the white cells by a thousandfold, they are usually excluded by preparation. These six-cell types have been classified by several commercial devices that use pattern recognition and high resolution image analysis for classification. Such classifications have occurred with varying levels of reliability. A major problem is a category required for ‘‘others’’, that is, for cells that cannot be classified into any of the six classes. This category reflects the fact that at any one time, blood cells are maturing into the different classes. Furthermore, the body’s reaction to some diseases or insults is to produce increased numbers of cells from the bone marrow into the blood stream at various levels of maturation of the cells. Consequently, some workers have attempted to classify nucleated blood cells into 17 different types. Efforts at white blood cell classification using flow systems have not had the commercial success that scanning systems have had.
Immunology
An important application of flow systems has been to enumerate and classify the cells in the body that are part of the immune system. Briefly, the body produces antibodies to antigens. The antigens are usually foreign substances such as a bacterial cell surface; but in abnormal situations the body produces antibodies to its own antigens. The covalent binding of antibody to antigen initiates a set of reactions that results in the destruction of the foreign substance.
A specific kind of antibody, called a monoclonal antibody, reacts only with a single antigenic determinant. This is in contrast to the multiplicity of antigenic determinants that produce heteroclonal antibodies, which are usually produced by the body. Fluorescent stains such as FITC and PE are covalently bound to the monoclonal antibody of choice. Thus, simultaneous green and yellow fluorescence to distinguish the different immunological cell types can be produced (see Table 13).
One application of this technology is to differentiate the various classes of lymphocytes. Lymphocytes are divided into two general classes: B cells and T cells. In general, the B
Table 13. Excitation and Emission of Selected Fluorescence Labels
|
Excitation, nm |
Emission, nm |
|
|
|
Fluorescein isothyocyanate |
488 |
530 |
(S)-Phycoerythrin |
490 |
570 |
(R)-Phycoerythrin |
498 |
575 |
Bodipy |
503 |
511 |
Tetramethyl rhodamine |
560 |
580 |
L-Rhodamine |
572 |
590 |
B-Phycoerythrin |
540 |
575 |
Texas Red |
590 |
620 |
|
|
|
CY-5 |
649 |
666 |
|
|
|
Table 14. Ligand Binding
Immunologic
Cell surface receptor on lymphocytes Cells identified by surface immunoglobulin
T cells identified by various T receptors including T4 for helper cell and T8 for killer cells
DNA synthesis: Antibody to bromodeoxyuridine Indirect immunologic binding
Goat-anti-rabbit antibody with fluorescent tag binds to rabbit– anti-receptor molecule
Avidin tagged with fluorescent molecule binds to biotin attached to the antibody against the detected antigen
Hormonal
Estrogen receptor analog (17-fluorescein estradiol)
cells produce antibodies, whereas the T cells are direct protagonists in the immune response. By the use of monoclonal antibodies, T cells have been divided into many subsets. Some of the most important are T4 (helper cells) and T8 (suppressor cells). These cells are distinguished by T4 and T8 monoclonal antibodies. Table 14 shows the ligand-binding applications, including lymphocyte cell surface characteristics.
In medicine, determining the number of helper and suppressor cells is valuable in transplantation and cancer. The ratios of these cells and the changes in ratio as the patient undergoes treatment is an indicator of the patient’s ability to respond to the treatment. Indeed the absence of helper cells due to viral destruction is the primary problem in acquired immune deficiency syndrome (AIDS).
Oncology
A major application in both flow and cell scanning systems has been in oncology. The primary thrust has been to classify cell types and to distinguish the malignant cells from nonmalignant cells. For example, nuclear texture has been used to classify uterine cervical cells into cancer cells and noncancer cells.
Studies involving the four major types of lung cancers have been performed to determine the ability of flow systems to first find and then sort the malignant cells. The criterion for malignancy is based on the morphological features used by pathologists to diagnose cancer. Cytological examination of lung cells begins with the sample (sputum). The cells in the sample are fixed to minimize disease contagion and for preservation. After fixation, the cells are stained with acridine orange, analyzed, and sorted for the highest value of green and red fluorescence. The Acridine Orange analysis of cancer cells provides information about the relative amount of RNA and DNA in cells. Cancer cells are found in regions showing the highest green fluorescence. By sorting, a substantial enrichment (65-fold) for cancer cells can be obtained. Concomitantly, there is a sharp reduction in normal cell types, such as lymphocytes and squamous cells.
A similar technique using acridine orange staining of cells has been applied to urinary cytology. This has resulted in a system that is demonstrably superior to human cytological analysis for earlier detection of recurrent cases of bladder cancer. Data on cells are placed in list
mode for scatter, green fluorescence, and red fluorescence. The pulse width of scattering is used to find debris and eliminate it. The resulting ‘‘clean’’ data list then produces RNA and DNA histograms to find whether the number of cells in S>20%; if so, a recurrence is said to have occurred.
Many studies have been made that identify an aneuploid (aberrant number of chromosomes) population of cells. Such aneuploid cells are considered by some pathologists to be diagnostic of cancer.
In a clinical setting, a machine approach to cancer detection has been to analyze a very large number of cells without false positive indications. This is not possible with zero-resolution systems; however, low resolution systems have been developed with sufficient information content to identify the false alarms. These have been used in clinical trials and the results have been dramatic. High resolution instrumentation using cell-scanning techniques and texture analysis have been used to identify and classify cells according to cell type and denote the malignant cells. These systems have had success in identifying various normal as well as disease cell types.
The medical and biology literature abounds with examples of applications in flow cytometry and high resolution image analysis. The bibliography lists samples of this literature.
FUTURE PROSPECTS
Historically, the motivation for new instrumentation is the increased information. In automated cytology, instrumentation has increased information by improved optical resolution and the increased number of cells for improved reliability of statistics. Furthermore, the development of quantitative techniques to analyze cells makes possible the basis for a quantitative theory of biological phenomena.
In one sense these are learning tools; they provide basic measurements. In another sense, their increased speed is a basis for economic value since productivity is improved.
CYTOLOGY, AUTOMATED |
405 |
A further advantage is the use of computers. The measurement instrumentation can easily act as an input to a computer. The data handling power of computers makes possible analysis of enormous numbers of cells thereby establishing repeatable quantitative relationships.
The increase in speed and information and objectivity of this instrumentation makes it an economic force in the market. The present high expense of illumination equipment (primarily lasers) limits its economic practicality. Nevertheless, the present use of this equipment in diagnosis can be expected to increase. Furthermore, its use in therapy and prediction of disease are just now starting. With expected cost reduction, use of this instrumentation will increase.
BIBLIOGRAPHY
1.Mellors RC. Analytical Cytology. 2nd ed. New York: McGrawHill; 1959.
2.Melamed MR, Mullaney PF, Mendelsohn ML. Flow Cytometry and Sorting. New York: John Wiley & Sons; 1979.
3.Melamed MR, Lindmo T, Mendelsohn ML. Flow Cytometry and Sorting. 2nd ed. New York: Wiley-Liss; 1994.
4.Shapiro HM. Practical Flow Cytometry. New York: Alan R. Liss; 1985.
Further Reading
Cytometry, New York: original publisher Alan R. Liss. This is the journal of the International Society for Analytic Cytology. First issued in July 1980, it is a forum for automated cytology, with a thrust to basic measurements in the biology of single cells and particles. It is now published monthly by Wiley-Liss, Inc. Clinical Cytometry Started in 1994, and in 1997 produced the first issue of Current Protocols in Cytometry.
Analytical and Quantitative Cytology and Histology. St. Louis, MO: Science Printers and Publishers, Inc. This journal is sponsored by the International Academy of Cytology and the American Society of Cytology. It focuses primarily on automation and quantitative aspects of cytology and is also a forum for automated cytology.
See also ANALYTICAL METHODS, AUTOMATED; COMPUTERS IN THE BIOMEDICAL LABORATORY; DIFFERENTIAL COUNTS, AUTOMATED.