

- •VOLUME 2
- •CONTRIBUTOR LIST
- •PREFACE
- •LIST OF ARTICLES
- •ABBREVIATIONS AND ACRONYMS
- •CONVERSION FACTORS AND UNIT SYMBOLS
- •CARBON.
- •CARDIAC CATHETERIZATION.
- •CARDIAC LIFE SUPPORT.
- •CARDIAC OUTPUT, FICK TECHNIQUE FOR
- •CARDIAC OUTPUT, INDICATOR DILUTION MEASUREMENT OF
- •CARDIAC PACEMAKER.
- •CARDIAC OUTPUT, THERMODILUTION MEASUREMENT OF
- •CARDIOPULMONARY BYPASS.
- •CARDIOPULMONARY RESUSCITATION
- •CARTILAGE AND MENISCUS, PROPERTIES OF
- •CATARACT EXTRACTION.
- •CELL COUNTER, BLOOD
- •CELLULAR IMAGING
- •CEREBROSPINAL FLUID.
- •CHEMICAL ANALYZERS.
- •CHEMICAL SHIFT IMAGING.
- •CHROMATOGRAPHY
- •CO2 ELECTRODES
- •COBALT-60 UNITS FOR RADIOTHERAPY
- •COCHLEAR PROSTHESES
- •CODES AND REGULATIONS: MEDICAL DEVICES
- •CODES AND REGULATIONS: RADIATION
- •COGNITIVE REHABILITATION.
- •COLORIMETRY
- •COMPUTERS IN CARDIOGRAPHY.
- •COLPOSCOPY
- •COMMUNICATION AIDS FOR THE BLIND.
- •COMMUNICATION DEVICES
- •COMMUNICATION DISORDERS, COMPUTER APPLICATIONS FOR
- •COMPOSITES, RESIN-BASED.
- •COMPUTED RADIOGRAPHY.
- •COMPUTED TOMOGRAPHY
- •COMPUTED TOMOGRAPHY SCREENING
- •COMPUTED TOMOGRAPHY SIMULATOR
- •COMPUTED TOMOGRAPHY, SINGLE PHOTON EMISSION
- •COMPUTER-ASSISTED DETECTION AND DIAGNOSIS
- •COMPUTERS IN CARDIOGRAPHY.
- •COMPUTERS IN THE BIOMEDICAL LABORATORY
- •COMPUTERS IN MEDICAL EDUCATION.
- •COMPUTERS IN MEDICAL RECORDS.
- •COMPUTERS IN NUCLEAR MEDICINE.
- •CONFOCAL MICROSCOPY.
- •CONFORMAL RADIOTHERAPY.
- •CONTACT LENSES
- •CONTINUOUS POSITIVE AIRWAY PRESSURE
- •CONTRACEPTIVE DEVICES
- •CORONARY ANGIOPLASTY AND GUIDEWIRE DIAGNOSTICS
- •CRYOSURGERY
- •CRYOTHERAPY.
- •CT SCAN.
- •CUTANEOUS BLOOD FLOW, DOPPLER MEASUREMENT OF
- •CYSTIC FIBROSIS SWEAT TEST
- •CYTOLOGY, AUTOMATED
- •DECAY, RADIOACTIVE.
- •DECOMPRESSION SICKNESS, TREATMENT.
- •DEFIBRILLATORS
- •DENTISTRY, BIOMATERIALS FOR.
- •DIATHERMY, SURGICAL.
- •DIFFERENTIAL COUNTS, AUTOMATED
- •DIFFERENTIAL TRANSFORMERS.
- •DIGITAL ANGIOGRAPHY
- •DIVING PHYSIOLOGY.
- •DNA SEQUENCING
- •DOPPLER ECHOCARDIOGRAPHY.
- •DOPPLER ULTRASOUND.
- •DOPPLER VELOCIMETRY.
- •DOSIMETRY, RADIOPHARMACEUTICAL.
- •DRUG DELIVERY SYSTEMS
- •DRUG INFUSION SYSTEMS
258 COMPUTED TOMOGRAPHY SCREENING
8.Bracewell RN. Strip integration in radio astronomy. Aust J Phys 1956;9:198–217.
9.DeRosier DJ, Klug A. Reconstruction of three-dimensional structures from electron micrographs. Nature London 1968; 217:130–134.
10.Kuhl DE, Edwards RQ. Image separation radioisotope scanning. Radiology 1963;80:653–662.
11.CormackAM.Representationofafunctionbyitslineintegralswith some radiological applications. J Appl Phys 1963;34:2722–2727.
12.Hounsfield GN. Computerized transverse axial scanning tomography: Part I: Description of system. Br J Radiol 1973;46:1016–1022.
13.Dennis MJ. Industrial Computed Tomography. Metals Handbook. Metals Park, (OH): ASM International; 1989. p 358–386.
14.Boyd DB, Lipton MJ. Cardiac computed tomography. Proc IEEE 1983;71:298–307.
15.Ritman EL, Robb RA, Harris LD. Imaging physiological functions: Experience with the dynamic spatial reconstructor Philadelphia: Praeger; 1985.
16.Mori I. Computerized tomographic apparatus utilizing a radiation source. US Patent 4,630,202. 1986.
17.Nishimura H, Miyazaki O. CT system for specially scanning subject on a moveable bed synchronized to x-ray tube revolution. US Patent 4,789,929. 1988.
18.Kalender WA, Klotz W, Vock E. Spiral volumetric CT with single breath-hold technique, continuous transport, and continuous scanner rotation. Radiology 1990;176:181–183.
19.Kalender WA. Computed Tomography: Fundamentals, System Technology, Image Quality, Applications. Munich: Publicis MCD Verlag; 2000.
20.Hu H. Multi-slice helical CT: Scan and reconstruction. Med Phys 1999;26(1):5–18.
21.Fishman EK, Jeffrey RB, editors. Multidetector CT: Principles, techniques, and clinical applications. Philadelphia: Lippincott, Williams & Wilkins; 2003. p 560.
22.Yester MW, Barnes GT. Geometrical limitations of computed tomography (CT) scanner resolution. Appl Opt Instr Med VI Proc SPIE 1977;127:296–303.
23.IEC. International Electrotechnical Commission: Medical electrical equipment–60601 Part 2-44: Particular requirements for the safety of X-ray equipment for computed tomography. Geneva, Switzerland: 1999.
24.Kachelriess M, Kalender WA. ECG-correlated image reconstruction from subsecond spiral CT scans of the heart. Med Phys 1998;25(12):2417–2431.
25.Cline HE, et al. Two algorithms for the three-dimensional reconstruction of tomograms. Med Phys 1988;15(3):320–327.
26.Schoepf UJ, et al. Multislice CT angiography. Eur Radiol 2003;13(8):1946–1961.
27.de Feyter PJ, Kresin GP, editors. Computed Tomography of the Coronary Arteries. New York: Taylor & Francis Group; 2004. p 208.
28.Vrtiska TJ, Fletcher JG, McCollough CH. State-of-the-art imaging with 64-channel multidetector CT angiography. Perspect Vasc Surg Endovasc Ther 2005;17(1):3–10.
29.Ulzheimer S, Kalender WA. Assessment of calcium scoring performance in cardiac computed tomography. Eur Radiol 2003;13(3):484–497.
30.Kalender WA, Klotz W, Suss C. Vertebral bone mineral analysis: an integrated approach with CT. Radiology 1987;164: 419–423.
31.Lang TF, et al. Assessment of vertebral bone mineral density using volumetric quantitative CT. J Computer Assisted Tomogr 1999;23(1):130–137.
32.Braillon PM. Quantitative computed tomography precision and accuracy for long-term follow-up of bone mineral density measurements: a five year in vitro assessment. J Clin Densitom 2002;5(3):259–266.
33.Alvarez RE, Macovski A. Energy selective reconstructions in x-ray computerized tomography. Phys Med Biol 1976;21: 733–744.
34.Vogel WV, et al. PET/CT: Panacea, redundancy, or something in between? J Nucl Med 2004;45(Suppl 1): 15S–24S.
35.Bockisch A, et al. Positron emission tomography/computed tomography—imaging protocols, artifacts and pitfalls. Mol Im Biol 2004;6(4):188–199.
36.Limitation of Exposure to Ionizing Radiation. NCRP Report No. 91. National Council on Radiation Protection; 1993.
37.Morin RL, Gerber TC, McCollough CH. Physics and dosimetry in computed tomography. Cardiol Clinics 2003;21(4):515–520.
38.McCollough CH, Schueler BA. Calculation of effective dose. Med Phys 2000;27(5):828–837.
39.Barrett HH, Swindell W. Radiological Imaging: The Theory of Image Formation, Detection, and Processing. New York: Academic Press; 1981.
40.Greess H, et al. Dose reduction in computed tomography by attenuation based on-line modulation of tube current: Evaluation of six anatomical regions. Eur Radiol 2000;10(2):391–394.
41.Kalender WA, et al. Dose reduction in CT by on-line tube current control: principles and validation on phantoms and cadavers. Eur Radiol 1999;9(2):323–328.
42.Kaczmarz S. Angenaherte Auflosung von Systemen linearer Gleichungen. Bull Acad Polonaise Sci Lett 1937;A35:355–357.
43.GrandDG.Tomosynthesis:Athree-dimensionalradiographicima- ging technique. IEEE Trans Biomed Eng 1972;BME-19(1): 20–28.
44.Ramachandran GN, Lakshminarayanan. Three-dimensional reconstruction from radiographs and electron micrographs: III. Description and application of the convolution method. Indian J Pure Appl Phys 1971;9:997.
45.Shepp LA, Logan BF. The Fourier reconstruction of a head section. Trans IEEE 1974;NS-21:21–43.
46.McCollough CH, et al. The phantom portion of the American College of Radiology (ACR) Computed Tomography (CT) accreditation program: Practical tips, artifact examples, and pitfalls to avoid. Med Phys 2004;31(9):2423–2442.
47.Blumenfeld SM, Glover G. Spatial resolution in computed tomography. In: Newton TH, Potts DG, editors. Radiology of the Skull and Brain, Vol 5, Technical Aspects of Computed Tomography. New York: C.V. Mosby Company; 1981.
48.Joseph PM. Image noise and smoothing in computed tomography (CT) scanners. Opt Eng 1978;17:396–399.
49.Joseph PM. Artifacts in computed tomography. Phys Med Biol 1978;23:1176–1182.
50.Parry CK, Rajagopalan B. Characterization of artifact simulating aortic dissection in computed tomography imaging. J Digital Imaging 2001;14(2 Suppl. 1):220–221.
51.McDavid WD, et al. Spectral effects on three-dimensional reconstruction from x-rays. Med Phys 1975;2(6):321–324.
See also IONIZING RADIATION, BIOLOGICAL EFFECTS OF; MAGNETIC RESONANCE IMAGING; ULTRASONIC IMAGING.
COMPUTED TOMOGRAPHY SCREENING
DAVID J. BRENNER
Columbia University Medical
Center
New York, New York
INTRODUCTION
Computed tomography (CT), developed by Hounsfield and colleagues in the 1970s (1,2) has revolutionized much of
(millions) |
60 |
|
|
|
|
|
|
|
0.20 |
person/yr |
|
|
|
|
|
|
|
||||
50 |
|
|
|
|
|
|
|
|
||
|
|
|
|
|
|
|
|
|
|
|
|
40 |
|
|
|
|
|
|
|
0.15 |
|
scans/yrCT |
|
|
|
|
|
|
|
|
CTscansper |
|
30 |
|
|
|
|
|
|
|
0.10 |
||
|
|
|
|
|
|
|
|
|
||
of |
20 |
|
|
|
|
|
|
|
|
of |
|
|
|
|
|
|
|
|
0.05 |
||
Number |
|
|
|
|
|
|
|
|
Number |
|
10 |
|
|
|
|
|
|
|
|
||
|
|
|
|
|
|
|
|
|
|
|
|
0 |
|
|
|
|
|
|
|
0.00 |
|
|
|
|
|
|
|
|
|
|
||
|
1980 |
1984 |
1988 |
1992 |
1996 |
2000 |
2004 |
|
||
Year
Figure 1. Graph shows the increase in the estimated number of CT scans performed in the United States between 1980 and 2000. (Based on data in Refs. 86–89.)
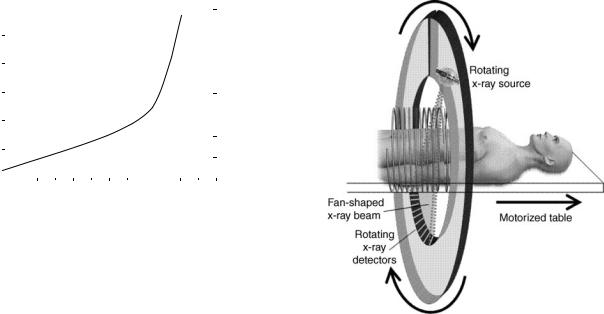
medical imaging by allowing a three dimensional (3D) view of the organ or part of the body of interest. Since its inception, the use of CT has increased very rapidly, both in the United States and other countries. At present,60 million CT scans are being performed each year in the United States. As seen in Fig. 1, this increase has occurred roughly over 20 years. It has largely been driven by the major technical advances in CT technology, in particular the development of helical multidetector CT scanners, as discussed below, which allow CT scans to be made in 1 s or less.
The basic principle of helical, or spiral, CT scanning is shown in Fig. 2. Essentially, the patient is moved through a continuously rotating X-ray source–detector combination. A more modern version is the multidetector CT, which gives the advantage of short scan times, coupled with potentially very thin slice widths. The result is a series of many images of ‘‘slices’’ of the organ or part of the body of interest, which can then be combined by computer-based mathematical techniques, to provide 3D views.
The use of CT for mass screening is a more recent innovation, driven in part by the increased availability and convenience of CT scans. Three applications, each of which will be discussed, have been suggested for CT-based screening: for early stage lung cancer in smokers and exsmokers; for lesions in the colon (virtual colonoscopy); for general screening for many diseases in the whole body (full-body screening).
All three modalities, as of 2005, are quite new, and a general consensus has not yet been reached about the efficacy of any of them. The general issues regarding efficacy of these new modalities are, in essence, the same as for all other potential mass screening modalities, for example, mammography, pap smear screening, and colonoscopy. However, as discussed, there is an added issue for CT-based screening modalities, namely, the significant X-ray radiation exposures involved.
The more general issues of screening relate to (a) whether the screening modality truly produces a stage shift (i.e., allows detection of more early-stage cancers and less late-stage cancers), (b) whether the screening
COMPUTED TOMOGRAPHY SCREENING |
259 |
Figure 2. Schematic of helical (spiral) CT scanning. Both the X- ray source and, on the other side of the patient, the X-ray detectors, rotate around the patient. If the table were not moving, a single slice of the patient would be imaged (axial CT). Because the table is moving at the same time as the source–detector combination is rotating, the result is a helical or spiral CT scan of the patient, as depicted here. Shown in this schematic is a single row of detectors; modern multidetector scanners have several rows of detectors alongside each other, which allow both for thinner slice widths, and shorter scan times.
modality produces overdiagnosis (identifying lesions that the individual would die with, rather than die of); and (c) false positives, the possibility of mistakenly identifying a tumor, with the attendant possibility of subsequent unnecessary procedures. All these issues feed in to the general question of whether the overall mortality rate from the disease in question is significantly reduced by the screening test.
By contrast, the radiation exposure issues that relate to CT-based mass screening are unique. It is, of course, true that mammography also involves the use of X rays, but, as we will discuss, the radiation doses involved are generally much higher for CT-based screening compared to mammography. Thus the potential benefits of any CT-based screening procedure must, in addition to the more general efficacy issues discussed above, have to significantly outweigh any potential harm from repeated low dose X-ray exposures. In the next section, what is currently known about the hazards of low doses of X rays is reviewed.
CANCER RISKS ASSOCIATED WITH EXPOSURE TO LOW X-RAY DOSES
Some typical radiation doses associated with common radiological examinations are shown in Table 1. The biological effects of low dose X-ray exposures have been investigated and debated for more than a century (3). There is little
260 COMPUTED TOMOGRAPHY SCREENING
Table 1. Typical Organ Doses from Various Radiological Examinationsa
|
Relevant |
Relevant Organ |
Examination |
Organ |
Dose, mSv |
|
|
|
Dental X ray |
Brain |
0.005 |
PA Chest X ray |
Lung |
0.01 |
Lateral chest X ray |
Lung |
0.15 |
Screening mammogram |
Breast |
3 |
Adult abdominal CT |
Stomach |
10 |
Neonate abdominal CT |
Stomach |
25 |
aRadiation dose, a measure of ionizing energy absorbed per unit mass, has units of Gy (gray) or mGy (1 Gy ¼ 1 J kg 1); it is often quoted as an equivalent dose, in units of Sv (Sievert) or mSv. For X rays, which are the radiations produced in CT scanners, 1 mSv ¼ 1 mGy.
question that intermediate and high doses of ionizing radiation, say above 100 mSv, given acutely or over a prolonged period, produce deleterious effects in humans, the most significant being cancer induction (4). At lower doses, however, the situation is less clear. Compared to higher doses, the risks associated with low doses of radiation are lower, and progressively larger epidemiological studies are required to quantify the cancer risk to a useful level of precision. The reason is, as the dose goes down, the signal (radiation risk) to noise (natural background risk) ratio decreases.
Most of the quantitative information that we have regarding radiation-induced cancer risks comes from studies of A-bomb survivors. A-bomb survivor cohorts are generally used as the basis for predicting radiation-related risks to a general population because (a) they are the most thoroughly studied (over many decades) large exposed population; (b) the cohorts are not selected for disease;
(c) all age groups are covered; and (d) a substantial subcohort of 25,000 survivors, typically those who were2–3 km from the explosion hypocenters (5), received radiation doses comparable to those of concern here.
Key questions here are as follows: What is the lowest dose of X rays for which there is convincing evidence of significantly elevated cancer risks in humans? What is the most appropriate way to extrapolate these risks to still lower doses? What is the dependence of cancer risks on age at exposure? These issues have recently been extensively reviewed (3).
Effects of Radiation Dose on Cancer Risk
In summary, there is good epidemiological evidence of increased cancer risk for children exposed to an acute dose of 10 mSv (or higher), and for adults exposed to acute doses of 50 mSv (or higher) (3). As discussed below, relevant organ doses for CT exams are of the order of 15 mSv or less.
Extrapolation of Risks to Lower Radiation Doses
The issue here is how to estimate risks at doses somewhat (though not a great deal) lower than those for which there is statistically significant evidence of increased cancer risks. The current consensus (6) is that the measured risks can reasonably be linearly extrapolated to somewhat lower
doses, though as the dose of interest becomes progressively lower, the uncertainties inherent in this extrapolation become progressively greater. Relatively small extrapolations from epidemiological data are required (e.g., from 50 down to 15 mSv), however, to estimate cancer risks at the doses relevant to single CT examinations.
Effect of Dose Fractionation
If individuals receive multiple CT screenings over a period of years, the radiation dose will, of course, increase proportionately. The most likely case is that any radiation risks will also increase proportionately. Specifically, at high doses, theory (7), animal data (8), and epidemiological data (9), suggest that fractionating a radiation exposure decreases the overall risk at a given dose, but at the low doses of relevance here, both theory (7) and animal data (8) suggest that the risks are roughly independent of fractionation.
Effect of Age at Exposure
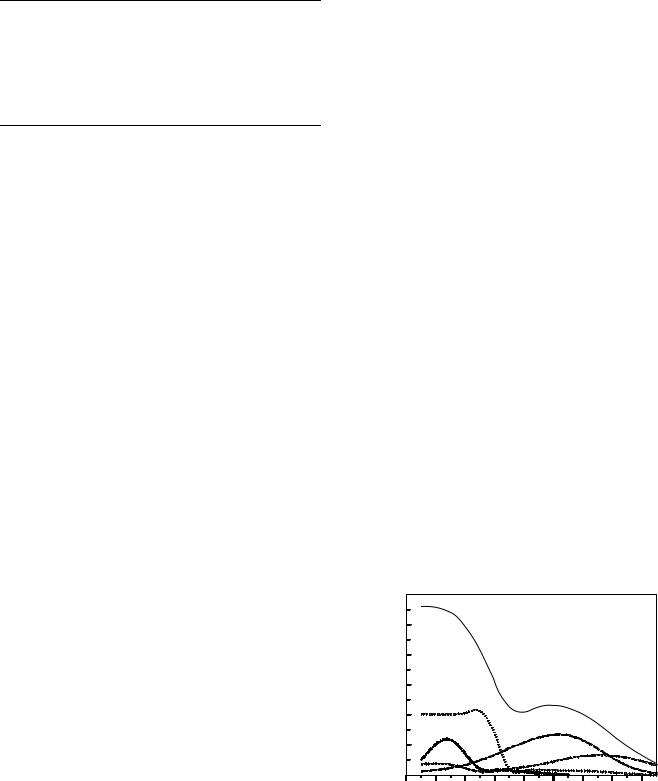
Regarding age at exposure, as can be seen in Fig. 3, radiation risks generally decrease markedly with age. The reason is because (a) sensitivity is related to the proportion of dividing cells in an organ, which decreases with increasing age; and (b) other competing risks play an increasing role with increasing age.
RADIATION DOSES FROM SCREENING CT
The radiation dose from CT scans depends on a number of factors: The most important are the tube current; the scan time; the pitch [For helical CT scans, the speed that the patient table moves relative to the rotation speed of the X-ray tubes–detectors will be an important determinant of the radiation dose; it is defined through the pitch, which is the linear table motion feed per 3608 rotation, divided by the total beam width (the slice width the number of detectors).]; the tube voltage; the number of detectors; and the particular scanner design (10). For a given CT scanner operating at a given voltage, the organ dose is
exposed |
150 |
|
|
|
|
|
|
|
|
125 |
|
|
|
|
|
|
|
|
|
|
|
|
|
|
|
|
|
|
|
5 |
|
|
|
|
|
|
|
|
|
mortality/10 |
100 |
|
|
Total |
|
|
|
|
|
|
|
|
|
|
|
|
|
||
75 |
|
|
|
|
|
|
|
|
|
|
Digestive |
|
|
|
|
|
|
||
cancer |
50 |
|
|
|
|
|
|
||
|
|
|
|
|
|
|
|
||
|
Breast |
|
|
Lung |
|
|
|
|
|
25 |
|
|
|
|
|
|
|
|
|
Excess |
|
|
|
Leukemia |
|
|
|
||
|
|
|
|
|
|
|
|||
0 |
|
|
|
|
|
|
|
|
|
|
|
|
|
|
|
|
|
|
|
|
0 |
10 |
20 |
30 |
40 |
50 |
60 |
70 |
80 |
Age at Exposure
Figure 3. Estimated radiation-related absolute cancer mortality risk per 105 individuals in the United States exposed at different ages to a whole-body dose of 10 mSv (63).
proportional to the mAs [current (mA) rotation time], and is inversely proportional to the pitch. It is always the case, however, that the relative noise in CT images will increase as the radiation dose decreases; thus there will always be a tradeoff between the need for low noise images and the desirability of using low radiation doses (11). As discussed later, the amount of noise that can be tolerated depends very much on the application. Thus, for example, more noise (i.e., lower doses) can probably be tolerated for virtual colonoscopy because of the radiological contrast of colonic polyps projecting into an air filled lumen), compared with whole-body screening (where most of the potential lesions show less radiologic contrast).
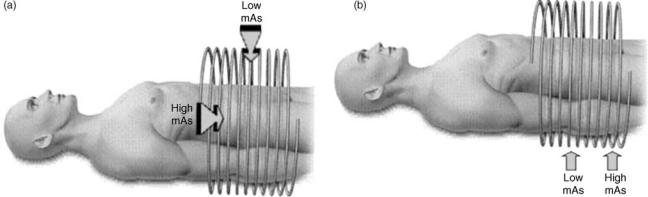
A relatively new and very promising radiation dose reduction technique for CT is automatic tube current modulation (Fig. 4) (12–15), now available from all the major scanner manufacturers: these systems continuously lower or raise the X-ray tube current to compensate for different instantaneous levels of attenuation of the X-ray beam by the patient. For example, when the beam is aimed in the posterior–anterior direction, fewer X rays are needed (for the same image quality) compared to the lateral–medial direction; or when the beam is passing through the region of the transverse colon, fewer X rays are needed compared to the pelvic bone region.
COMPUTED TOMOGRAPHY COLONOGRAPHY (VIRTUAL COLONOSCOPY)
There is no doubt (a) that colonoscopy-driven polypectomy can result in a significantly decreased incidence of colorectal cancer (16,17), and (b) that there is suboptimal compliance with current guidelines for colorectal cancer screening (18,19). Screening using CT colonography, often referred to as ‘‘virtual colonoscopy’’ (VC), was first suggested in 1983 (20), but has only recently become a potential option for mass screening (21–23).
In the most common current usage of VC, after bowel preparation, the colon is inflated with air or CO2, and the
COMPUTED TOMOGRAPHY SCREENING |
261 |
colon is CT scanned. The resulting data can then be analyzed for polyps, based on two-dimensional (2D) images, or using a 3D endoluminal view. Virtual colonoscopy is an excellent application of CT because of the radiological contrast exhibited by colonic polyps projecting into a gas-filled lumen (20,21,24), and a National CT colonography trial is underway in the United States.
Virtual colonoscopy may well have the potential to increase colorectal cancer screening compliance, largely because of the possibility that it can be performed with noncathartic preexamination bowel preparation. Current compliance with screening guidelines is clearly poor: At most, about one-third of adults >50 in the United States have had an endoscopic examination within the past 10 years (18,19).
From a technological perspective, VC is not quite ready for use in mass-screening programs. The three main outstanding issues, all of which seem relatively close to solution, are as follows:
1.The sensitivity and specificity of VC for detecting lesions in the size range from 5 to 10 mm: VC sensitivity and specificity for lesions >10 mm in diameter are generally well over 90% (about as good as those for conventional optical colonoscopy) (25). There is evidence that a well-designed VC screening program can achieve at least 90% sensitivity and specificity in the size category from 7 to 10 mm (22,26), but not all studies have achieved this (27).
2.The use of noncathartic preexamination bowel preparation regimens: In general it may be less the invasive nature of conventional colonoscopy that results in poor compliance, but more the necessity for cathartic bowel preparation (28–32). Virtual colonoscopy offers the potential for noncathartic bowel preparation, through the use of barium or iodinated tagging agents, which impart a high density to both stool and residual fluid, allowing increased contrast with soft-tissue polyps. Recent results with noncathartic VC have been very encouraging (23,33–35).
Figure 4. Principles of automatic tube current modulation: (a) Angular modulation, where the X-ray tube current is lowered as the X rays are aimed in the anterior–posterior directions, and increased when the X rays are aimed in the lateral–medial directions, when there will be more X-ray attenuation. (b) z-axis modulation where, for example, fewer X rays are required in the abdominal region superior to the pelvic bones, compared with the pelvic region.

262COMPUTED TOMOGRAPHY SCREENING
3.Optimization and standardization of CT parameters: Table 2. Typical Organ Doses and Estimated Additional
Just as mammographic examinations are now well standardized (36) and regulated (37), so VC should be optimized and standardized, if it is to be used for mass screening. Particularly until Points 1 and 2 are settled, it is probably premature to consider standardizing VC scanner parameters.
Absolute Lifetime Cancer Risks Associated with a Paired VC Screening Examination of a Healthy 50 Year Olda,b
|
Additional Absolute |
|
Lifetime Cancer |
Organ Dose from |
Risk because of |
Paired CTC |
Paired CTC Scans |
Scans,b mSv |
at Age 50, % |
If VC were to become a standard screening tool for the >50s, the potential ‘‘market’’ in the United States will soon be >100 million people. Even if the recommended VC frequency were to be that currently recommended for optical colonoscopy (every decade), this would imply that several million VC scans might be performed each year. Should the relative simplicity of the VC tests result in the recommended examination frequency being increased, then several tens of millions of these VC scans might be expected to be performed in the United States each year. It is pertinent, therefore to consider the radiation exposure and any potential radiation risk to the population from such a mass screening program.
Because of the advantageous geometry of a VC scan, the dose–noise tradeoff can be very much weighted toward low dose, higher noise images (24,25,38–40). Several studies have come to the conclusion that more noise (and thus a lower dose) can be accepted in a VC scan compared to other CT scans, while still maintaining sensitivity and specificity, at least for polyps greater than 7 mm in diameter (25,26,38,41,42).
It is important to note that, in general, paired VC exams are given, one in the supine and one in the prone position. Several studies have suggested that this technique improves colonic distention (43–45), decreasing the number of collapsed colonic segments.
Table 2 (46) shows estimated organ doses for one of the more common CT scanners (GE LightSpeed Ultra). The scanner parameters were taken from a recent Mayo Clinic study by Johnson and co-workers (26), and are toward the low dose end of published VC protocols (38). To provide an estimate of scanner-to-scanner dose variations, Table 3 (46) shows the radiation dose to the colon estimated for five of the more common CT scanners in use today, using identical scanner parameters in each case; the coefficient of variation of the dose to the colon is 20%.
It can be seen from Table 2 that typical organ doses are <20 mSv, even for organs directly in the X-ray beam, for example, the colon, stomach, bladder, and kidneys. The subcohort of 25,000 A-bomb survivors (5) that received comparable radiation doses (A-bomb dose range 5–50 mSv, mean 20 mSv) does show a slight increase in cancer mortality compared to the control population (4), but this increase is of marginal statistical significance ( p ¼ 0.15). It is also pertinent to point out that this A-bomb subcohort consists of individuals covering all age groups, and thus it is reasonable to assert that there is no direct statistically significant evidence from A-bomb survivor data that a single VC exam increases cancer risks in adults. It does not follow, of course, that the radiation risk is zero, rather that it is likely to be small. It also follows that there is persuasive evidence that a series of virtual colonoscopy examinations would result in increase in cancer risk due to the radiation exposure: The issue being how much of an
Colon (male) |
13.2 |
0.044 |
Colon (female) |
13.2 |
0.038 |
Bladder (male) |
16 |
0.025 |
Bladder (female) |
16 |
0.016 |
Stomach (male) |
14.8 |
0.013 |
Stomach (female) |
14.8 |
0.031 |
Kidney (male) |
16.1 |
0.012 |
Kidney (female) |
16.1 |
0.017 |
Liver (male) |
13.8 |
0.016 |
Liver (female) |
13.8 |
0.005 |
Leukemia (male) |
6.6 |
0.032 |
Leukemia (female) |
6.6 |
0.018 |
Lung (male) |
2.2 |
0.006 |
Lung (female) |
2.2 |
0.008 |
|
|
|
Total (male) |
|
0.15 |
Total (female) |
|
0.13 |
aSee Ref. 46.
bPaired VC examinations at 65 mAs, 120 kVp, 10 mm collimation, pitch 1.35.
increase and how it compares with the potential benefit of the VC screening.
Table 2 also shows the estimated absolute lifetime cancer risks associated with the radiation exposure from paired VC scans in a 50 year old (46). As expected, the main organs at risk are the colon, stomach, and bladder, as well as the leukemic cancers. All the estimated absolute radiation risks are relatively small, the largest being <0.05% (1 in 2000). Summed over all the organs at risk, the estimated absolute lifetime risk of cancer induction from a pair of VC scans (with the scanner parameters from Table 2) in a 50 year old is 0.14%, 1 in 700. Estimated risks for cancer mortality would, of course, be considerably less.
Several points need to be considered regarding the estimated risks in Table 2:
1.The risks are highly dependent on the scanner settings used, particularly the mAs and the pitch. The settings used in Table 2 are on the low dose side of
Table 3. Estimated Colon Doses from Paired VC Scans Using the Same Machine Settings with Different CT Scannersa
|
Colon Dose from Paired |
Scanner |
CTC Scans,b mSv |
|
|
GE LightSpeed Ultra |
13.2 |
GE QX/I, LightSpeed, LightSpeed Plus |
11.6 |
Phillips Mx8000 |
9.0 |
Siemens Volume Zoom, Access |
8.6 |
Siemens Sensation 16 |
7.6 |
aRef. 46.
bPaired VC examinations at 65 mAs, 120 kVp, 10 mm collimation, pitch 1.35.
those used in current reported studies (38), but there is good evidence (23,26,40) suggesting that the mAs and thus the dose could be decreased further, by at least a factor of 5 (and perhaps as much as a factor of 10) from these settings, while still maintaining sensitivity and specificity for polyps larger than 5 mm. Still further reductions of up to 50% in VC doses may be possible through the use of automatic tube current modulation (Fig. 4) (14,15), now available from all the major CT scanner manufacturers (14).
2.The estimated absolute cancer risks are highly age dependent. Thus, for example, the estimated radiation-associated absolute lifetime risk for colon cancer induction decreases from 0.044% for a VC scan at age 50 to 0.022% for a scan at age 70.
3.There are quantifiable uncertainties involved in the radiation risk estimates shown in Table 2. The largest is the uncertainties in ‘‘transferring’’ risk estimates from a Japanese population to a U.S. population, but there are also uncertainties associated with the extrapolation of risks from somewhat higher doses, where the risks are statistically significant, and uncertainties associated with the reconstructed dosimetry estimates at Hiroshima and Nagasaki (47). Based on Monte Carlo simulations of the various uncertainties (48), the upper and lower 90% confidence limits of the radiation risk estimates are about a factor of 3 higher and lower, respectively, than the point estimates.
In summary, because the geometry for VC is highly advantageous (soft-tissue polyps projecting into an air or CO2 filled lumen), it can be performed using lower radiation doses than almost any other CT examination. The cancer risks associated with the radiation exposure from VC are unlikely to be zero, but they are small. A best estimate for the absolute lifetime cancer risk associated with the radiation exposure using typical current scanner techniques is 0.14% for paired VC scans for a 50 year old, and about one-half of that for a 70 year old. These values could probably be reduced by factors of 5 or 10, with optimized protocols. Thus it seems clear that, in terms of the radiation exposure, the benefit/risk ratio is potentially large for VC.
LOW DOSE CT SCREENING FOR EARLY STAGE LUNG CANCER IN SMOKERS AND EXSMOKERS
Lung cancer is the number one cancer killer in the United States. Thus, there is increasing interest in the possibility of using low dose CT scans for annual screening of smokers and former smokers for early-stage lung cancer. In part, this is the result of the failure of earlier attempts to screen this population with conventional chest X rays (49). The logic is that these earlier screening modalities failed because of their inability to detect sufficiently small (typically <10 mm) lesions—and low dose lung CT has been demonstrated to have a greater sensitivity for detecting small pulmonary lesions (50). A National Lung Cancer Screening Trial is now underway (51).
COMPUTED TOMOGRAPHY SCREENING |
263 |
As with virtual colonoscopy, the geometry for lung CT is quite advantageous, and this allows the use of a relatively low dose (i.e., noisier) image, while still maintaining good sensitivity for detecting small pulmonary lesions (52).
The potential mortality benefits of lung cancer screening have been much debated (53–56), and it is fair to say that, at the very earliest, the issue will not be resolved until the completion of the National Lung Cancer Screening Trial in 2009. Several relatively small pilot studies have already taken place (50,56–60), suggesting that low dose lung CT does have the potential for detecting more early stage tumors than other lung screening modalities. Whether this represents a meaningful shift toward earlier detection of potentially fatal tumors, or whether it is largely associated with an overdiagnosis of nonfatal lesions, is yet to be established—as have the potential risks of invasive procedures resulting from false positives (61).
Less attention has been paid to the potential radiation risks, specifically radiation-induced lung cancer, associated with radiation from these CT scans. In part, this is because the screening technique involves ‘‘low dose’’, rather than standard, CT lung scans, and in part this is because excess relative risks of radiation-induced cancer generally decrease markedly with increasing age (62).
There are, however, several indications that the radiation risk to the lung associated with this screening technique may not be insignificant:
1.Cancer risks from radiation are generally multiplicative of the background cancer risk (63), which is, by definition, high for lung cancer in the target population here; this general observation has been born out in terms of the interaction between radiation and smoking, which most authors have suggested is nearmultiplicative (64–70) although an intermediate interaction between additive and multiplicative has also been suggested for radon exposure (71), and there is one report of an additive interaction (72).
2.As shown in Fig. 3, while radiation-related cancer risks generally decrease markedly with increasing age at exposure, radiation-induced lung cancer does not apparently show this decrease in risk with increasing age (62,63).
These considerations suggest that risk of radiationinduced lung cancer associated with the radiation from repeated low dose CT scans of the lung in smokers may not be negligible. A recent estimate (73) suggests that a 50 year old smoker planning an annual lung screening CT would incur an estimated radiation-related lifetime lung-cancer risk of 0.5%, in addition to their otherwise expected lung cancer risk of 14% (the radiation-asso- ciated cancer risk to any other organ is far lower). If 50% of the ever-smoking current U.S. population aged between 50 and 75 received annual CT screens, the estimated number of lung cancers associated with the radiation from these scans would be 14,000. These estimated risks set a baseline of benefit that annual CT screening must substantially exceed. This risk–benefit analysis suggests that mortality benefits from annual CT screening
264 COMPUTED TOMOGRAPHY SCREENING
of considerably >3% would be necessary to outweigh the potential radiation risks (73).
FULL-BODY CT SCREENING
There is increasing interest, particularly from independent radiology clinics, in the use of full-body CT screening of healthy adults (74–76). The technique is intended to be an early detection device for a variety of diseases including lung cancer, coronary artery disease, and colon cancer. At present, the evidence for the utility of this technique is anecdotal, and there is considerable controversy (77–79) regarding its efficacy: to date, no studies have yet been reported indicating a life-prolonging benefit (80). Because of the nature of the scan, the false positive rate is expected to be high (81), and a small study on full-body CT screening (80) found that 37% of those screened were recommended for further evaluation, whereas the overall evaluable disease prevalence is probably 2% (79). Other estimates suggest that the false positive rate may be as high as 90% (79).
Another aspect that is important in assessing the technique is the potential risk from the radiation exposure associated with full-body CT scans. Typical doses from a single full-body scan are 9 mGy to the lung, 8 mGy to the digestive organs, and 6 mGy to the bone marrow (82). The effective dose, which is a weighted average of doses to all organs (83), is 7 mSv. If, for example, five such scans were undertaken in a lifetime, the effective dose would be35 mSv, that is, five times larger. Note that even with the same settings different scanners will produce somewhat different organ doses. In particular, the estimated dose to the lung is 8.9 mGy for the Siemens scanner, 9.2 mGy for the Philips, and 12.2 mGy for the GE scanner (82). To put these doses in perspective, a typical screening mammogram (see Table 1) produces a dose of 2.6 mGy to the breast (36), with a corresponding effective dose of0.13 mSv (a factor of 50 times less).
It is important to note that these CT doses and the corresponding risk estimates are based on a particular published protocol (84). Even for the same CT settings, different scanners will produce different doses and therefore risks (varying by up to 50%). Full-body scan protocols are by no means standardized at this time, and larger mAs settings will result in correspondingly larger doses and therefore larger risks.
The estimated lifetime cancer mortality risks from a single full-body scan are 4.5 10 4 ( 1 in 2200) for a 45 year old, and 3.3 10 4 ( 1 in 3000) for a 65 year old. To put these values in perspective, the odds of an individual dying in a traffic accident in the United States during the single year 1999 were 1 in 5900 (85).
Of course, there is uncertainty in the radiation risk estimate: It is estimated (82) that the 95% credibility limits for the radiation risk estimate are about a factor of 3.2 in either direction: thus the lifetime risk from a full-body scan to a 45 year old could be as low as 1.4 10 4 or as high as 1.4 10 3. The dominant potential radiation-induced cancer is of the lung; this is not unexpected because, as illustrated in Fig. 3, while radiation-related cancer risks
generally decrease markedly with increasing age at exposure, radiation-induced lung cancer does not apparently show this decrease in risk until approximately age 55 (62,63,82).
The risk estimates for multiple scans, which would be necessary if full-body CT screening was to become a useful screening tool, are correspondingly larger. For example, a 45 year old who plans on undergoing 10 three-yearly fullbody scans would potentially accrue an estimated lifetime cancer mortality risk of 0.33% ( 1 in 300) (82). Again to give a comparison risk, this is comparable to the lifetime risk that a healthy 45 year old faces of dying of a brain tumor.
CONCLUSIONS
The increased availability and ease of use of CT scanners makes them attractive options for screening. The three CT screening modalities discussed here, virtual colonoscopy, lung screening, and full-body screening, are all comparatively new, and none have yet undergone definitive trials to assess their efficacy. However, both virtual colonoscopy, and low dose CT lung screening, but not full body screening, are currently undergoing national clinical trials in the United States and elsewhere. These trials should provide insight into the efficacy of virtual colonoscopy and low dose CT lung screening in terms of the potential mortality gain and the false positive rate. The trials will not, however, be able to assess the potential radiation risks, because of the long latency period between radiation exposure and development of a clinically recognizable malignancy. Nevertheless, because of the nontrivial doses associated with CT screening, the potential radiation risks will need to be factored into the overall risk–benefit analysis.
BIBLIOGRAPHY
1.Hounsfield GN. The E.M.I. scanner. Proc R Soc London B Biol Sci 1977;195:281–289.
2.Hounsfield GN. Computerized transverse axial scanning (tomography). 1. Description of system. Br J Radiol 1973;46: 1016–1022.
3.Brenner DJ, et al. Cancer risks attributable to low doses of ionizing radiation: assessing what we really know. Proc Natl Acad Sci USA 2003;100:13761–13766.
4.Preston DL, et al. Studies of mortality of atomic bomb survivors. Report 13: Solid cancer and noncancer disease mortality: 1950–1997. Radiat Res 2003;160:381–407.
5.Preston DL, et al. Effect of recent changes in atomic bomb survivor dosimetry on cancer mortality risk estimates. Radiat Res 2004;162:377–389.
6.NCRP, Evaluation of the linear-nonthreshold dose-response model for ionizing radiation, Report No. 136, NCRP; 2001.
7.NCRP. Influence of dose and its distribution in time on doseresponse relationships for low-LET radiations, in: NCRP Report No. 64, National Council on Radiation Protection and Measurements, Washington (DC); 1980.
8.Ullrich RL, Jernigan MC, Satterfield LC, Bowles ND. Radiation carcinogenesis: time-dose relationships. Radiat Res 1987; 111: 179–184.
9.Howe GR. Lung cancer mortality between 1950 and 1987 after exposure to fractionated moderate-dose-rate ionizing
radiation in the Canadian fluoroscopy cohort study and a comparison with lung cancer mortality in the Atomic Bomb survivors study. Radiat Res 1995;142:295–304.
10.McNitt-Gray MF. AAPM/RSNA Physics Tutorial for Residents: Topics in CT. Radiation dose in CT. Radiographics 2002;22:1541–1553.
11.Martin CJ, Sutton DG, Sharp PF. Balancing patient dose and image quality. Appl Radiat Isot 1999;50:1–19.
12.Lehmann KJ, Wild J, Georgi M. Clinical use of softwarecontrolled x-ray tube modulation with ‘‘Smart-Scan’’ in spiral CT. Aktuelle Radiol 1997;7:156–158.
13.Hundt W, et al. Dose reduction in multislice computed tomography. J Comput Assist Tomogr 2005;29:140–147.
14.Keat N. CT scanner automatic exposure control systems. Medicines and Healthcare Products Regulatory Agency, Report 05016, London; 2005.
15.Kalra MK, et al. Techniques and applications of automatic tube current modulation for CT. Radiology 2004;233:649–657.
16.Winawer SJ, et al. Prevention of colorectal cancer by colonoscopic polypectomy. The National Polyp Study Workgroup. N Engl J Med 1993;329:1977–1981.
17.Citarda F, et al. Efficacy in standard clinical practice of colonoscopic polypectomy in reducing colorectal cancer incidence. Gut 2001;48:812–815.
18.Seeff LC, et al. Patterns and predictors of colorectal cancer test use in the adult U.S. population. Cancer 2004;100:2093– 2103.
19.Subramanian S, Amonkar MM, Hunt TL. Use of colonoscopy for colorectal cancer screening: evidence from the 2000 national health interview survey. Cancer Epidemiol Biomarkers Prev 2005;14:409–416.
20.Coin CG, et al. Computerized radiology of the colon: a potential screening technique. Comput Radiol 1983;7:215–221.
21.Hara AK, et al. Detection of colorectal polyps by computed tomographic colography: feasibility of a novel technique. Gastroenterology 1996;110:284–290.
22.Pickhardt PJ, et al. Computed tomographic virtual colonoscopy to screen for colorectal neoplasia in asymptomatic adults. N Engl J Med 2003;349:2191–2200.
23.Iannaccone R, et al. Computed tomographic colonography without cathartic preparation for the detection of colorectal polyps. Gastroenterology 2004;127:1300–1311.
24.Hara AK, et al. Reducing data size and radiation dose for CT colonography. AJR Am J Roentgenol 1997;168:1181– 1184.
25.Macari M, et al. Colorectal neoplasms: prospective comparison of thin-section low-dose multi-detector row CT colonography and conventional colonoscopy for detection. Radiology 2002; 224:383–392.
26.Johnson KT, et al. CT colonography: determination of optimal CT technique using a novel colon phantom. Abdom Imaging 2004;29:173–176.
27.Cotton PB, et al. Computed tomographic colonography (virtual colonoscopy): a multicenter comparison with standard colonoscopy for detection of colorectal neoplasia. JAMA 2004;291: 1713–1719.
28.Weitzman ER, Zapka J, Estabrook B, Goins KV. Risk and reluctance: understanding impediments to colorectal cancer screening. Prev Med 2001;32:502–513.
29.Ristvedt SL, McFarland EG, Weinstock LB, Thyssen EP. Patient preferences for CT colonography, conventional colonoscopy, and bowel preparation. Am J Gastroenterol 2003;98: 578–585.
30.Akerkar GA, Yee J, Hung R, McQuaid K. Patient experience and preferences toward colon cancer screening: a comparison of virtual colonoscopy and conventional colonoscopy. Gastrointest Endosc 2001;54:310–315.
COMPUTED TOMOGRAPHY SCREENING |
265 |
31.Harewood GC, Wiersema MJ, Melton LJ, 3rd. A prospective, controlled assessment of factors influencing acceptance of screening colonoscopy. Am J Gastroenterol 2002;97:3186– 3194.
32.Gluecker TM, et al. Colorectal cancer screening with CT colonography, colonoscopy, and double-contrast barium enema examination: prospective assessment of patient perceptions and preferences. Radiology 2003;227:378–384.
33.Callstrom MR, et al. CT colonography without cathartic preparation: feasibility study. Radiology 2001;219:693–698.
34.Lefere PA, et al. Dietary fecal tagging as a cleansing method before CT colonography: initial results polyp detection and patient acceptance. Radiology 2002;224:393–403.
35.Zalis ME, Perumpillichira J, Del Frate C, Hahn PF. CT colonography: digital subtraction bowel cleansing with mucosal reconstruction initial observations. Radiology 2003;226: 911–917.
36.Kruger RL, Schueler BA. A survey of clinical factors and patient dose in mammography. Med Phys 2001;28:1449–1454.
37.Monsees BS. The Mammography Quality Standards Act. An overview of the regulations and guidance. Radiol Clin N Am 2000;38:759–772.
38.van Gelder RE, et al. CT colonography at different radiation dose levels: feasibility of dose reduction. Radiology 2002;224: 25–33.
39.Hara AK, et al. CT colonography: singleversus multi-detector row imaging. Radiology 2001;219:461–465.
40.Iannaccone R, et al. Detection of colorectal lesions: lower-dose multi-detector row helical CT colonography compared with conventional colonoscopy. Radiology 2003;229:775–781.
41.Taylor SA, et al. Multi-detector row CT colonography: effect of collimation, pitch, and orientation on polyp detection in a human colectomy specimen. Radiology 2003;229:109–118.
42.Wessling J, et al. CT colonography: Protocol optimization with multi-detector row CT—study in an anthropomorphic colon phantom. Radiology 2003;228:753–759.
43.Chen SC, Lu DS, Hecht JR, Kadell BM. CT colonography: value of scanning in both the supine and prone positions. AJR Am J Roentgenol 1999;172:595–599.
44.Morrin MM, et al. CT colonography: colonic distention improved by dual positioning but not intravenous glucagon. Eur Radiol 2002;12:525–530.
45.Fletcher JG, et al. Optimization of CT colonography technique: prospective trial in 180 patients. Radiology 2000;216: 704–711.
46.Brenner DJ, Georgsson MA. Mass screening with CT colonography: Should the radiation exposure be of concern? Gastroenterology 2005;129(1):328–337.
47.NCRP. Uncertainties in fatal cancer risk estimates used in radiation protection. Report 126, National Council on Radiation Protection and Measurements, Bethesda, MD; 1997.
48.Land CE, Gilbert E, Smith JM. Report of the NCI-CDC Working Group to Revise the 1985 NIH Radioepidemiological Tables. NIH Publication 03-5387. See also, available at www.irep.nci.nih.gov, NIH, Bethesda (MD); 2003.
49.Fontana RS. The Mayo Lung Project: a perspective. Cancer 2000;89:2352–2355.
50.Henschke CI, et al. Early lung cancer action project: Overall design and findings from baseline screening. Lancet 1999;354: 99–105.
51.Vastag B. Lung screening study to test popular CT scans. JAMA 2002;288:1705–1706.
52.Rusinek H, et al. Pulmonary nodule detection: low-dose versus conventional CT. Radiology 1998;209:243–249.
53.Aberle DR, et al. A consensus statement of the Society of Thoracic Radiology: screening for lung cancer with helical computed tomography. J Thorac Imaging 2001;16:65–68.