

COGNITIVE REHABILITATION. See REHABILITATION,
COMPUTERS IN COGNITIVE.
COLORIMETRY
LI-JIUAN SHEN
National Taiwan University
Taipei, Taiwan
RICHARD MANDEL
Boston University
Boston, Massachusetts
WEI-CHIANG SHEN
University of Southern
California,
Los Angeles, California
INTRODUCTION
Light can be characterized as a wave with frequency and wavelength l. This wave has energy E, which is proportional to its frequency
E ¼ hc=l ¼ hn
where h is Planck’s constant and c is the velocity of light. When such a wave of light encounters a molecule, it will either be absorbed (i.e., its energy will be transferred to the molecule) or scattered (i.e., its direction of propagation will be changed). The probability of occurrence of each process will depend on the nature of the molecule encountered. If the electromagnetic energy is absorbed, the molecule is said to be excited. A molecule or part of a molecule that can be excited by absorption is called a chromophore. The absorption of light generally excites the electrons of the molecule or chromophore from its ground electronic state to one of its excited electronic states. Absorption of light is likely to occur if the energy of the light is equal to the difference in the energy between the ground (E8) and excited (E ) electronic state.
l ¼ hc=ðE E Þ
These transitions have rather diffuse energies because excited states occur in both the vibrational and rotational as well as electronic states, giving rise to broadened energy ranges. A plot of the probability of absorption versus wavelength is called an absorption spectrum. The excitation energy is usually released as radiant energy in the form of kinetic energy and heat. Under certain conditions, some molecules rapidly reemit their energy as visible or ultraviolet (UV) light. This is known as fluorescence.
The wavelengths that give rise to electronic transitions in molecules are generally in the visible (700–400 nm) and UV (400–200 nm) region. These transitions are often characteristic of specific molecules and can be used to assay biological and biochemical samples. Transitions at longer wavelengths and lower energies in the infrared (IR) or near-infrared (NIR) generally correspond to excitation of vibrational states alone and are characteristic of specific functional groups such as carbonyl oxygen bonds or carbon–carbon bonds. Even though this region of the absorption spectrum does not find many biomedical
COLORIMETRY 187
applications, IR and NIR spectroscopy have been used for qualitative and quantitative analysis of different forms (crystal and amorphous) of pharmaceutical solids (1,2). It is further developed into an on-line process monitoring and control entitled process analytical technology (PAT) by the collaboration of U. S. Food and Drug Administration (FDA) and the pharmaceutical industry (3). On the other hand, transitions at shorter wavelengths and higher energies, in the vacuum UV and X-ray region, cannot be carried out on biological samples in aqueous solution and have limited usefulness in biomedical assays.
The probability of light absorption at a single wavelength is described by the Beer–Lambert law. It has been observed that the passage of light through any given thickness of any substance results in the absorption of a constant fraction of that incident light. In differential form, this equation can be written
dI=I ¼ KCdl
where dI/I is the fraction of light absorbed by a layer of thickness dl, K is a constant that depends on the properties of the substance, and C is the concentration of the absorbing substance. Thus, for a given beam of light passing through a sample of finite thickness, the amount absorbed at each point in that sample is proportional to the incident intensity at that point. If, for example, in the first millimeter of passage through a sample 50% of the light is absorbed, then in the second millimeter of passage 50% of the remaining light or 25% of the initial intensity will be absorbed, and in the third millimeter 50% of the remainder or 12.5% of the initial intensity will be absorbed. In total, 87.6% of the incident light beam will be absorbed by the 3 mm path length. Mathematically, this is calculated by integrating the above equation, which yields
lnðI0=IÞ ¼ K0Cl or I=I0 ¼ 10 K0Cl
where K0 ¼ K/2.303, l is the path length, I0 is the initial intensity, and I the final intensity of the light beam after having passed the sample. The left-hand side of the equation defines the optical density and is a useful quantity, because it is directly proportional to the concentration of the absorbing substance and the path length. Absorbance, also called optical density (OD), is designated by A. The transmittance of a solution, designated T, is the fraction (I/I0) and is related to the absorbance by
A ¼ log T
In the above example, the absorbance through a single millimeter path length is log 0.5 ¼ 0.301, while the total absorbance through 3 mm is 3 0.301 ¼ 0.903 ¼ log 0.125.
A plot of absorbance as a function of concentration (called a Beer’s law plot) is ideally a straight line, while a plot of transmittance is a hyperbolic curve (Fig. 1). Deviations from linearity will be discussed below. Absorbance is a unitless quantity. Therefore, the constant (K0) in the above equation must be in units of reciprocal concentration and reciprocal length (typically cm 1 M 1). The absorbance is proportional to both concentration and

188 COLORIMETRY
(a) |
(b) |
Figure 1. Plots of concentrations versus (a) transmittance (A) and (b) absorbance (B).
length of light path, while the constant specifies a characteristic property of the absorbing chromophore. This constant, which is a function of wavelength, is called the absorption coefficient or extinction coefficient of the material. Absorption coefficients may be expressed on either a weight or a molar basis. The molar extinction coefficient, designated by e specifies the total absorption of a 1 M solution through a 1 cm path length. A molar extinction coefficient of 10,000 or greater is characteristic of a strongly absorbing substance.
Plots of absorbance as a function of concentration are linear if the absorbing chromophore remains the same over the concentration range studied, the chromophore is uniformly distributed, and the orientation of dichroic absorbers (i.e., substances having directional asymmetry) is random. Changes in the nature of the chromophore with concentration, such as ionization, hydration, aggregation, or disaggregation, will alter the absorption spectrum of the solution. There are no general rules as to whether the absorption will increase or decrease. An example of an absorption change resulting from molecular interactions is that of deoxyribonucleic acid (DNA). When the absorption of a solution of native DNA is compared with that of the same concentration of DNA bases, the DNA shows a 30– 40% lower extinction coefficient at the 260 nm peak. Heating of the DNA to disrupt the orderly stacking of the bases in the double helix raises the extinction coefficient to that of its constituent bases. The DNA is said to be hypochromic with respect to its bases, while heating of the DNA is said to display a hyperchromic effect. This principle is also widely applied to determine the thermodynamic parameters of nucleic acids using colorimetric measurements. Often some parts of the spectrum will show increased absorbance and other parts will show decreased absorbance. In such a case and when there is an equilibrium between two different molecular forms, there will always exist a wavelength that shows invariant absorption. This point, known as an isobestic point, can be used to quantify concentration of compounds that can exist as different molecular forms. For example, phenol red changes from a protonated to an ionized form between pH 6 and 8, with a switch of the absorption wavelength from 432 (yellow) to 559 nm (red). The absorption at 479 nm, the isosbestic point, is constant regardless the molecular form of this compound and, therefore, this wavelength can be used to measure the concentration of phenol red without a concern to the pH of the solution (Fig. 2).
pH 8
Absorbance |
pH 6 |
|
pH 7 |
|
|
|
|
||
|
|
|
|
|
|
pH 7 |
|
|
|
|
pH 8 |
|
|
|
|
|
|
pH 6 |
|
|
400 |
500 |
600 |
700 |
|
|
Wavelength (nm) |
|
|
Figure 2. Absorption wavelength of phenol red under various pH conditions. A constant absorption wavelength is shown here at 479 nm, which is the isosbestic point.
Non-uniform distributions of chromophore in solution will lead to decreased absorption. This is most readily understood by considering a situation in which one-half of the cross-section of a light beam goes through a transparent solvent, while the other one-half traverses an absorbing solution. Even if the solution is totally absorbing, at least one-half of the light will be transmitted through the sample leading to a limiting absorbance of log(I/I0) ¼ log 2 ¼ 0.301. Thus, a plot of absorbance versus concentration will lead to a curve asymptotically reaching 0.301 as the concentration increases. An example of nonuniform distributions leading to changed absorbance is illustrated by the absorption of Acridine Orange in the presence of cellular organelles. Acridine Orange is a weak base that accumulates in acidic cellular compartments, such as endosomes, lysosomes, and Golgi. When it is concentrated in such organelles, the apparent absorbance of the solution decreases. Since the acid gradient is generated by a membrane-bound enzyme that requires adenosine triphosphate (ATP) as its energy source, addition of ATP to a subcellular suspension containing Acridine Orange will cause a decrease in absorption. In this way, changes in the absorbance of Acridine Orange can be used to monitor the activity of the ATPase (4).
The most common biochemical or clinical use of the absorption properties of chromophores is to measure concentration. In brief, the absorption spectrum, that is, a graph of absorbance as a function of wavelength, is recorded from which a suitable wavelength is chosen. Generally, the wavelength chosen is at or near the peak in absorption of the chromophore. This maximizes the sensitivity of the absorption measurement and decreases possible error resulting from incorrect wavelength calibration of the instrument. Other wavelengths may be chosen if another chromophore present in the solution interferes with the measurement. The extinction coefficient is determined, or a calibration curve of the absorbance is run at a number of different concentrations of chromophore. Concentration is determined by weighing a standard or from the extinction coefficient, if it is accurately known. The plot
is examined for linearity. Subsequent concentrations can be determined either directly from the extinction coefficient or from the calibration curve of absorbance versus concentration. For example, the concentration of DNA can be readily determined by measuring the absorbance of a solution at 260 nm. At this wavelength, an absorbance of 1.0 corresponds to a concentration of 50 and 33 mg mL 1 for doubleand single-stranded DNA, respectively, at a 1 cm path length.
Different substances can often be distinguished by the use of spectrophotometric measurements if they exhibit different absorption spectra. In an ideal solution, we can assume that the total absorption at any wavelength, is equal to the sum of the individual absorptions. This principle has been used to determine the protein and nucleic acid content of cell extracts and cell fractions or to assess the purity of nucleic acids. At 260 nm, ribonucleic acid (RNA) has a peak absorption of 50.8 mL mg 1 cm 1 , while at 280 nm, its absorption is 24.8. Proteins containing an average proportion of aromatic amino acids have a small peak of 2.06 mL mg 1 cm 1 at 280 nm, which decreases to 1.18 mL mg 1 cm 1 at 260 nm (5). By comparing the ratio of absorbance at these two wavelengths, the relative RNA and protein concentration can be determined. The method assumes that the total absorbance at 260 and 280 nm is due to the sum of the absorbances of the constituent protein and nucleic acid. Solving the simultaneous equations yields the concentrations as follows:
Protein concentration (mg/mL)
¼ 0:674 A280 0:33 A260
Nucleic acid concentration (mg/mL)
¼ 0:016 A280 þ 0:027 A260
This relationship varies for different proteins and nucleic acids. For accurate work, a calibration must be carried out to determine the actual coefficients for the samples studied. For an accurate determination, specific reagents can selectivelyreactwithDNA,RNA,andprotein,respectively,forits own quantification to avoid the interference from each other (6,7). For example, the bicinchoninic acid (BCA) assay, Coomassie Blue-G 250 dye binding assay (the Bradford), and the Lowry method are commonly used colorimetic methods for protein quantification (7).
Sometimes samples consist of light-absorbing particles in suspension rather than molecules in solution. For example, while many bacteria do not have chromophores that absorb visible light, suspensions consisting of intact bacteria display apparent absorption due to the scattering of light (Rayleigh scattering). Rayleigh equation demonstrates the reciprocal forth-power relationship between light scattering intensity and wavelength. This apparent absorption has been used to quickly measure bacterial or viral concentrations. A calibration curve is determined by comparing absorbance with viable cell count. For example, the concentration of Salmonellatyphimurium in suspension can be determined from the absorption at 440 nm, since the absorption is linear with concentration such that 1.07 108 bacteria mL 1 yields an apparent absorbance of
COLORIMETRY 189
1.0, for a 1 cm path length. Methods that utilize the apparent absorption of scattering solutions are often referred to as turbidimetry. Turbidimetric methods can also be used to monitor the kinetics of enzymatic processes that cause changes in the level of light scattering. For example, the enzyme rennin will coagulate milk, leading to an increase in its scattering (monitored at 600 nm) (8). The initial rate of change of apparent absorbance can therefore be measured and used to determine the concentration of active enzyme added. In some cases, the material being measured consists of light-absorbing particles in suspension with chromophores. For example, the absorbance of bacteriophages is primarily due to DNA. Since scattering always begins at wavelengths removed from the absorption, its contribution can be subtracted by measuring the absorbance at longer wavelengths than that of the chromophore and by linearly extrapolating the scattering from the absorption peak. For kinetic measurements on scattering solutions, difference spectra are often used, where the wavelengths are chosen such that one is at the chromophore maximum, while the other is at wavelengths where the only absorption is due to scattering. Specialized instruments that allow for absorbance measurement at two different wavelengths simultaneously are required for such measurements.
Most of the approaches to detect specific DNA sequence are expensive and time-consuming, such as fluorescent microarrays. An inexpensive and rapid assay for the identification of DNA sequence and single nucleotide polymorphisms has been recently described by using a colorimetric method with nanotechnology (9). In this assay, the color of negatively charged gold nanoparticles (Au-nps) is very sensitive to the degree of aggregation. Singlestranded DNA can stabilize Au-nps and prevent the saltinduced aggregation. This method has been applied into clinical samples and successfully identified the relationship between a specific gene and a fatal arrythmia (9).
Due to the contribution of nanotechnology, Au-nps can be utilized as ideal color reporting groups as the colorimetric biosensors. For example, it can provide the qualification and quantification of Pb2þ(10), and the detection of polynucleotides (11).
INSTRUMENTATION
Presently, most colorimetry is done using spectrophotometers rather than colorimeters. In principle, spectrophotometers and colorimeters are similar, with the latter being very simple and inexpensive versions of spectrophotometers. Both instruments consist of a light source, a means of selecting wavelength, a sample compartment, and a detector of transmitted light, as shown in a singlebeam spectrophotometer (Fig. 3). The source generally consists of an incandescent tungsten lamp for measurements in the visible range between 350 and 700 nm and a hydrogen deuterium, or xenon arc lamp for measurements in the UV range down to 190 nm. Thermal lens spectrophotometry, a new high sensitivity method utilizes a laser as its source (12). A stabilized current is generally provided, especially for measurements in the UV range to
190 COLORIMETRY
Figure 3. A single-beam spectrophotometer.
prevent fluctuations in the intensity of the lamp. Light from the lamp is collimated or focused by a lens onto a wavelength selector. In the case of the simplest colorimeters, the wavelength selector is a broadband filter that yields a distribution of wavelengths with a width of40 nm. In spectrophotometers and more sophisticated colorimeters, the wavelength is chosen with a monochromoter by either reflecting the beam off a grating or by passing it through a prism. In a spectrophotometer, the bandwidth of light can be set by adjusting the exit slit. As the slit opening decreases, the light incident on the sample decreases, but the spectral resolution improves. Excessively wide bandwidth can lead to decreased peak absorption and interference from other substances absorbing at nearby wavelengths. In a colorimeter, the bandwidth is fixed, depending on the properties of the filters. While it is possible to obtain narrow bandpass filters if necessary, they may cost as much as the colorimeter.
The monochromatic light is then focused on the sample, contained in a transparent rectangular cuvette, a test tube, or a microplate with 6–384 wells. In some spectrophotometers, the sample compartment has been designed to accommodate with 96–1536-well microplate for high throughput screening (13). Colorimeters generally use test tubes made of any clear materials, such as glass or plastics, as long as they allow any required chemical reactions to be carried out in the same disposable container in which the measurement is carried out. Spectrophotometers and automated colorimeters designed to determine large numbers of samples usually hold rectangular cuvettes and microplates. These are generally made of glass or plastics for measurements within visible light wavelengths, and of quartz for measurements < 350 nm in the UV range. The transmitted light is incident on a phototube that records the intensity of the light reaching it. Some spectrophotometers are double-beam instruments, which electro-
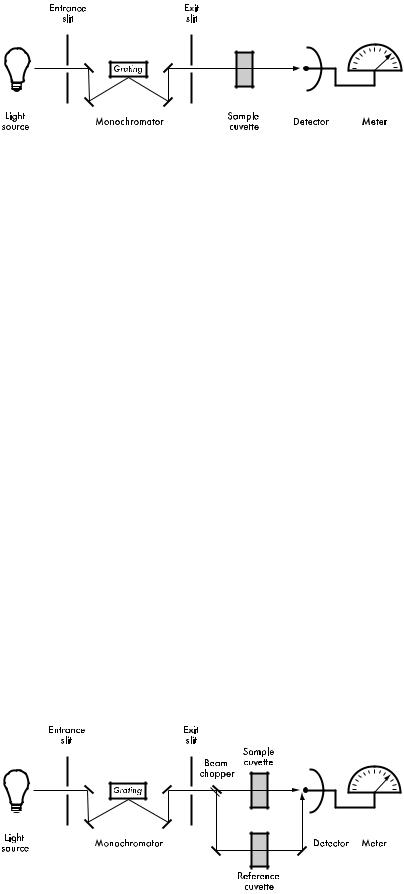
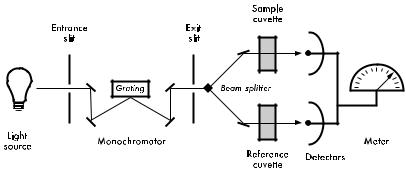
nically subtract an absorption blank. There are two types of the double-beam spectrophotometers. One is called the double -beam in-time spectrophotometer (Fig. 4). In this instrument, a single beam of light from the monochromator is alternately switched between the sample and the reference cuvettes. The two alternate beams then reach a single detector in separate time to provide an alternating signal with an amplitude that is proportional to the difference of the light intensities between the sample and the reference. The other type is called the double-beam in-space spectrophotometer (Fig. 5). In this instrument, two separate light pathways are created by a beam splitter and mirrors. One beam passes through the sample cuvette, and the other beam the reference cuvette. The light intensities of the sample and the reference cuvettes are measured by two separate detectors and the difference is recorded as the absolute photometric measurement.
Many spectrophotometers are still designed as singlebeam instruments (Fig. 3); the solvent absorption is separately determined, stored, and subtracted by an interfaced microcomputer. In colorimeters and other single-beam instruments, the absorption is set to zero or the transmission is set to 100% when the reference blank is placed in the sample compartment. The detector is designed to give a direct reading of either transmission or absorbance. The newer spectrophotometer is a multifunctional instrument with a triple-mode cuvette port and microplate reading capability. The detection modalities include absorbance, fluorescence intensity, fluorescence polarization, timeresolved fluorescence, and luminiscence. With a dualmonochromator, the filters for specific wavelengths are not required in these spectrophotometers. (e.g., SpectraMax M5 by Molecular Devices Corp.). The function of spectrophotometer also has improvement in the rate of data acquisition. It can be as fast as 50 ms, which is beneficial in rapid kinetics.
Figure 4. A double beam in-time spectrophotometer.
COLORIMETRY 191
CLINICAL APPLICATIONS OF COLORIMETRIC METHODS
Colorimetry has seen wide applications in clinical and medicinal chemistry and in biochemistry. Colorimetric methods are used to measure concentration or enzyme activity. Lately, colorimetric methods are also applied in genomics and proteomics research, such as the single nucleotide polymorphism analysis (14), the detection of protein microarrays (15), and so on. The concentration of a substance can be determined directly and immediately if the unknown has a distinct absorption band that does not overlap other substances in the assay mixture. If not, the unknown may be analyzed indirectly on completion of one or more chemical reactions, yielding a colored compound with a definite stoichiometric relationship to the unknown compound. The reaction must be rapid and specific and must react completely with the unknown to be of use. In contrast to quantitative measurements, kinetic measurements determine initial reaction kinetics by the rate of appearance of an absorbing product or by the rate of disappearance of an absorbing reactant. Kinetic measurements are carried out either directly by monitoring changes in the absorption of substrates or cofactors or indirectly by coupling a second, third, or additional enzyme reactions to the primary one. Each of these cases will be discussed and illustrated later.
Due to the development of new automated diagnostic instruments, the manual colorimetric assays have become less useful in most clinical laboratories. However, most tests performed in automated instruments are based on simple colorimetry. Therefore, the principles in colorimetry are essential for the improvement and development of new automated assays. Furthermore, manual colorimetric methods are still used in handling small numbers of samples, such as in small clinical laboratories or for special diagnostic purposes.
There are several general precautions that should be taken in colorimetric measurements of clinical samples. These are as follows:
1.Sample preparation. Most clinical samples (e.g., blood and urine) contain a large amount of components other than the analyte. The results of the test are only meaningful if the background reading of the sample has been subtracted. The background must be obtained by using proper controls. Usually, when a measurement is made by the addition of a reagent, an identical sample without the reagent can be used as a
Figure 5. A double-beam in-space spectrophotometer.
control or blank. When an enzyme activity is measured, a control or blank can be obtained by excluding the specific substrate or by including a specific inhibitor for the enzymatic reaction. Because of instability, many specimens must be handled immediately after they reach the laboratory and cannot be stored. The turbidity of a sample will cause false readings in colorimetry. This problem generally can be eliminated either by centrifugation, filtration, or comparing with identical controls.
2.Buffer solutions. The absorbances, especially in the visible wavelength range, are usually pH dependent. Furthermore, the type and concentration of ions in the buffer may also influence the absorbance of a molecule or the rate of reaction. Therefore, careful attention must be paid to the solvent and buffer system. In addition, the rates of enzymatic reactions are highly pH dependent. It is therefore important to choose a buffer with an ionization potential (pK) appropriate to the optimal pH for the assay. For example, imidazole or triethanolamine buffer is commonly used in the pH range of 6.5–7.0.
3.Temperature. Kinetic measurements use enzymes to catalyze the reactions of intensely colored substances. Enzymatic reactions are highly temperature d- ependent. It is therefore necessary to use isothermal control when carrying out such assays. If not, it is necessary to know precisely the reaction temperature. If the reaction is carried out in the colorimeter, care must be taken to ensure that the temperature of the reaction mixture is not affected by the heat produced in the sample chamber.
4.Inhibitors. Enzymatic reactions are subject to competitive inhibition or to the action of specific i- nhibitors leading to apparent decreases in the measured activity or concentration of the unknown. It is therefore extremely important to eliminate these i- nterfering substances or to include the proper controls during the assay. In cases of product inhibition, the initial rate should be used for the determination of the enzymatic activity.
In the following sections, several colorimetric measurements of clinical importance will be discussed. They are used primarily as examples to indicate the standard procedures of colorimetry in clinical laboratories. The number
192 COLORIMETRY
of applications of colorimetry is too vast to present an extensive survey in this article.
Quantitative Measurement
Direct Measurement. Direct colorimetric measurement for quantitative assays are limited to very few cases in which the compound of interest itself has an intense absorption and in which there is no interference from other components in the samples. One example is the determination of hemoglobin in blood. Since oxygenated and deoxygenated hemoglobins, carboxyhemoglobin, and hemoglobin derivatives have different absorption spectra, the concentration of a specific type of hemoglobin, as well as the oxygen-binding capacity, can be determined by measuring the ratio of absorption (A) at two different wavelengths (16) (e.g., A562: A540 for carboxyhemoglobin and
A560: A506 or A650: A825 for oxygen-binding capacity), similar to that described above for the protein–nucleic acid
measurement.
Bilirubin measurement in blood samples can also be done by direct measurement at 460 nm (17). The absorbance is compared with that of a standard solution of potassium dichromate and is reported in term of units of icterus index. One unit of icterus is equivalent to a 1:10,000 solution of potassium dichromate. This determination is only approximate, because there are many other components in blood, mostly carotenoid pigments, which will interfere with the readings.
Indirect Measurements
Complex Formation. One of the most common applications of colorimetry is in the determination of protein concentration. Colorimetric determination of the total serum protein by the Biuret reaction is still used in many clinical laboratories. In this method, proteins react with copper sulfate in alkaline solution to form a Biuret complex that can be determined by the intensity of the violet color with an absorption at 555 nm (18). The Biuret reaction is a relatively straightforward, precise, and accurate method. Usually, 0.1 mL serum is added to 5 mL of Biuret Reagent solution, which contains sodium, potassium tartrate, potassium iodide, and copper sulfate in 0.2 M NaOH. After incubation at 30–32 8C for 10 min or at room temperature for 20 min, the reaction mixture is read at 555 nm. The sample absorbance is generally compared to human or bovine serum albumin (BSA) standards. The color of the Biuret complex is stable for several hours after it reaches the maximum intensity. The measurement of protein by Biuret measurement is subject to interference by other substances in serum. In serum separated from moderately hemolyzed blood or serum with high bilirubin content potassium cyanide is usually included in the reaction mixture to correct the difference. Dextrans may also interfere by causing turbidity. For these determinations, appropriate blanks should be used instead of just saline or water, as described in most general procedures.
Many other methods use nearly colorless chemical reagents that complex with the protein to form highly colored compounds. One of them, the Lowry method (19),
is the single most utilized assay in biochemistry research and is the most cited reference in the biochemical literature. However, it is not widely used in clinical applications. A variety of dyes, which form strong binding complexes with protein, is also used to quantitate protein concentration. For example, Coomassie Brilliant Blue R-250 is commonly used to visualize and quantify proteins in gels separated by electrophoresis and to quantify proteins eluted from gels (20). To visualize proteins, gels are stained with dye in 50% methanol–10% acetic acid solvent, after which excess dye is removed by the solvent. To accurately quantitate protein concentration, dye bound to protein is removed by electroelution or chemical elution, and absorbance of the solutions at 595 nm is measured. Coomassie Brilliant Blue stained electrophoresis gels are quantitated by direct scanning colorimetry at the same wavelength. This dye is most useful to quantify proteins present in the amount range of 0.5–50 mg. The binding of silver to protein has been used to visualize and to quantitate proteins separated in gels (21). While this method is100 times more sensitive than Coomassie Brilliant Blue staining, it is also much more expensive due to the cost of the silver reagent. Recently, several visible dyes have been developed for the staining of protein in electrophoresis (22). Many of them can reach the sensitivity at the ng level, and some of them, such as 3, 30-diethyl-9-methyl- 4,5,40,50-dibenzothiacarbocyanine (Stain-All), can simultaneously stain DNA and RNA with the appearance of different colors.
A complex between the dye, Methylene Blue, and protein has been used to quantitate the growth of cells in culture and their inhibition by cytotoxic drugs. Cultures are stained, destained, then solubilized overnight in a 1% aqueous Sarkosyl solution, and quantified at 620 nm. This assay can be automated by using 96-well microtiter plates and commercially available spectrophotometers designed for enzyme-linked immunosorbent assays (ELISA) (23). The dye complex can also show specificity and can be used to assay a single protein in a specimen. For example, serum albumin can be determined by its high affinity binding to Bromocresol Green (24).
Another important colorimetric method by complex formation in clinical laboratories is the measurement of metal ions by chelators. For example, serum iron levels are measured by the complex formation between ferrous and ferrozine. Serum iron can be determined either with or without the removal of proteins by trichloroacetic acid precipitation. Ferric is usually reduced to ferrous by ascorbic acid. The complex of Fe2þ-ferrozine has a dark violet color with an absorbance at 562 nm. Advantages of this method are its simplicity, sensitivity (molar absorbance ¼ 27,900), and the constant absorbance in a wide range of pH (from pH 4–10) (25).
Colorimetry is commonly used for water testing, including specific impurities, such as ammonia, calcium, chlorine, copper, iron, nitrite, phenol, phosphate, sulfate, and sulfide, or total hardness. These tests are available in kit form and can be used with portable colorimeters for field testing. The methods generally utilize either complex formation or derivatization of the inorganic impurity to yield a highly colored compound.
Derivatization. Besides complex formation, substances can be detected colorimetrically after chemical modification to give colored products. One example is the diazotization of bilirubin. As mentioned previously, the direct measurement of bilirubin by its yellow color is inaccurate, because there are many pigments in serum that can interfere with the detection. For a more reliable assay, bilirubin is reacted with diazotized sulfanilic acid to give azobilirubin, which is red-violet in moderately acid solution and blue in strongly acid or alkaline solution. Most of the methods currently used in clinical laboratories (e.g., the Jendrassik–Grof method and the Malloy–Evelyn method) are based on this diazotization reaction.
Bilirubin exists in serum in two forms, the glucuronideconjugated and the free form. The conjugated form (clinically known as ‘‘direct bilirubin’’) is more soluble in water and can be detected by a direct reaction with the diazo reagent. The free form (clinically known as ‘‘indirect bilirubin’’) is less soluble in water and can be detected by diazo reagent only if other reagents are also included. In the Malloy–Evelyn method, ethanol is added to increase the solubility of free bilirubin. In the Jendrassik–Grof method, caffeine–benzoate is added to displace serum proteinbound bilirubin. Therefore, both free and conjugated bilirubin can be detected by the diazo reagent. The Jendrassik– Grof method is generally considered the method of choice for the measurement of bilirubin in most clinical laboratories (26). The diazo reagent in this method is a mixture of sulfanilic acid and sodium nitrite in hydrogen chloride. This reagent should be prepared within 30 min of use. Serum is reacted with the diazo reagent for exactly 10 min, and the reaction is stopped by the addition of ascorbic acid solution. A strongly alkaline solution (tartrate in 1 N NaOH) is then added, and the color developed is compared with a standard curve of absorbance at 600 nm. Bilirubin is extremely sensitive to light. Sunlight can markedly decrease the bilirubin content in samples (as much as 50%/h). However, serum specimens can be stored for many weeks or months without appreciable change of bilirubin content if they are kept in the dark in a freezer. Other examples of derivatization include the determination of cholesterol by Liebermann–Burchard reaction. In this reaction, cholesterol is reacted with a mixture of acetic anhydride, acetic acid, and sulfuric acid to give a bluish green product that can be measured colorimetrically.
Enzymatic Conversion. Enzymatic conversion can be used to determine concentrations by the measurement of either the loss of substrate, the creation of product, or the change of the cofactor (coenzyme). Nicotinamide adenine dinucleotide (NAD) and nicotinamide adenine dinucleotide phosphate (NADP) and their respective reduced forms, NADH and NADPH are cofactors that have been extensively utilized for analytical purposes in colorimetric assays. These cofactors serve as the natural oxidizing and reducing agents in a wide variety of enzyme systems. With the appropriate enzyme, they can selectively oxidize or reduce a single substrate in the presence of innumerable other compounds, making possible the analysis of a single compound in a complex mixture. Both NADH and NADPH have identical absorption bands with peak absorption at
COLORIMETRY 193
340 nm. The compounds NAD and NADP do not absorb at this wavelength. Therefore, changes in oxidation or reduction can be measured colorimetrically. In addition, the reduced forms can be completely destroyed at acidic pH without affecting the oxidized forms and the oxidized forms can be completely destroyed at basic pH without affect the reduced forms (27).
The measurement of glucose-6-phosphate in the range of 20–200 mM can be done in one step by monitoring the reduction of NADP to NADPH. This reaction is carried out by the oxidation of glucose-6-phosphate to 6-phosphate gluconolactone by the enzyme glucose-6-phosphate dehydrogenase, for which NADP is the coenzyme and is reduced to NADPH. The reaction is quantitated by measuring the 340 nm absorption of NADPH after completion of the reaction. Biological substances that do not react directly with nicotinamide nucleotides can be analyzed in this system by one or more additional enzymes. For example, glucose can be determined by the following two-step reaction that convert NADP to NADPH.
hexokinase
Glucose þ ATP ! Glucose-6-phosphate þ ADP
glucose-6-phosphate
Glucose-6-phosphate þ NADP !
dehydrogenase
6-Phosphate gluconolactone þ NADPH þ Hþ
An example of a three-step assay is the enzymatic analysis of inorganic phosphate (Pi), carried out with three simultaneous reactions, ends in the conversion of NADP to NADPH (28).
phosphorylase a
Glycogen þ Pi ! Glucose-1-phosphate
phosphate glucomutase
Glucose-1-phosphate ! Glucose-6-phosphate
glucose-6-phosphate dehydrogenase
Glucose-6-phosphate þ NADP !
6-Phosphate gluconolactone þ NADPH
Hydrogen peroxide can be readily quantitated colorimetrically by its peroxidase-catalyzed reaction with a colorless chromogenic oxygen acceptor to form an intensely colored product. This reaction can therefore be used to measure the concentration of any organic compound that, on reaction, will produce hydrogen peroxide. For example, glucose levels in serum can be determined by indirect detection using the enzyme glucose oxidase. This enzyme catalyzes the oxidation of glucose to gluconic acid and hydrogen peroxide. The amount of hydrogen peroxide produced can be detected by reaction with peroxidase, and most commonly o-dianisidine. The oxidized product of o-dianisidine has a strong absorbance 540 nm. The overall reactions are as follows:
glucose
Glucose þ O2 þ H2O ! Gluconic acid þ H2O2
oxidase
peroxidase
H2O2 þ o-Dianisidine ! H2O þ Oxidized o-dianisidine
Since this measurement is dependent on the color formation of the oxidized chromogen, other substances in the sample can interfere with this reaction by competing with chromogens for hydrogen peroxide and by reducing the final color intensity. Some of the interfering substances in
194 COLORIMETRY
serum are creatine, uric acid, ascorbic acid, bilirubin, and glutathione. Therefore, results obtained directly from serum tend to be lower than the true values. Serum samples, especially with red cells, or extensive hemolysis require precipitation of the protein to remove interfering enzymes, with measurements carried out on the proteinfree filtrates. Direct measurements of glucose from urine specimens cannot be done by the glucose oxidase method because of the presence of enzyme inhibitors.
Glucose oxidase is highly specific to b-d-glucose. In aqueous solutions, glucose exists 36% in the a form and 64% in the b form. The same ratio of the two forms is also found in serum. Crystalline glucose, however, can be either the a or b form, depending on the conditions of crystallization. In order to correct the difference in standard solutions, some commercial preparations of glucose oxidase contain another enzyme, mutarotase, which accelerates the conversion of a form to b form during the assay. Alternatively, standard solutions from crystalline glucose can be prepared 2 h before the determination to allow the mutarotation to reach equilibrium. The final assay solution
contains the following |
components: |
glucose oxidase |
(5 U mL 1), peroxidase |
(16 U mL 1), |
and o-dianisidine |
(0.6 mmol mL 1) in a pH 7.0 phosphate buffer. Under these assay conditions, glucose can be measured at a range of up to 250 mg dL 1. Samples with higher glucose concentrations should be diluted before the determination. Note that most chromogens used in the peroxidase reaction (e.g., o-dianisidine and o-tolidine) are potential carcinogens, and precautions should be taken when handling these compounds.
Colorimetric assays have found substantial applications in determination of concentration by ELISA. For example, the previously described assay to measure glucose concentration has been adapted as follows (29). The production of hydrogen peroxide from glucose is catalyzed by glucose oxidase, an enzyme consisting of apoglucose oxidase and flavin adenine dinucleotide (FAD) cofactor. If a ligand is bound to FAD and antibodies to that ligand are added to the solution, the enzyme will be inactive. Competition by free ligand will make conjugated FAD available for apoglucose oxidase. Since this reaction is enzymatic, excess glucose can be added, which leads to amplification of the signal. Therefore, very low concentrations of ligand can be assayed colorimetrically by the oxidation of glucose.
Besides glucose, the production of hydrogen peroxide as an intermediate has been employed to measure a number of clinically important substances including lecithin, high density lipoprotein cholesterol, phospholipids, digoxin, and triglycerides in human serum (30). In the last example, triglycerides are hydrolyzed to glycerol and fatty acid with lipase. The resulting glycerol is phosphorylated by l-a- glycerophosphate oxidase to produce hydrogen peroxide, which reacts in the peroxidase-catalyzed coupling of 4- aminoantipyrine and sodium 2-hydroxy-3,5-dichloroben- zene sulfonate to form an intense red product.
Kinetic Measurement
Kinetic measurements are generally used to determine the activity of enzymes. The expression of enzyme activity
units (U) has been extremely arbitrary and inconsistent over the years. Historically, activity has been measured colorimetrically, and often activity for many common enzymes is expressed as an initial rate of absorbance change of a particular chromogen at the appropriate wavelength per unit time. More recently, enzyme activities have been expressed on a molar basis (i.e., the molar rate of destruction, or creation of substrates or products per unit time). Kinetic measurement of enzyme activity requires more control than quantitative measurements, since activity is usually a function of pH, ionic strength, temperature, substrate concentration, and the presence of activators and inhibitors.
Direct Measurement. An enzymatic reaction can be monitored by the measurement of either the rate of loss of the substrate, the formation of the product, or the rate of change of the cofactor (coenzyme) concentration. All of these methods are commonly used to determine enzyme activity.
Substrate. In an enzymatic reaction, which converts a substrate to a colored product or a colored substrate to a colorless product, enzymatic activity can be detected colorimetrically. An example of this type of measurement is prostatic acid phosphatase determination (31). Acid phosphatase is present in many tissues, including bone, liver, kidney, erythrocytes, and platelets. Its level in serum is measured as a diagnostic for the detection of metastatic, prostatic carcinoma. Therefore, substrates specific to prostatic acid phosphatase isoenzyme are most desirable for this assay. One of the most commonly used substrates is thymolphthalein monophosphate, which, upon hydrolysis by the enzyme, produces thymolphthalein, a compound with intensive absorbance at 590 nm in alkaline solution.
acid
Thymolphthalein monophosphate !
phosphatase
Thymolphthalein þ HPO24
The course of this reaction can be monitored by a direct colorimetric measurement of product formation. Note that thymolphthalein monophosphate is not completely specific for prostatic acid phosphatase. However, unlike acid phosphatase from other sources, prostatic acid phosphatase can be inhibited by tartrate. Thus, from the assays of the enzyme activity in the presence or absence of tartrate, one can determine the phosphatase activity specific to the prostatic secretion. Acid phosphatase is extremely labile at the neutral pH of normal serum. Therefore, specimens for the enzyme measurement should be handled on ice and delivered to the laboratory as rapidly as possible. Serum separated in the laboratory should be acidified by acetate buffer to a pH range (pH 5–6) to stabilize the enzyme. Samples should be stored in the freezer if they are not to be assayed on the same day.
Acid phosphatase activity is highly dependent on pH and the specific ion in the buffer. Small changes in these parameters may cause a large difference in the enzyme activity measurements. To avoid a discrepancy between assays, a standardized procedure has to be followed carefully. Additional factors, such as the ratio of serum sample to the volume of final mixture, surfactant (Brij-35) for activation