

Molecular Fluorescence
.pdfMolecular Fluorescence: Principles and Applications. Bernard Valeur
> 2001 Wiley-VCH Verlag GmbH
ISBNs: 3-527-29919-X (Hardcover); 3-527-60024-8 (Electronic)
155
6
Principles of steady-state and time-resolved fluorometric techniques
Experiments never deceive. It is our judgement that deceives itself because it expects results which experiments do not give.
Leonardo da Vinci, 15th century
The aim of this chapter is to give the reader a good understanding of the instrumentation necessary to carry out reliable measurements. Only the principles will be described and the reader is referred to more specialized books or reviews for further details (see Bibliography at the end of the chapter).
6.1
Steady-state spectrofluorometry
Fluorescence measurements are indeed more di cult than they appear at first sight, for several reasons:
.wavelength dependence of (i) the light source intensity, (ii) the transmission e ciency of the monochromators, (iii) the detector sensitivity. Proper correction
of the emission and excitation spectra is not simple;
.e ect of polarization of the incident light and fluorescence emission (the transmission e ciency of a monochromator depends on the polarization of light);
.possible contamination of the signal by scattered light (Rayleigh or Raman), especially from turbid samples or by background fluorescence of the medium (fluorescent impurities of the solvent, self-fluorescence of biological samples, etc.).
156 6 Principles of steady-state and time-resolved fluorometric techniques
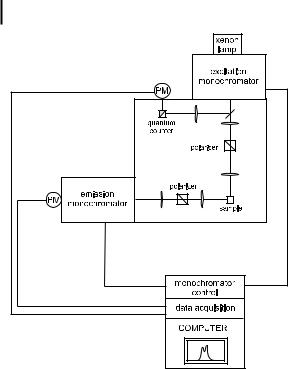
Fig. 6.1. A conventional spectrofluorometer.
6.1.1
Operating principles of a spectrofluorometer
Figure 6.1 shows the components of a conventional spectrofluorometer. The light source is generally a high-pressure xenon arc lamp, which o ers the advantage of continuous emission from @250 nm to the infrared. A monochromator is used to select the excitation wavelength. Fluorescence is collected at right angles with respect to the incident beam and detected through a monochromator by a photomultiplier. Automatic scanning of wavelengths is achieved by the motorized monochromators, which are controlled by the electronic devices and the computer (in which the data are stored).
The optical module contains various parts: a sample holder, shutters, polarizers if necessary, and a beam splitter consisting of a quartz plate reflecting a few per cent of the exciting light towards a quantum counter or a photodiode. A quantum counter usually consists of a triangular cuvette containing a concentrated solution of a dye whose fluorescence quantum yield is independent of the excitation wavelength (e.g. rhodamine 101 in ethylene glycol, concentrationA3 gL 1)1). At such a
1) Rhodamine B is most frequently used as a |
quantum yield is almost independent of |
quantum counter, but the advantage of |
temperature, unlike rhodamine B. |
rhodamine 101 is that its fluorescence |
|

6.1 Steady-state spectrofluorometry 157
high concentration, the solution absorbs all incident photons and the light collected at right angles (see Figure 6.1) by a reference photomultiplier is proportional to the photon flux of the incident light over the excitation wavelength range corresponding to the absorption range of the dye (220–600 nm for rhodamine 101). However, a quantum counter is limited in wavelength to the absorption range of the dye. Therefore, a photodiode whose wavelength response is as flat as possible may be preferred to a quantum counter.
A reference channel (quantum counter or photodiode) has two advantages: (i) it compensates for the time fluctuations of the lamp via a ratiometric measurement (ratio of the output signals of the photomultiplier detecting the fluorescence of the sample to the output signal of the reference detector); (ii) it permits correction of excitation spectra (see below).
Emission and excitation spectra were defined in Chapter 3 using the following expression for the measured fluorescence intensity
IFðlE; lFÞ ¼ kFðlFÞI0ðlEÞf1 exp½ 2:3eðlEÞlc&g
or
IFðlE; lFÞ ¼ kFðlFÞI0ðlEÞf1 10 AðlEÞg ð6:1Þ
where lE is the excitation wavelength, lF is the wavelength at which the fluorescence is observed, I0 is the intensity of the incident beam on the sample, eðlEÞ is the molar absorption coe cient at the excitation wavelength, l is the optical path in the sample, c is the molar concentration and AðlEÞ is the absorbance at the excita-
l |
|
in fluorescence intensity per unit wave- |
|
tion wavelength. Fð FÞ is the variation |
|
y |
|
length with the normalization condition |
|
0 FðlFÞ dlF ¼ FF (see Chapter 3). k is an |
|
instrumental factor that depends on |
many parameters: geometry of observation |
||
|
Ð |
|
|
(solid angle through which the light is collected), transmission e ciency of the monochromators, width of the monochromator slits, high voltage of the photomultiplier, gain of the electronic devices, etc. Therefore, the numerical value of the measured fluorescence intensity has no meaning and the fluorescence spectrum is usually plotted in arbitrary units2); sometimes it is normalized so that
Ð |
0y IF dlF ¼ FF. |
|
It is important to recall that IF is proportional to the concentration only in dilute |
||
solutions ½AðlEÞ < 0:05Þ; Eq. (6.1) is then reduced to |
|
|
|
IFðlE; lFÞ ¼ 2:3kFðlFÞI0ðlEÞAðlEÞ |
|
|
¼ 2:3kFðlFÞI0ðlEÞeðlEÞlc |
ð6:2Þ |
2) In contrast, a spectrophotometer measures an absorbance, a quantity that is expressed on an absolute scale.

158 6 Principles of steady-state and time-resolved fluorometric techniques
The emission spectrum corresponds to the variations of IF as a function of lF, the excitation wavelength lE being fixed, whereas the excitation spectrum reflects the variations of IF as a function of lE, the observation wavelength lF being fixed. Note that the spectra are recorded as a function of wavelength and not wavenumber because the monochromators of spectrofluorometers are presently all equipped with gratings (no longer with prisms), so that for a given width of the input and output slits, the monochromators operate at a constant bandpass expressed in wavelength.
As outlined above, the spectra are distorted by the wavelength dependence of several components of the instrument. Correction of spectra is of major importance for quantitative measurements (determination of quantum yields and calculation of overlap integrals), for comparison of excitation and absorption spectra, and for comparison of fluorescence data obtained under di erent experimental conditions.
6.1.2
Correction of excitation spectra
According to Eqs (6.1) and (6.2), in which the emission wavelength lF is constant, the excitation spectrum is distorted by the variations I0ðlEÞ of the intensity of the exciting light; these variations are due to the wavelength dependence of the lamp intensity and of the transmission e ciency of the excitation monochromator. Because the quantum counter circumvents the wavelength dependence of the sensitivity of the reference photomultiplier, the ratio of the fluorescence signal from the sample to that from the quantum counter or photodiode, as a function of the excitation wavelength, provides in principle corrected excitation spectra.
However, such correction procedures may be insu cient when very accurate measurements are needed (for instance when information is expected from the comparison of the absorption and excitation spectra). In fact, the optical geometry of the reference channel is not identical to that of the main channel, and the wavelength dependence of optical parts (e.g. focal length of lenses) may introduce some distortion into the excitation spectrum. It is then recommended to use correction factors obtained by using a fluorescent compound absorbing in the same wavelength range as that of the sample to be studied, and whose absorption spectrum is identical to its excitation spectrum. The ratio of the measured excitation spectrum of this reference compound – as described above using the quantum counter – to the absorption spectrum provides the correction factors that can be stored in the computer.
Spectrofluorometers equipped with a photodiode instead of a quantum counter provide excitation spectra that should be further corrected because, in addition to the reasons explained above, the wavelength response of the photodiode is not strictly flat over the whole wavelength range available.
It should be noted that most commercially available instruments are delivered with a file containing the correction factors.

6.1 Steady-state spectrofluorometry 159
6.1.3
Correction of emission spectra
The emission spectrum is distorted by the wavelength dependence of the emission monochromator e ciency and the photomultiplier response. In general, the correction factors are measured by the manufacturer using a calibrated tungsten lamp. A reflector (e.g. made of freshly prepared magnesium oxide) is introduced into the sample holder and set at 45 , and is illuminated by the lamp externally positioned at right angles. The spectral response of the detection system is recorded and the correction factors are obtained by dividing this spectral response by the spectral output data provided with the lamp. For wavelengths shorter than about 320 nm, where the intensity of tungsten lamps is too low to get reliable correction factors, a hydrogen or deuterium lamp can be used. It is recommended that the correction factors are recorded with a polarizer placed – with a defined orientation – between the sample and the emission monochromator, because of the polarization dependence of the transmission e ciency of the monochromator (see Section 6.1.5).
Alternatively, a standard fluorescent compound can be used whose corrected emission spectrum has been reported3). Comparison of this spectrum with the ‘technical’ spectrum recorded with the detection system provides the correction factors. The wavelength range must obviously cover the fluorescence spectrum to be corrected. Unfortunately, there is a limited number of reliable standards.
Emission correction factors are provided with most commercially available spectrofluorometers.
6.1.4
Measurement of fluorescence quantum yields
Proper correction of the emission spectrum is a prerequisite for the measurement of the fluorescence quantum yield of a compound. Quantum yields are usually determined by comparison with a fluorescence standard4), i.e. a compound of known quantum yield that would ideally satisfy the following criteria (Demas, 1982):
3)Numerical values of the corrected fluorescence spectrum of quinine sulfate can be found in: Velapoldi R. A. and Mielenz K. D. (1980) Standard reference materials: A fluorescence SRM: quinine sulfate dihydrate (SRM 936), NBS Spec. Publ. 260–64, Jan. 1980, PB 80132046, (NTIS), Springfield, VA, USA. Samples of quinine sulfate dihydrate can be ordered from the Standard Reference Materials Program, National Institute of Standards and Technology, Gaithersburg, MD 20678-9950, USA.
A collection of corrected excitation and emission spectra can be found in: Miller J. N. (Ed.) (1981) Standards for Fluorescence Spectrometry, Chapman and Hall, London. Corrected emission spectra can also be found in Appendix 1 of Lakowicz J. R. (1999) Principles of Fluorescence Spectroscopy, Kluwer Academic/ Plenum Publishers, New York.
4)Absolute determinations of quantum yield are possible using integrating spheres, by calorimetry and by other methods, but they are di cult and uncommon.

160 6 Principles of steady-state and time-resolved fluorometric techniques
Tab. 6.1. Standards for the determination of fluorescence quantum yields
Range |
Compound |
Temp. |
Solvent |
FF |
Ref. |
|
|
( C) |
|
|
|
|
|
|
|
|
|
270–300 nm |
Benzene |
20 |
Cyclohexane |
0:05 G0:02 |
1 |
300–380 nm |
Tryptophan |
25 |
H2O (pH 7.2) |
0:14 G0:02 |
2 |
300–400 nm |
Naphthalene |
20 |
Cyclohexane |
0:23 G0:02 |
3 |
315–480 nm |
2-Aminopyridine |
20 |
0.1 mol L 1 |
0:60 G0:05 |
4 |
|
|
|
H2SO4 |
|
|
360–480 nm |
Anthracene |
20 |
Ethanol |
0:27 G0:03 |
1, 5 |
400–500 nm |
9,10-diphenylanthracene |
20 |
Cyclohexane |
0:90 G0:02 |
6, 7 |
400–600 nm |
Quinine sulfate dihydrate |
20 |
0.5 mol L 1 |
0.546 |
5, 7 |
|
|
|
H2SO4 |
|
|
600–650 nm |
Rhodamine 101 |
20 |
Ethanol |
1:0 G0:02 |
8 |
|
|
|
|
0:92 G0:02 |
9 |
600–650 nm |
Cresyl violet |
20 |
Methanol |
0:54 G0:03 |
10 |
|
|
|
|
|
|
1)Dawson W. R. and Windsor M. W. (1968) J. Phys. Chem. 72, 3251.
2)Kirby E. P. and Steiner R. F. (1970) J. Phys. Chem. 74, 4480.
3)Berlman I. B. (1965) Handbook of Fluorescence Spectra of Aromatic Molecules, Academic Press, London.
4)Rusakowicz R. and Testa A. C. (1968) J. Phys. Chem. 72, 2680.
5)Melhuish W. H. (1961) J. Phys. Chem. 65, 229.
6)Hamai S. and Hirayama F. (1983) J. Phys. Chem. 87, 83.
7)Meech S. R. and Phillips D. (1983) J. Photochem. 23, 193.
8)Karstens T. and Kobs K. (1980) J. Phys. Chem. 84, 1871.
9)Arden-Jacob J., Marx N. J. and Drexhage K. H. (1997) J. Fluorescence
7(Suppl.), 91S.
10)Magde D., Brannon J. H., Cramers T. L. and Olmsted J. III (1979)
J. Phys. Chem. 83, 696.
. readily available in a highly pure form;
. photochemically stable in solution and in storage in the solid state;
. high fluorescence quantum yield accurately known;
. broad absorption and fluorescence spectra with no sharp spectral features, to avoid bandpass errors;
. fluorescence spectrum and quantum yield independent of excitation wavelength;
. small overlap between absorption and emission spectra to avoid self-absorption
. errors;unpolarized emission.
A list of fluorescence standards is given in Table 6.1.
In order to minimize the e ects of possible inaccuracy of the correction factors for the emission spectrum, the standard is preferably chosen to be excitable at the same wavelength as the compound, and with a fluorescence spectrum covering a similar wavelength range.
The fluorescence spectra of dilute solutions ðA < 0:05Þ of the compound and the standard must be recorded under exactly the same experimental conditions (slits of the monochromators, high voltage of the photomultipliers, gain of the electronic devices). The temperature of the sample holder must be controlled because the

6.1 Steady-state spectrofluorometry 161
fluorescence quantum yield of most compounds is temperature-dependent. If the solvents used for the standard and the compound are not the same, it is necessary to introduce a correction for the refractive index n5). The ratio of the quantum yields is given by
FF n2 |
|
|
0y FðlFÞ dlF |
6:3 |
|||
|
|
|
|
|
|
||
|
|
|
Ð |
|
|||
2 |
y |
ð Þ |
ð Þ |
||||
FFR ¼ nR |
Ð0 |
FR lF dlF |
|||||
where the subscript R refers to the reference solution (standard). Using Eq. (6.1), this ratio becomes
FF n2 |
|
|
0y IFðlE; lFÞ dlF |
1 10 ARðlEÞ |
6:4 |
||||||||
|
|
2 |
|
|
y |
IFR |
lE; lF |
|
dlF |
1 |
|
10 AðlEÞ |
ð Þ |
FFR ¼ nR |
Ð0 |
Þ |
|
||||||||||
|
|
|
|
Ð |
|
ð |
|
|
|
|
|
||
where IF and IFR are the corrected fluorescence spectra. The integrals represent the area under the fluorescence spectra. It should be recalled that, from a practical point of view, the integral calculation must be done on a wavelength scale and not a wavenumber scale because all spectrofluorometers are equipped with grating monochromators; the fluorescence spectrum is thus recorded on a linear wavelength scale at constant wavelength bandpass DlF (which is the integration step) (see Chapter 3, Box 3.3 for further details).
Equation (6.4) is still valid if the compound and the standard are not excited at the same wavelength, provided that the instrument is well corrected for the wavelength dependence of the lamp intensity and the excitation monochromator e - ciency. Otherwise, the second term of Eq. (6.4) must be multiplied by the ratio
I0ðlEÞ=I0ðlERÞ.
It should be noted that the accuracy of the determination of fluorescence quantum yields cannot be better than 5–10%, due to the small additive errors relevant to the absorbances at the excitation wavelength, the correction factors of the detection system and the quantum yield of the standard.
Attention should be paid to possible problems in the measurement of fluorescence quantum yields (some of which are discussed Section 6.1.5): inner filter e ects, possible wavelength e ects on FF, refractive index corrections, polarization e ects, temperature e ects, impurity e ects, photochemical instability and Raman scattering.
6.1.5
Pitfalls in steady-state fluorescence measurements: inner filter e ects and polarization e ects
It should again be emphasized that the determination of a ‘true’ fluorescence spectrum and of a quantum yield requires the use of very dilute solutions or there may be some undesirable e ects.
5)This correction is due to the fact that the fluorescence is refracted at the surface separating the solution and air. The fluo-
rescence flux falling on the aperture of the detection system is inversely proportional to the square of the refractive index.
162 6 Principles of steady-state and time-resolved fluorometric techniques
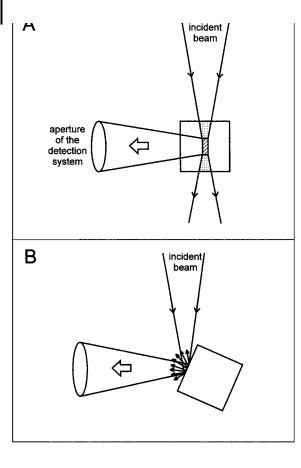
Fig. 6.2. Geometric arrangements for the observation of fluorescence:
(a) conventional right-angle arrangement; (b) front-face illumination.
Excitation inner filter e ect With the usual right angle observation, the detection system collects the fluorescence emitted only from the central part of the exciting beam (Figure 6.2a). When the concentration of the solution is low enough ðA < 0:1Þ, the incident light is only slightly attenuated through the cuvette, whereas when the concentration is large, a significant part of the incident light is absorbed before reaching the central part of the cuvette. This leads to a paradox: as the concentration increases, the observed intensity increases, goes through a maximum and decreases.
Consequently, it is important to note that the fluorescence intensity of a compound is proportional to the concentration over only a limited range of absorbances, due to this geometrical reason, in addition to the mathematical reason (as shown by Eq. 6.1).
For analytical applications, when a linear relationship between fluorescence intensity and concentration is desirable, a correction curve must be built up under the same conditions as those that will be used for the actual experiment.
Emission inner filter e ect (self-absorption) The fluorescence photons emitted in the region overlapping the absorption spectrum can be absorbed (radiative energy trans-

6.1 Steady-state spectrofluorometry 163
fer; see Chapter 4, section 4.6.2). This results in a distortion of the shape of the fluorescence spectrum in this region. The larger the spectral overlap, the larger the distortion. This e ect depends on the geometry of the sample cell arrangement. For the usual right angle observation, a theoretical correction is di cult.
Inner filter e ects due to the presence of other substances When the solution contains other chromophores that absorb light in the same wavelength range as the fluorescent compound under study, the chromophores act as filters at the excitation wavelength and the fluorescence intensity must be multiplied by a correction factor. If the chromophores do not interact with the fluorescent compound, the correction factor is simply the fraction of light absorbed by the compound at the chosen excitation wavelength, so that the corrected fluorescent intensity is given by:
I corr |
|
l |
|
; l |
|
I |
|
l |
|
; l |
AðlEÞ |
ð |
6:5 |
ð |
|
FÞ ¼ |
Fð |
|
FÞ AtotðlEÞ |
||||||||
F |
|
E |
|
|
|
E |
|
Þ |
where AðlEÞ is the absorbance of the fluorescent compound ½eðlEÞlc& and AtotðlEÞ is the total absorbance of the solution. If the chromophores absorb at the observation wavelength, the fluorescence of the compound is attenuated. This e ect is again called the emission inner filter e ect.
All these inner filters e ects are di cult to correct and it is advisory to work as much as possible with dilute solutions.
When the use of high concentrations is required, front-face illumination (Figure 6.2b) o ers the advantage of being much less sensitive to the excitation inner filter e ect. The illuminated surface is better oriented at 30 than at 45 , because at 45 the unabsorbed incident light is partially reflected towards the detection system, which may increase the stray light interfering with the fluorescence signal.
Polarization e ects The transmission e ciency of a monochromator depends on the polarization of light. This can easily be demonstrated by placing a polarizer between the sample and the emission monochromator: it is observed that the position and shape of the fluorescence spectrum may significantly depend on the orientation of the polarizer. Consequently, the observed fluorescence intensity depends on the polarization of the emitted fluorescence, i.e. on the relative contribution of the vertically and horizontally polarized components. This problem can be circumvented in the following way.
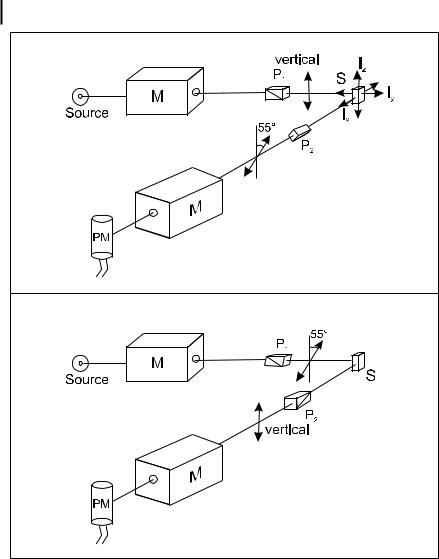
Let Ix; Iy and Iz be the intensity components of the fluorescence, respectively (Figure 6.3). If no polarizer is placed between the sample and the emission monochromator, the light intensity viewed by the monochromator is Iz þ Iy, which is not proportional to the total fluorescence intensity ðIx þ Iy þ IzÞ. Moreover, the transmission e ciency of the monochromator depends on the polarization of the incident light and is thus not the same for Iz and Iy. To get a response proportional to the total fluorescence intensity, independently of the fluorescence polarization, polarizers must be used under ‘magic angle’ conditions (see appendix, p. 196): a polarizer is introduced between the excitation monochromator and the sample and
164 6 Principles of steady-state and time-resolved fluorometric techniques
Fig. 6.3. Configuration of the excitation and emission polarizers for observing a signal proportional to the total fluorescence intensity. M: monochromator; S: sample; P1, P2: polarizers.
set in the vertical position, and another between the sample and the emission monochromator and set at the magic angle (54.7 ). Alternatively, the excitation polarizer can be set at the magic angle, and the emission polarizer in the vertical position (Figure 6.3).
Consequently, when fluorescence is polarized, it is recommended that excitation or emission spectra are recorded with properly oriented polarizers.