

Molecular Fluorescence
.pdf10.1 Fundamental aspects 275
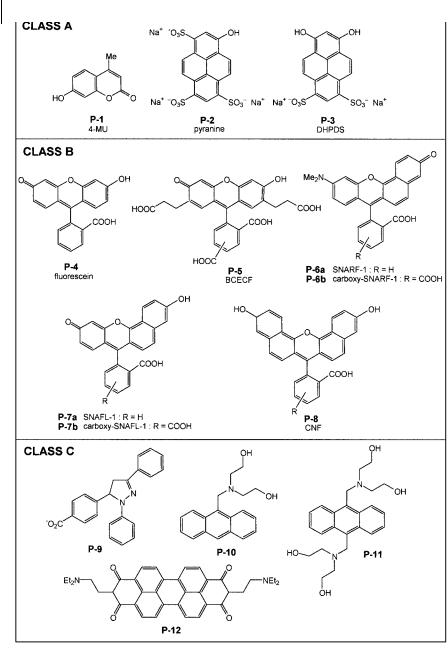
Fig. 10.1. Main classes of fluorescent molecular sensors of ions or molecules.
called a fluoroionophore. Again, fluorescence can be quenched (CEQ) or enhanced (CEF).
In cases where fluorescence sensing is accompanied by binding of the analyte (classes 2 and 3), the dissociation constant of the complex should match the ex-

276 10 Fluorescent molecular sensors of ions and molecules
pected range of analyte concentration, which can vary greatly according to the field of application.
Several books and many reviews have been devoted to fluorescent molecular sensors (see Bibliography at the end of this chapter). This chapter will present only selected examples to help the reader understand the fundamental aspects and the principles.
10.2
pH sensing by means of fluorescent indicators
Fluorescent pH indicators o er much better sensitivity than the classical dyes such as phenolphthalein, thymol blue, etc., based on color change. They are thus widely used in analytical chemistry, bioanalytical chemistry, cellular biology (for measuring intracellular pH), medicine (for monitoring pH and pCO2 in blood; pCO2 is determined via the bicarbonate couple). Fluorescence microscopy can provide spatial information on pH. Moreover, remote sensing of pH is possible by means of fiber optic chemical sensors.
10.2.1
Principles
First, it should be recalled that the value of pH is defined by the activity of protons Hþ (simplified notation for H3Oþaq) – and not by their concentration – via the following relationship:
|
¼ |
log aHþ |
ð |
Þ |
pH |
|
|
10:1 |
A glass electrode yields a response that is directly linked to the activity of protons. This is not true for optical methods (spectrophotometry and spectrofluorometry) using pH indicators. In fact, these methods are based on the optical determination of the concentrations of the acidic form, [A], and the basic form, [B], of the indicator1) and use of the well known Henderson–Hasselbach equation
|
|
¼ |
|
a þ |
|
|
A |
|
|
ð |
Þ |
|
pH |
|
pK |
|
log |
|
½B& |
|
|
|
10:2 |
|
|
|
½ & |
|
|
|
|||||
|
|
|
|
|
|
|
|
|
|
||
For fluorometric titrations, this equation can be rewritten as |
|
|
|||||||||
|
|
|
|
|
|
|
|
|
|
|
|
|
pH |
¼ |
pK |
a þ |
log |
|
I IA |
|
ð |
10:3 |
|
|
IB I |
|
|||||||||
|
|
|
|
|
|
Þ |
|||||
1)The acidic and basic forms can also be written as HA and A , respectively, or BHþ and B.

10.2 pH sensing by means of fluorescent indicators 277
where I is the fluorescence intensity at a given wavelength, IA and IB are the fluorescence intensities measured at the same wavelength when the indicator is only in the acidic form or only in the basic form, respectively (see Appendix A).
However, the Henderson–Hasselbach equation results from an oversimplification that deserves special attention. In fact, the equilibrium constant K characterizing the acid–base equilibrium must be written with activities:
K ¼ |
aHþ aB |
ð10:4Þ |
aA |
K is the true value of the acidity constant, which depends only on temperature. Using the definition of pH (Eq. 10.1), Eq. (10.4) becomes
pH ¼ pK þ log |
aB |
ð10:5Þ |
aA |
or
pH |
¼ |
pK |
þ |
log |
½B& |
þ |
log |
fB |
|
10:6 |
|
½A& |
fA |
||||||||||
|
|
|
|
ð Þ |
|||||||
where fB and fA are the activity coe cients relative to molarities. The activity coe cients are close to 1 only in very dilute aqueous solutions (reference state: solute at infinite dilution).
By comparison with Eq. (10.2), we obtain
pKa ¼ pK þ log |
fB |
ð10:7Þ |
fA |
Therefore, Ka should be considered as an ‘apparent’ constant that depends not only on temperature, but also on factors able to modify the activity coe cients:
.ionic strength (if A and/or B are ionic). Great care should be taken in the case of media containing high concentrations of salts. Highly charged indicators like pyranine are very sensitive to ionic strength (see Box 10.1). For less highly charged indicators, the e ect is less significant. For instance, the pKa of fluo-
rescein is almost independent of ionic strength.
.specific interactions depending on the chemical nature of the indicator and the surrounding medium (e.g. bu er constituents, composition of the physiological
medium, vicinity of interfaces in microheterogeneous media, etc.).
.structural changes of the medium. In particular, when probing microheterogeneous media (e.g. the vicinity of interfaces of micelles or lipid bilayers), the pKa value di ers significantly from the true pK value measured in dilute aqueous solutions.

278 10 Fluorescent molecular sensors of ions and molecules
Box 10.1 E ect of ionic strength on the pKa of pyranine
Pyranine (1-hydroxypyrene-3,6,8-trisulfonic acid trisodium salt, Figure 10.2) has a pK of 7.2 in a medium at infinite dilution. Such a dye is chosen here because it is particularly sensitive to ionic strength owing to the number of negative charges it bears: three in the acidic form and four in the basic form. The evolution of the absorption spectrum in a bu er at pH 7.2 as a function of the ionic strength (addition of KCl) indicates that the ratio [PyO ]/[PyOH] does not remain constanta). Because pK is a constant and the pH is kept constant by the bu er, Eq. (10.8) shows that the variations of [PyO ]/[PyOH] compensate for
the variations in the ratio of the activity coe cients, fPyO =fPyOH, as a function of ionic strength. Once the ratio [PyO ]/[PyOH] is determined, the apparent pK
value, pKa, can be calculated by means of the following equation:
½PyO & pKa ¼ pH log ½PyOH&
.At ionic strengths I < 1 M: the ratio [PyO ]/[PyOH] increases with increasing
I. The resulting decrease in fPyO =fPyOH is in agreement with the Debye– Huckel theory: the activity coe cient of PyO (four charges) is indeed ex-
pected to decrease more than that of PyOH (three charges). At an ionic strength of 1 M, pKa is equal to 6.7, i.e. 0.5 unit lower than the value in pure
water.
.At ionic strengths I > 1 M: the spectra do not exhibit isosbestic points any more and an increase, instead of a decrease, in pKa with increasing I is now observed. In this range, the specific interactions and the structural changes are predominant.
The e ect of various charged species on the pKa of pyranine is shown belowb).
|
Solution |
pKa |
|
|
|
|
|
|
Water with 0.0066 M phosphate bu er |
7:51 G0:03 |
|
|
Water with 6% albumin |
7:83 G0:06 |
|
|
Water with cetyl trimethylammonium bromide (6.6 mM) |
7:69 G0:03 |
|
|
Water with sodium dodecylsulfate (50 mM) |
7:43 G0:06 |
|
|
|
|
|
All these data show that the ionic strength can induce a change in pKa up to 0.5–0.6 unit. Because the ionic strength e ect causes spectral changes indistinguishable from those caused by pH, a correction method is desirable. A method based on a double pH indicator system, i.e. pyranine and 4-methylumbellifer- one, was proposed by Opitz and Lu¨bbersc).
|
a) Valeur B. and Bardez E. (1989), Proton |
b) Wolfbeis O. S., Fu¨rlinger E., Kroneis H. |
|
Transfer in Reverse Micelles and |
and Marsoner H. (1983) Fresenius Z. Anal. |
|
Characterization of the Acidity in the Water |
Chem. 314, 119. |
|
Pool, in: Pileni M. P. (Ed.), Structure and |
c) Opitz N. and Lu¨bbers D. W. (1984) Adv. |
|
Reactivity in Reverse Micelles, Elsevier, New |
Exp. Med. Biol. 169, 907. |
|
York, p. 103. |
|
|
|
|

10.2 pH sensing by means of fluorescent indicators 279
In almost all applications, fluorescent pH indicators are employed in a pH range around the ground state pKa (even if the excited state pK is di erent). Therefore, the absorption (and excitation) spectrum depends on pH in the investigated range. These indicators can be divided into three classes (see formulae in Figure 10.2) on the basis of the elementary processes (photoinduced proton transfer or electron transfer) that are involved.
.Class A: Fluorophores that undergo photoinduced proton transfer but not electron transfer (e.g. pyranine, hydroxycoumarins; see Sections 10.2.2.1 and 10.2.2.2). Most of these fluorophores are much more acidic in the excited state than in the ground state (case discussed in Chapter 4, Section 4.5), i.e. the pK in the excited state is much lower than that in the ground state. Therefore, in a pH range around the ground state pK, the emitting form is always the basic form because excitation of the acidic form is followed by excited-state deprotonation. The fluo-
rescence spectrum is thus unchanged, in contrast to the excitation spectrum.
.Class B: Fluorophores that undergo neither photoinduced proton transfer nor photoinduced electron transfer (e.g. fluorescein, eosin Y, benzo[c]xanthene dyes). The evolution of the fluorescence spectrum versus pH should be similar to that of the absorption spectrum. In other words, when increasing the pH, the absorption and emission bands of the acidic form should decrease with a concomitant increase in the absorption and emission bands of the basic form. This is indeed observed for benzo[c]xanthene dyes that have been developed for physiological applications; these dyes can be described as semi-naphthofluoresceins (SNAFL) and semi-naphthorhodafluors (SNARF) (see Section 10.2.2.4). In contrast, the currently used xanthene dyes like fluorescein derivatives and eosin Y show little
change in fluorescence bandshape, but much more significant changes in absorption or excitation spectra (see Section 10.2.2.3).
.Class C: Fluorophores that undergo no photoinduced proton transfer but only photoinduced electron transfer. The fluorescence quantum yield of these fluorophores is very low when they are in the non-protonated form because of internal quenching by electron transfer. Protonation (which suppresses electron transfer) induces a very large enhancement of fluorescence (see Section 10.2.2.5). The bandshapes of the excitation and fluorescence spectra are independent of pH.
From a practical point of view, the pH dependence of the emission and/or excitation spectra is first examined in a preliminary experiment. The evolution of the fluorescence intensity for an appropriate couple of excitation and emission wavelengths is then recorded under experimental conditions (in particular composition of the medium, ionic strength, etc.) as close as possible to the medium in which pH must be determined. The resulting curve can be used as a calibration curve.
It is recommended, whenever possible, to carry out ratiometric measurements, i.e. to determine the ratio of the fluorescence intensities measured at two wavelengths according to the following methods:
.one emission and two excitation wavelengths (see Figure 10.3A): this excitation ratio method is possible for most indicators (class A and class B) and is used in conventional fluorescence microscopy.

10.2 pH sensing by means of fluorescent indicators 281
Fig. 10.3. Principles of ratiometric measurements. A: doubleexcitation measurements. B: double-emission measurements.
.one excitation and two emission wavelengths (Figure 10.3B, ratios R2 and R3): this emission ratio method is applicable only to indicators exhibiting dual emission (emission of the acidic and basic forms at di erent wavelengths) (part of class B). The changes in fluorescence spectrum vs pH follow those of the absorption spectrum. This method is preferred for flow cytometry and confocal microscopy,
and it allows emission ratio imaging.
.two excitation and two emission wavelengths (Figure 10.3B, ratio R4): this method is also possible for indicators exhibiting dual emission. The main advantage of this method is that the emission intensities are much greater because both the acidic and basic forms are excited near their absorption maxima, resulting in stronger emission from both species.

282 10 Fluorescent molecular sensors of ions and molecules
Tab. 10.1. Examples of fluorescent pH indicators allowing ratiometric measurements. It should be recalled that the values of pKa (given here at room temperature for dilute solutions) can be more or less a ected by changes in ionic strength and temperature
Fluorophore |
pKa |
Type of measurement |
4-MU |
7.8 |
excitation ratio 365/335 nm |
pyranine |
7.2 |
excitation ratio 450/400 nm |
fluorescein |
2.2, 4.4, 6.7 |
excitation ratio 490/435 nm |
BCECF |
7.0 |
excitation ratio 505/439 nm |
SNAFL dyes |
7.0–7.8 |
excitation ratio 490/540 nm or |
|
|
emission ratio 540/630 nm |
SNARF dyes |
7.0–7.8 |
emission ratio 580/630 nm |
CNF |
7.5 |
excitation ratio 600/510 nm or |
|
|
emission ratio 550/670 nm |
|
|
|
Abbreviations: 4-MU: 4-methylumbelliferone; BCECF: 20,70- bis(carboxyethyl)-5 (or 6)-carboxyfluorescein; SNAFL: seminaphthofluoresceins; SNARF: semi-naphthorhodafluors; CNF: carboxynaphthofluorescein.
The ratiometric measurements are preferable because the ratio of the fluorescence intensities at two wavelengths is in fact independent of the total concentration of the dye, photobleaching, fluctuations of the source intensity, sensitivity of the instrument, etc. The characteristics of some fluorescent pH indicators allowing ratiometric measurements are given in Table 10.1.
Measurements at one excitation and one emission wavelength are always possible of course (this is the sole possibility for class C), but they do not o er the advantages of the ratiometric methods described above. In this case, the calibration curve may be successfully fitted to Eq. (10.3).
For ratiometric measurements, the following equation may be used to fit the calibration curve (see Appendix A):
pH |
¼ |
pK |
a þ |
log |
R RA |
þ |
log |
IAðl2Þ |
ð |
10:8 |
|
RB R |
IBðl2Þ |
||||||||||
|
|
|
|
Þ |
where R is the ratio Iðl1Þ=Iðl2Þ of the fluorescence intensities at two excitation wavelengths (or two emission wavelengths) l1 and l2. RA and RB are the values of R when only the acidic form or the basic form is present, respectively. IAðl2Þ=IBðl2Þ is the ratio of the fluorescence intensity of the acidic form alone to the intensity of the basic form alone at the wavelength l2 chosen for the denominator of R. It should be emphasized that R, RA and RB are very sensitive to the wavelengths chosen and also to instrumental settings.
The preceding relationships show that the usual working range is about 2 pH units around pKa. However, several 2 pH unit ranges are juxtaposed when the indicator possesses more than one pKa (e.g. fluorescein).

10.2 pH sensing by means of fluorescent indicators 283
10.2.2
The main fluorescent pH indicators
10.2.2.1 Coumarins
A derivative of coumarin that has been extensively used for intracellular pH measurement is 4-methylumbelliferone (4-methyl-7-hydroxycoumarin) because of its pKa value of 7.8, the relatively large variation in its fluorescence intensity versus pH, and its low toxicity. Excitation ratio measurements at 365 and 334 nm with observation at 450 nm permit a sixto ten-fold increase over the pH range from 6 to 8.
4-Chloromethyl-7-hydroxycoumarin and 6,7-dihydroxy-4-methylcoumarin have been also used as pH indicators.
10.2.2.2 Pyranine
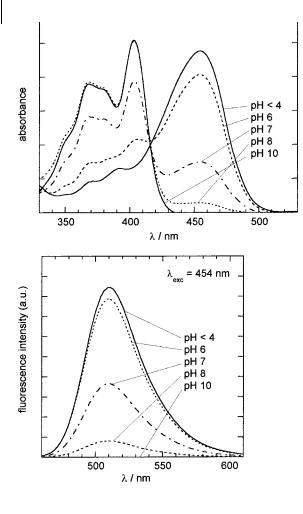
Pyranine (1-hydroxypyrene-3,6,8-trisulfonic acid trisodium salt) has already been described in Chapter 4 and its sensitivity to ionic strength is outlined in Box 10.1. Its ground state pKa is 7.2 (in a medium of low ionic strength). In the pH range of practical interest for intracellular measurements, i.e. around 7, the acidic form of pyranine undergoes deprotonation upon excitation, which explains why the fluorescence spectrum is unchanged in this pH range and corresponds to the emission of the basic form (nevertheless, a weak emission of the acidic form appears as a result of geminate recombination; see Chapter 4, Section 4.5.3). In contrast, the large changes in the absorption and excitation spectra reflect the varying proportions of the acidic and basic forms in the ground state (Figure 10.4). Excitation ratio measurements, 450/400 nm, are possible.
The pyranine derivative DHPDS (1,3-dihydroxypyrene-6,8-disulfonic acid) retains the high pH sensitivity of pyranine but its acido–basic properties are much less sensitive to ionic strength. This indicator has two pKa values: 7:33 G0:04 and 8:55 G0:2. Ratiometric measurements in both excitation and emission are possible.
10.2.2.3 Fluorescein and its derivatives
Fluorescein is one of the most well-known fluorescent dyes, discovered by A. von Baeyer in 1871. It has been used in numerous applications. There are nine di erent forms of fluorescein; six of them exist in aqueous solutions with pKa values of 2.2, 4.4 and 6.7 (Figure 10.5).
The exceptionally broad range of pH response (from 1 to 8) can be explained by the existence of two consecutive transitions: neutral form–monoanion and monoanion–dianion. The pH dependence of the emission and excitation spectra is shown in Figure 10.5.
The cationic form has a higher fluorescence quantum yield than the neutral form, which allows the excitation ratio (490/435 nm) measurement to be extended down to pH 2.
With the aim of increasing the apparent pKa to a value more suitable for intracellular pH measurements, fluorescein derivatives have been designed: CF (5(or 6)-
284 10 Fluorescent molecular sensors of ions and molecules
Fig. 10.4. pH dependence of the excitation and emission spectra of pyranine around neutral pH.
carboxyfluorescein) and BCECF (20,70-bis(carboxyethyl)-5(or 6)-carboxyfluorescein). BCECF, whose pKa is close to 7, has become the most widely used intracellular fluorescent pH indicator (see Table 10.1).
10.2.2.4 SNARF and SNAFL
SNARF and SNAFL indicators are benzo[c]xanthene dyes that can be described as semi-naphthofluoresceins and semi-naphthorhodafluors, respectively, depending on whether the benzo[c]xanthene ring is substituted at the 10-position with oxygen or with nitrogen, respectively (Whitaker et al., 1991). These indicators, whose pKa values are in the physiological range, exhibit distinct emission bands for the protonated and deprotonated forms so that emission ratio measurements are possible. In SNAFL, the acidic form is more fluorescent, whereas in SNARF, the basic form is more fluorescent.