

Molecular Fluorescence
.pdf8.4 Methods based on intramolecular excimer formation 235
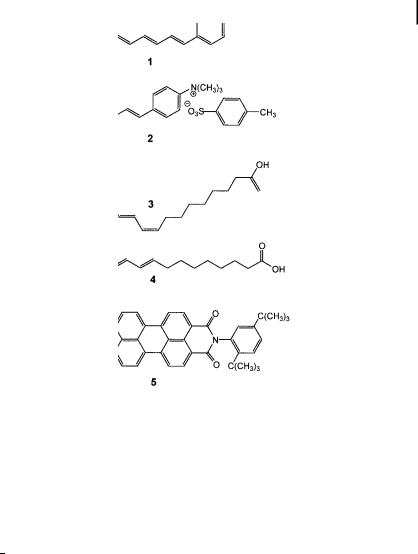
Fig. 8.3. Excimer-forming bifluorophores for the study of fluidity. 1: a,o-di-(1-pyrenyl)- propane; 2: a,o-di-(1-pyrenyl)-
methylether; 3: 10,100-diphenyl- bis-9-anthrylmethyloxide (DIPHANT); 4: meso-2,4-di- (N-carbazolyl)pentane.
formation on phospholipid bilayers and in particular on phase transition, lateral di usion and lateral distribution (Vanderkoi and Callis, 1974; Hresko et al., 1986).
Molecular mobility in polymer films and bulk polymers can also be probed by excimer formation of pyrene (Chu and Thomas, 1990).
8.4
Methods based on intramolecular excimer formation
Bifluorophoric molecules consisting of two identical fluorophores linked by a short flexible chain may form an excimer. Examples of such bifluorophores currently used in investigations of fluidity are given in Figure 8.3.
In contrast to intermolecular excimer formation, this process is not translational but requires close approach of the two moieties through internal rotations during the lifetime of the excited state. Information on fluidity is thus obtained without the di culty of possible perturbation of the di usion process by microheterogeneity of the medium, as mentioned above for intermolecular excimer formation.

236 8 Microviscosity, fluidity, molecular mobility. Estimation by means of fluorescent probes
Moreover, the e ciency of excimer formation does not depend on the concentration of fluorophores, so that Eq. (8.21) should be rewritten as
|
IE |
|
kr0 |
|
|
|
|
¼ |
|
tEk1 |
ð8:22Þ |
IM |
kr |
||||
|
|
|
|
|
|
As in the case of intermolecular excimer formation, it should be recalled that difficulties may arise from the possible temperature dependence of the excimer lifetime, when e ects of temperature on fluidity are investigated. It is then recommended that time-resolved fluorescence experiments are performed. The relevant equations established in Chapter 4 (Eqs 4.43–4.47) must be used after replacing k1[M] by k1.
The viscosity dependence of intramolecular excimer formation is complex. As in the case of molecular rotors (Section 8.2), most of the experimental observations can be interpreted in terms of free volume. However, compared to molecular rotors, the free volume fraction measured by intramolecular excimers is smaller. The volume swept out during the conformational change required for excimer formation is in fact larger, and consequently these probes do not respond in frozen media or polymers below the glass transition temperature.
Using again the Doolittle equation (8.13) and assuming that the rate constant for excimer formation is given by
|
0 |
exp x |
V0 |
|
|
ð8:23Þ |
|
|
k1 ¼ k1 |
|
|
||||
|
Vf |
|
|||||
(note the analogy with Eq. 8.14), we get |
|
||||||
|
|
|
|
|
|
|
|
|
k1 ¼ ah x |
|
|
|
|
ð8:24Þ |
|
It is important to note that the response of a probe is not the same in two solvents of identical viscosity but of di erent chemical nature. For instance, the variations in IE=IM for a;o-di-(1-pyrenyl)propane in ethanol/glycerol mixtures and in hexadecane/para n mixtures at 25 C (either degassed or undegassed) show significant di erences between IE=IM values for the same viscosity but with di erent solvent mixtures. A dependence on the chain length was also found. This e ect of chain length and solvent can be explained in terms of the internal rotations involved in excimer formation. These rotations depend on the torsional potential of the various bonds and on the solvent nature; the solvent intervenes not only by the viscous drag, but also by its microstructure and possible interactions with the probe. The distribution of distances between the two fluorophores at the instant of excitation evolves during the excited-state lifetime of the monomer. Some of the bifluorophores with one excited fluorophore form an excimer because of favorable initial interchromophoric distance and favorable time evolution. Once the two chromophores are close to each other, the formation of the excited dimer (excimer)

8.5 Fluorescence polarization method 237
is very rapid, so that the overall process is di usion-dependent. The initial distribution and its further evolution depends on chain length, solvent nature, viscosity and temperature (Viriot et al., 1983).
It should be noted that in organized assemblies, the local order may a ect the internal rotations and the distribution of interchromophoric distances. Therefore, it is not surprising that the values of the equivalent viscosity may depend on the probe and, in particular, on the chain length. A comparison between degassed and undegassed solutions showed a strong e ect of oxygen at low viscosities. The e ect of oxygen leading to smaller values of the ratio IE=IM is simple to understand on the basis of Eq. (8.22): the ratio IE=IM is proportional to the excited-state lifetime of the excimer, which is reduced by oxygen quenching. The rate of oxygen quenching decreases with increasing viscosity, and its e ect on excimer formation in dipyrenylalkanes becomes negligible at viscosities higher than 100 cP.
Intramolecular excimers have been used for probing bulk polymers, micelles, vesicles and biological membranes (Bokobza and Monnerie, 1986; Bokobza, 1990; Georgescauld et al., 1980; Vauhkonen et al., 1990, Viriot et al., 1983; Zachariasse et al., 1983). In particular, this method provides useful information on the local dynamics of polymer chains in the bulk (see Box 8.2).
In conclusion, the method of intramolecular excimer formation is rapid and convenient, but the above discussion has shown that great care is needed for a reliable interpretation of the experimental results. In some cases it has been demonstrated that the results in terms of equivalent microviscosity are consistent with those obtained by the fluorescence polarization method (described in Section 8.5), but this is not a general rule. Nevertheless, the relative changes in fluidity and local dynamics upon an external perturbation are less dependent on the probe, and useful applications to the study of temperature or pressure e ects have been reported.
8.5
Fluorescence polarization method
In Chapter 5, devoted to fluorescence polarization, it was shown that information on the rotational motions of a fluorophore can be obtained from emission anisotropy measurements. Application to the evaluation of the fluidity of a medium, or molecular mobility, is presented below.
8.5.1
Choice of probes
The probes to be used in fluorescence polarization experiments should fulfil as far as possible the following requirements:
. minimum disturbance of the medium to be probed;
.symmetry and directions of the transition moments such that rotations can be considered as isotropic;


8.5 Fluorescence polarization method 241
Fig. 8.4. Examples of probes used in fluorescence polarization experiments to evaluate fluidity and molecular mobility. 1: 1,6-diphenyl-1,2,5-hexatriene (DPH). 2: 1-(4-trimethyl- ammoniumphenyl)-6-phenyl 1,3,5-hexatriene, p-toluene sulfonate (TMA-DPH). 3: cisparinaric acid. 4: trans-parinaric acid. 5. BTBP [N,N0-bis(2,5-di- ter-butylphenyl)-3,4,9,10- perylenetetracarboximide].
For isotropic motions in an isotropic medium, the values of the instantaneous and steady-state emission anisotropies are linked to the rotational di usion coe - cient Dr by the following relations (see Chapter 5):
|
rðtÞ ¼ r0 expð 6DrtÞ |
|
ð8:25Þ |
|||||||
|
|
|
|
|
|
|
|
|
|
|
|
1 |
1 |
ð1 |
þ 6DrtÞ |
|
|
ð8:26Þ |
|||
|
|
|
¼ |
|
|
|||||
|
|
r |
r0 |
|
|
|||||
|
|
|
|
|
|
|
|
|
|
|
which |
allow |
determination of Dr. In principle, a value of the |
viscosity h |
|||||||
ð¼ kT=6VDrÞ could be calculated from the Stokes–Einstein relation (8.3) provided that the hydrodynamic volume V is known. In addition to the problem of validity of the Stokes–Einstein relation (see above), the hydrodynamic volume cannot be calculated on a simple geometrical basis but must also take into account the solvation shell.
Introducing the rotational correlation time tc ¼ ð6DrÞ 1, Eqs (8.25) and (8.26)
can be rewritten as |
|
rðtÞ ¼ r0 expð t=tcÞ |
ð8:27Þ |

242 8 Microviscosity, fluidity, molecular mobility. Estimation by means of fluorescent probes
1 |
1 |
1 þ |
t |
|
ð8:28Þ |
|
|
¼ |
|
|
|||
r |
r0 |
tc |
||||
The changes in correlation time upon an external perturbation (e.g. temperature, pressure, additive, etc.) reflects well the changes in fluidity of a medium. It should again be emphasized that any ‘microviscosity’ value that could be calculated from the Stokes–Einstein relation would be questionable and thus useless.
8.5.3
Ordered systems
Equations (8.25) to (8.28) are no longer valid in the case of hindered rotations occurring in anisotropic media such as lipid bilayers and liquid crystals. In these media, the rotational motions of the probe are hindered and the emission anisotropy does not decay to zero but to a steady value ry (see Chapter 5). For isotropic rotations (rod-like probe), assuming a single correlation time, the emission anisotropy can be written in the following form:
rðtÞ ¼ ðr0 ryÞ expð t=tcÞ þ ry |
ð8:29Þ |
Time-resolved emission anisotropy experiments provide information not only on the fluidity via the correlation time tc, but also on the order of the medium via the ratio ry=r0. The theoretical aspects are presented in Section 5.5.2, with special attention to the wobble-in-cone model (Kinosita et al., 1977; Lipari and Szabo, 1980). Phospholipid vesicles and natural membranes have been extensively studied by time-resolved fluorescence anisotropy. An illustration is given in Box 8.3.
8.5.4
Practical aspects
From a practical point of view, the steady-state technique (continuous illumination) is far simpler than the time-resolved technique, but it can only be used in the case of isotropic rotations in isotropic media (Eqs 8.26 and 8.28) provided that the probe lifetime is known. Attention should be paid to the fact that the variations in steadystate anisotropy resulting from an external perturbation (e.g. temperature) may not be due only to changes in rotational rate, because this perturbation may also a ect the lifetime.
The time-resolved technique is much more powerful but requires expensive instrumentation.
It is worth pointing out that many artifacts can alter the measurements of emission anisotropy. It is necessary to control the instrument with a scattering non-fluorescent solution (r close to 1) and with a solution of a fluorophore with a long lifetime in a solvent of low viscosity (r A0). It is also recommended that the probe concentration is kept low enough to avoid interaction between probes.

8.5 Fluorescence polarization method 243
Box 8.3 Investigation of the dynamics and molecular order of phosphatidylinositol incorporated into artificial and natural membranesa)
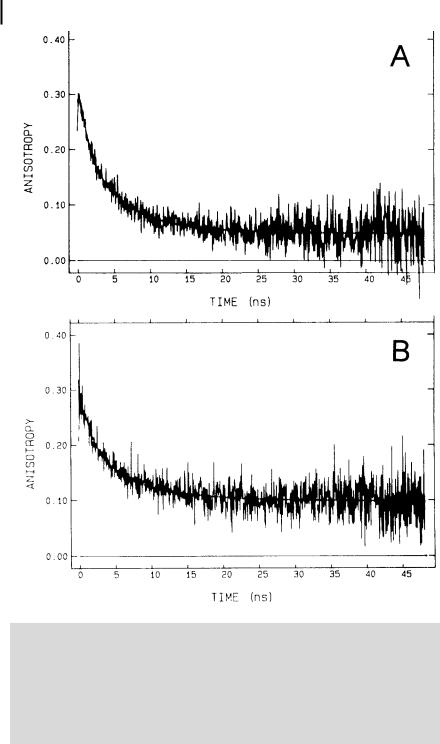
Lipid–protein interactions are of major importance in the structural and dynamic properties of biological membranes. Fluorescent probes can provide much information on these interactions. For example, van Paridon et al.a) used a synthetic derivative of phosphatidylinositol (PI) with a cis-parinaric acid (see formula in Figure 8.4) covalently linked on the sn-2 position for probing phospholipid vesicles and biological membranes. The emission anisotropy decays of this 2-parinaroyl-phosphatidylinositol (PPI) probe incorporated into vesicles consisting of phosphatidylcholine (PC) (with a fraction of 5 mol % of PI) and into acetylcholine receptor rich membranes from Torpedo marmorata are shown in Figure B8.3.1.
The curves were fitted using the following decay function, which must be considered as a purely mathematical model:
rðtÞ ¼ a1 expð t=tc1Þ þ a2 expð t=tc2Þ þ ry
where tc1 and tc2 are the correlation times for rotational di usion of the probe and ry is the residual anisotropy at long time with respect to the correlation times.
The parameters a1; a2; tc1; tc2, and ry are obtained from the best fit of IkðtÞ and I?ðtÞ given by Eqs (5.7) and (5.8) of Chapter 5:
IðtÞ
IkðtÞ ¼ 3 ½1 þ 2rðtÞ&
IðtÞ
I?ðtÞ ¼ 3 ½1 rðtÞ&
where IðtÞ is the total fluorescence intensity decay ½¼ IkðtÞ þ 2I?ðtÞ& that can be satisfactorily fitted in this case by a sum of two exponentials.
Then, according to the wobble-in-cone model (see Section 5.6.2), the order parameter that is related to the half angle of the cone, and the wobbling di usion constant (reflecting the chain mobility) can be determined.
For comparison, 2-parinaroyl-phosphatidylcholine (PPC) was also incorporated into the membrane preparations. For the Torpedo membranes, the acyl chain order measured by PPI was found to be lower than that by PPC, whereas the opposite was true for the vesicles. This inversion strongly suggests that PI has di erent interactions with certain membrane components compared to PC. In contrast, the correlation times of PPI and PPC were only slightly di erent in Torpedo membranes, and the values showed little di erence with those measured in vesicles.
244 8 Microviscosity, fluidity, molecular mobility. Estimation by means of fluorescent probes
Fig. B8.3.1. Fluorescence anisotropy decays at |
half angles of the cone are found to be 61 |
||||
4 C of PPI. A: in phospholipid vesicles (PC:PI, |
(A) and 45 (B), and the wobbling di usion |
||||
95:5 mol %). B: in Torpedo membranes. From |
constants are 0.041 ns 1 (A) and 0.020 ns 1 |
||||
the best fit of the I t |
and I |
|
(reproduced with permission from van |
||
ð Þ |
?ðtÞ components, |
(B) |
|
a) |
). |
and by using the wobble-in-cone model, the |
Paridon et al. |
|
|||
a)van Paridon P. A., Shute J. K., Wirtz K. W. A. and Visser A. J. W. G. (1988) Eur. Biophys. J. 16, 53–63.