

Neutron Scattering in Biology - Fitter Gutberlet and Katsaras
.pdf408 J. Fitter
is always possible, but appears to be more di cult and not straightforward if di erent approaches of data analysis are used. Unfortunately, this is generally the case when di erent researchers perform neutron scattering studies.
In order to judge results obtained with di erent approaches for the data analysis, we will shortly discuss the application of models: What is a reasonable model, what can we learn from a model, and what is the limitation of the applied model? First, we have to realize that all interpretations of dynamics in terms of correlation times and amplitudes of motions are based on models. Although often termed as model-independent parameters, the mean square displacements <u2> are also model parameters, describing a transient displacement of hydrogens from a mean position determined by a harmonic energy potential. Depending on the Q–ω-range this can be a reasonable model, because the mean square displacement is a descriptive parameter for amplitudes of motions which is also used for results obtained with other techniques. However, other simple models describing successive jumps of hydrogens between multiple sites also display important characteristics of protein dynamics. One has to consider that mean square displacements and jump distances obtained from the jump-di usion models in general give rather di erent values for amplitudes of motion. Therefore, it is not easy to answer the question of how large the e ective average amplitude of motion in a protein really is. The calculation of amplitudes is based on the Q-dependence of the elastic incoherent structure factor. Realistic models have to consider at least three parameters which determine the Q-dependence of the EISF:
–Jump distance or mean square displacement (e ective amplitude of motion).
–The number of adjacent jump-sites (local potential minima) which characterize the localized motion (depending on the observed Q-range this number can be finite or infinite in the case of continuous di usion).
–A fraction of hydrogens bound to the protein scatter purely elastic because their motions are outside the Q–ω-window of our measurement.
In a complex structure of a protein with a few thousand hydrogens as part of the protein structure, we cannot determine these factors with a su cient reliability because these factors are strongly coupled in the fits. In general, only data at higher Q-values can help to deconvolute these parameters in a fit and give a more detailed and precise picture of the characteristic motions in the protein. In practice such data for protein samples is not easy to measure (problems with counting statistics, more di cult separation of quasielastic components because higher orders of the Bessel functions have to take into account, for more details see Bee [17]). Therefore in the most cases the measured data is not su cient to overcome this problem of ambiguity and absolute values of e ective amplitudes of motions cannot be determined (see Fig. 17.2b). This is the reason why rather di erent values of amplitudes of motions were published for proteins by di erent authors using di erent procedures of data analysis [13, 30, 40–42]. However, comparative studies (applying
17 Conformational Dynamics Measuredwith Proteins in Solution |
411 |
superimposed (see for example [31]) with internal protein dynamics will have problems with this separation of solvent and protein dynamics when dynamics of the slower hydration water contributes significantly to the scattering.
–Proteins in solution perform rotational and translational di usion as a whole unit which may contribute to nonelastic scattering in the Q–ω regime of our measurements. For small and medium-sized globular proteins
the apparent di usion coe cient (including translational and rotational di usion of the whole protein) is in the order of 10−6 to 10−7 cm2 s−1. The translational di usion is proportional to 1/R (R: hydrodynamic radius of the protein) and the rotational di usion scales with 1/R3, while for both
types of di usion the di usion is proportional to the viscosity of the protein solution. In the case of medium-sized proteins (with R in the order of 30 ˚A) additional line-broadening due to whole molecules motions is in the order of 4–6 eV (at a Q-value of about 1 ˚A−1). With respect to a moderate energy resolution of about 100 eV (FWHM) this leads to an underestimation of the EISF in the order of 10%. This estimation is based on di usion coe cients (see above) measured at protein concentrations in the order of 2 mg ml−1 (and lower). In much higher concentrations as used for neutron scattering studies, the translational di usion drastically slows down [36], which will decrease the contribution of whole molecule motions in our spectra. For an adequate data treatment one has to consider the whole molecule motions by including an appropriate scattering component in the fitting procedure (see for example [41, 48]). In order to include this component in the data analysis, one has really to measure the apparent di usion coe cients for the given protein at those conditions (i.e., at the given concentrations, and for example in the folded and unfolded state) as used in the neutron scattering studies. For very high protein concentrations PFG-NMR or FCS are well-suited techniques to determine di usion coe cients.
The majority of published studies dealing with neutron scattering applied to protein solutions presents a data analysis employing simple jump-di usion models (di usion inside a sphere, three-site jump di usion; for details see the contribution by Lechner et al., Part I this volume). A comparison of theses studies exhibits rather di erent results. If we only focus on those studies with native proteins which apply the same model fits (di usion inside a sphere, see Sect. 17.4.1), the obtained radii vary from 1.2 to 5.5 ˚A (see for example [30, 40–42]). In most cases, the EISF reaches a plateau at higher Q-values which is in principle indicative for a certain fraction of hydrogens which do not di use in the observed Q–ω-space (consider however the less reliable data quality of di erence spectra at Q-values above 1.5 ˚A−1, see Fig. 17.3). The fraction of nondi usive hydrogens in the protein di ers significantly in the considered studies. Although di erent researchers performed studies with di erent proteins, it is unlikely that these rather large

412 J. Fitter
di erences mainly occur from a very di erent protein dynamics. It is more likely that mainly the way of sample preparation and the applied solvent subtraction procedures give rise to very di erent resulting parameter. However, for a comparative analysis of di erent species (e.g., folded/unfolded protein or homologous proteins) treated with the same procedures, these studies can nevertheless permit reasonable results and interpretations. Some applications and recent results from studies will be presented in Sect. 17.4.
17.4 Applications and Examples
It is well known that environmental conditions like temperature, hydration, salinity, or pressure have a profound influence on the stability of proteins as well as on the kinetics of enzymatic reactions. A promising approach to investigate the underlying mechanisms of protein stability by concurrent functionality, is to measure dynamical properties of proteins under extreme condition (high temperatures, high salt concentrations, high static pressure; see for example [31, 40, 42, 49–51]). One goal of studies in this direction is to figure out to which extent and how the dynamic properties contribute to the free energy which stabilizes the native folded state. For these purposes the protein structures of interest have not only to be studied in the folded state but also in the unfolded state.
17.4.1 Comparison of Folded and Unfolded States
In this section, results from measurements on an amylolytic enzyme, α- amylase from B. licheniformis (BLA), are presented. α-Amylases are subjects in numerous studies on protein stability and thermal adaptation [30, 52–54], because various species of this protein show a nearly identical 3D overall structure but rather di erent thermostabilities (homologues proteins). Samples of thermostable BLA dissolved in D2O-bu er were measured with the time-of- flight spectrometer IN6 (ILL, Grenoble). The obtained data (see Fig. 17.5) were analyzed using a simple jump-di usion model (di usion inside a sphere [55]).
The obtained di erence spectra (see Eq. 17.2) were fitted using one quasielastic (A1) and one elastic (A0) component
Sdi (Q, ω) = e−<u2>Q2 [A0(Q)δ(ω) + A1L1(H1, ω)]. |
(17.3) |
||||||||
Here A0 is given by |
|
|
|
|
|
|
|
|
|
A |
(Q) = |
3 |
sin(Qr) − (Qr) cos(Qr) |
|
2 |
, |
(17.4) |
||
|
|||||||||
0 |
|
|
(Qr)3 |
|
|
|
|
||
and is parameterized by |
the radius |
of the |
sphere |
r |
(for more |
details |
|||
see [11, 57]). |
|
|
|
|
|
|
|
|
|
414 J. Fitter
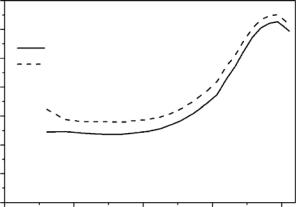
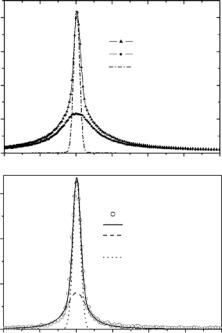
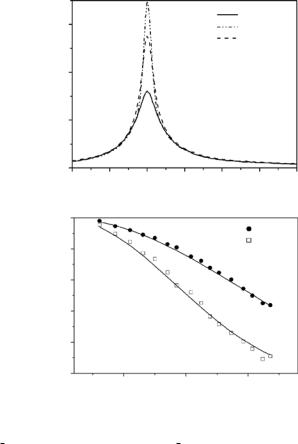
state) without solvent subtraction. We observe a large and mainly quasielastic contribution of D2O scattering in the spectra of protein solutions. In comparison to spectra measured with the unfolded state, spectra obtained from the folded state clearly show more pronounced elastic scattering accompanied by a reduced quasielastic scattering. This feature was analyzed in more detail by applying fits to the di erence spectra. Considering three spectral contributions, an elastic component, a single lorentzian (H1 = 150 ± 10 eV, the same for both states and constant over the Q-range used here), and a constant background, provide a su cient fit quality for the data within an energy transfer range from −1 to 2 meV. Such a result is consistent with the predictions of the applied model, where in the low Q-range the line width is constant with increasing Q [55].
The resulting elastic incoherent structure factors (A0) are shown as a function of Q in Fig. 17.5 (lower part). This figure clearly shows smaller A0-values and a steeper decrease of these values with Q for the unfolded state as compared to the folded state. In terms of the applied “di usion inside a sphere” – model we obtain a radius value of r = 1.2 ˚A for the folded protein and a clearly larger value of r = 1.8 ˚A for the unfolded protein. From this analysis the following picture of internal structural fluctuations emerges: Most of the nonexchangeable hydrogens are localized in the side groups ( 80%), and therefore the observed dynamics represents mainly side group di usive reorientations with an average correlation time of about 4.4 ps confined in the volume given by the radii. In accordance with other experimental results (e.g., [40, 42]), the increase of the radius in our model due to protein unfolding reflects a situation, where the proteins have less defined and more heterogeneous structures with a larger degree of freedom for structural fluctuations as compared to the folded state. A demonstrative description of this property is given by the concept of energy landscapes and the protein folding funnel [56].
Conformational fluctuations in proteins as measured with neutron spectroscopy can contribute significantly to the conformational entropy. In particular, measurements as a function of temperature, of denaturant concentrations, or comparative studies between homologues proteins can reveal important information about thermodynamic parameter. In contrast to the role of dynamics with respect to functional properties, where spatial resolution of dynamical features in principle is desirable (for example at the active site), the use of dynamical features for thermodynamic interpretations do not depend on spatial resolution. Therefore, neutron spectroscopy, which in general is not able to give information about the localization of observed structural fluctuations in a complex structure of a protein (for some exceptions see the contribution by Lehnert et al., this volume) is an ideal technique for deriving thermodynamic parameter, such as conformational entropy. An approach how to interpret neutron scattering data in this framework is described in the Sect. 17.4.2.

17 Conformational Dynamics Measuredwith Proteins in Solution |
415 |
17.4.2 Conformational Entropy Calculation from Neutron Scattering Data
The stability of the folded state of a protein, which is the native and functional state under physiological conditions, is operated by a subtle balance of enthalpic and entropic contributions (∆Gunf = ∆H − T ∆S). Both contributions consist of opposing fractions which either stabilize or destabilize the folded state (see for example [58]). The conformational entropy of the polypeptide chain is larger for unfolded state compared to the more compact folded state characterized by much more restricted conformational space (see Sect. 17.4.1). Therefore, this contribution stabilizes the unfolded state (∆Sconf = SU − SF > 0). The interaction of solvent water with nonpolar side chains of the protein stabilizes the folded state, because solvation of these side groups induces ordering of water which is unfavorable. Since nonpolar groups are exposed to the solvent mainly in the unfolded state and not in the folded state, this contribution stabilizes the folded state (∆Shyd < 0). As an approach to elucidate more details about the role of the conformational entropy during thermal unfolding, neutron spectroscopy can be utilized to measure structural fluctuations as function of temperature and to calculate conformational entropy changes from the data.
Proper entropy calculations are di cult, because these calculations require knowledge of the complete conformational space and are strongly influenced by correlations between the motions. However, on the basis of the applied analytical model an estimation of a contribution to the conformational entropy related to the observed picosecond dynamics is given here. Due to the fact that hydrogens located mainly in the protein side-groups (more than 80%) contribute to the observed scattering, we assume side-groups or parts of sidegroups as single individual “moving units”, which explore a certain part of the conformational space during their confined di usive motions. For these units we can calculate the conformational entropy by
Sconf = R ln(Z). |
(17.5) |
Here R is the gas constant (8.3144 J K−1 mol−1) and Z is the partition function
√
with Z = V /λ3D determined by the de Broglie wavelength λD = h/ 2πmkBT and by V, the accessible volume of the conformational space occupied by the corresponding state (see Fig. 17.6).
For amino-acid residues moving at the given temperatures (30–70◦C), the thermal deBroglie wavelength is 0.1 ˚A. Therefore, λ3D V and Boltzmann statistics is valid in the classical approximation (see [59]). The conformational entropy change during unfolding with a radius of confinement for motions in the folded state rf and in the unfolded state ru is given by
∆Sconf = Su − Sf = 3R ln |
ru |
. |
(17.6) |
rf |

416 J. Fitter
Model: diffusion inside a spear
Example of moving unit: side-grouping (m  100Da)
Radius
Fig. 17.6. Schematic representation of a polypeptide side-group di using in the volume of a sphere. With respect to the observed time regime the “moving units” are not only side groups (as shown here) but also part of side-groups (e.g., methyl groups) or parts of the polypeptide backbone. The given radius r simply determines the conformational volume V = 4πr3/3, which is explored by the “moving unit”
Using radius values as determined in Sect. 17.4.1 (at 30◦C) we obtain for ∆Sconf a value of 10.85 J K−1 mol−1 per residue (or 2.6 cal K−1 mol−1 per residue). Compared to estimated and measured ∆Sconf values given in the literature (see for example [8,9,60]) our value is in average smaller by 30–60%. Due to fact that our analysis covers mainly the picosecond time regime and contributions to the conformational entropy are also e ected by fluctuations in other time regimes, this deviation is pretty reasonable.
17.5 Conclusions and Outlook
It was demonstrated in this chapter that dynamical features of internal structural fluctuations in proteins can be extracted from measurements with proteins dissolved in bu er solutions. A number of useful procedures and precautions which have to be considered for a reasonable data analysis and interpretation were discussed. As already demonstrated in the presented and numerous published examples [30, 31, 40, 42, 50, 51], the challenge of neutron scattering studies applied to protein solutions is to increase the scope of biological relevant topics, where internal fluctuations of proteins play an important role. With the accessibility of next generation high-flux neutron sources (SNS, ESS) biological neutron spectroscopy will benefit significantly. Further applications on proteins with trapped folding intermediates, functional intermediate states, or on protein–protein and on protein–ligand interactions
17 Conformational Dynamics Measuredwith Proteins in Solution |
417 |
are of general interest in structural molecular biology and biophysics and are certainly in the scope of neutron spectroscopy.
Acknowledgments
The author would like to thank R.E. Lechner, N.A. Dencher, and G. B¨uldt for a long standing and fruitful collaboration. The presented work was partly supported by grants from the German Government (03DE4DAR-1 and 03DE5DA1-8).
References
1.H. Frauenfelder, S.G. Silgar, P.G. Wolyens, Science 254, 1598 (1991)
2.M. Karplus, J. A. MacCammon, Sci. Am. 254, 42 (1986)
3.A.E. Garcia, Phys. Rev. Lett. 68, 2696 (1992)
4.B.F. Rasmussen, A.M. Stock, D. Ringe, G.A. Petsko, Nature 357, 423 (1992)
5.J. Fitter, S.A.W. Verclas, R.E. Lechner, H. Seelert, N.A. Dencher, FEBS Lett. 433, 321 (1998)
6.L.E. Kay, Nat. Struct. Biol. 5, 513 (1998)
7.G. Zaccai, Science 288, 1604 (2000)
8.M. Karplus, T. Ichiye, B.M. Pettit, Biophys. J. 52, 1083 (1987)
9.A.J. Doig, J.E. Sternberg, Protein Sci. 4, 2247 (1995)
10.D. Yang, L.E. Kay, J. Mol. Biol. 263, 369 (1996)
11.J. Fitter, Biophys. J. 84, 3924 (2003)
12.W. Doster, S. Cusack, W. Petry, Nature 337, 754 (1989)
13.M. Ferrand, A.J. Dianoux, W. Petry, G. Zaccai, Proc. Natl. Acad. Sci. USA 90, 9668 (1993)
14.J.A. Rupley, G. Careri, Protein hydration and function, in: Advances in Protein chemistry, vol. 41, ed. by C.B. Anfinsen, J.T. Edstall, F.M. Richards, D.S. Eisenberg (Academic Press, New York, 1991) pp. 37–172
15.J.R. Lakowicz, Photochem. Photobiol. 72, 421 (2000)
16.N.L. Thompson, A.M. Lieto, N.W. Allen, Curr. Opp. Struct. Biol. 12, 634 (2002)
17.J. A. MacCammon, S.C. Harvey, in: Dynamics of Proteins and Nucleic Acids
(Cambridge University Press, New York, 1987)
18.F. Parak, E.W. Knapp, D. Kucheida, J. Mol. Biol. 161, 195 (1995)
19.A. Barth, C. Zscherp, Q. Rev. Biophys. 35, 369 (2002)
20.H. Deng, R. Callender, Methods Enzymol. 308, 176 (1999)
21.B.L. Stoddard, Curr. Opp. Struct. Biol. 8, 612 (1998)
22.J.C. Smith, Q. Rev. Biophys. 24, 227 (1991)
23.J. Fitter, R.E. Lechner, G. B¨uldt, N.A. Dencher, Proc. Natl Acad. Sci. USA 93, 7600 (1996)
24.J. Fitter, R.E. Lechner, N.A. Dencher, Biophys. J. 73, 2126 (1997)
25.F. Gabel, D. Bicout, U. Lehnert, M. Tehei, M. Weik, G. Zaccai, Q. Rev. Biophys. 35, 327 (2002)
26.J. Heberle, Biochim. Biophys. Acta 1458, 135 (2000)