448 H.D. Middendorf
The spectrometer FDS at Los Alamos works in this way, achieving an energy resolution ∆E/Eo of 3–5%.
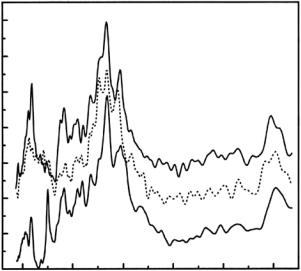
Biomolecular spectroscopy in the energy transfer regions covered by crystal or filter analyzer instruments is largely limited to the low temperature and low hydration regime, unless the emphasis is on water or ice dynamics “perturbed” by a biomolecular additive. Basic reasons for this are: (i) the scattering kinematics, which necessitates working at relatively high Q (Fig. 19.6) and consequently small mean-square displacements <u2> to give tolerable DW factors, and (ii) the absence of symmetry selection rules. The latter is an asset in studies of small, nearly anhydrous molecules where neutron spectra can provide unique data on optically forbidden modes. In experiments on more complex systems, however, the number of variously broadened excitations together with their overtones and combination lines becomes large and they merge into bands carrying weak, ill-di erentiated features. It is possible, in principle, to introduce contrast selectively by covalent H/D substitution, but at present this is not a realistic option for the sample sizes required. H/D exchange of the water of hydration and of labile groups (mostly OH, some NH) remains as the only way to introduce contrast. This is illustrated in Fig. 19.7 by spectra in the amide A+B region of collagen.
30 |
|
|
|
|
|
|
|
25 |
|
|
|
|
|
|
|
20 |
|
|
|
|
|
|
|
15 |
|
|
|
|
|
|
|
10 |
|
|
|
|
|
|
|
5 |
|
|
|
|
|
|
|
0 |
2250 |
2500 |
2750 |
3000 |
3250 |
3500 |
3750 |
2000 |
|
|
|
_ |
|
|
|
|
|
|
|
hw (cm−1) |
|
|
|
Fig. 19.7. High-frequency TOSCA spectra from collagen fibers: Hydrogenous (open circles) and exchange-deuterated (full circles) samples of aligned fibers (rat tail collagen) at 25 K. Prominent peaks at 3000 (CH, NH) and 3400 cm−1 (OH) are due to stretch modes. Hatched are spectral features “inversely” a ected (i.e., where deuteration leads to enhanced rather than decreased intensities) or shifted due to di erences in e ective oscillator masses
19 Biomolecular Spectroscopy |
449 |
19.5.3 Building Blocks and Model Compounds
Neutron studies of the dynamics of biological macromolecules need to be underpinned by similar work on their building blocks and on functionally important small molecules they interact with. Much current work focuses on saccharide–water interactions, in particular on understanding the molecular mechanisms that determine the remarkable e ectiveness of trehalose as a bioprotectant in nature and as a cryo-preservation agent in various applications [45, 46]. The problems addressed in this work relate closely to the role played by the glass transition phenomenon and its molecular characterization in H-bonded systems that are classed as more or less “fragile” in the terminology of physicochemical studies. Molecular dynamics (MD) simulations of saccharides in dilute aqueous solutions have shown that water molecules can be highly localized at polar and hydrophilic positions, and this e ect is expected to become more pronounced at higher concentrations. It is here that neutron data on proton mobilities and the concentration-dependent transition from jump to continuous di usion in saccharide–water systems provide valuable data that are di cult to obtain otherwise. Experiments using MARI and TOSCA have emphasized the role of intramolecular stretching and bending modes together with intermolecular librational modes [46].
Amino acids and peptides are another group of important building blocks for which neutron experiments are beginning to be performed more frequently. Proton translocation across potential barriers has been studied for a number of model systems, principally carboxylic acids and the model peptides N -methylacetamide (NMA) [47, 48], acetanilide (ACN) [49], and alanine dipeptide (AdP) [50]. NMA is the simplest of these as it consists of a single peptide group flanked by two CH3 groups. In ACN one of these is replaced by a phenyl ring; AdP is composed of two peptide groups and three CH3 groups. Synthetic polypeptides have also been examined: polyglycine (in parallel with NMA) and some triple-helical polypeptides (see Sect. 19.5.5).
Of the model peptides, ACN is by far the best characterized system as a result of anomalous optical properties that triggered a great deal of work on nonlinear mode coupling. TOSCA spectra for its hydrogenous form and two isotopomers have been analyzed in considerable detail by atomic trajectory simulations using the CHARMM package, incorporating anharmonic potential functions [49]. The low and intermediate frequency regions of ACN spectra are well developed (Fig. 19.8) and similar to that of some amino acids because of the aromatic ring in addition to the methyl group. The aim of neutron studies has been to simulate the full frequency and amplitude dependence for comparison with S(Q, ω) data on both isotopomers (ACN-d8 and ACN- d5), in order to characterize better the interaction of low-frequency lattice modes with amide proton vibrations. The phonon dispersion diagram has been calculated from CHARMM simulations, but further experiments providing Q- dependent data over a larger temperature range are required for conclusive interpretations.
450 H.D. Middendorf
|
0.75 |
torsion |
|
0.65 |
|
Methyl |
w)( |
0.45 |
|
|
135 |
|
|
S |
0.35 |
|
|
|
|
0.15 |
|
|
0.00 |
0 |
|
|
|
0.9 |
|
(w) |
0.6 |
|
45+135 |
|
|
S |
0.3 |
|
|
|
0.0
0
overtone |
0 |
|
C N |
|
|
|
|
Methyl |
|
|
group |
|
Methyltorsion |
H |
IIIAmide |
AmideV |
|
Peptide |
Phenyl ring |
|
group |
|
200 |
500 _ 750 1000 |
1250 1500 |
|
hw (cm−1) |
|
150 |
300 |
450 |
600 |
750 |
900 |
|
|
_ |
(cm−1) |
|
|
|
|
|
hw |
|
|
|
Fig. 19.8. Top: TOSCA spectrum of ACN-h9 at 25 K (solid line), compared with CHARMM simulation (hatched ). Details of ≈35 mode assignments up to 1500 cm−1 and force field parameters are given in [49]. Bottom: TOSCA spectrum of anhydrous glutathione at 30 K (solid line, y-shifted for clarity) compared with a simulation (dotted ) using GAUSSIAN 98 [51]. Note that a full trajectory simulation package (such as CHARMM) is needed to simulate spectra in the acoustic phonon region150 cm−1
Two peptides of biomedical interest are currently being studied using TOSCA in parallel with backscattering spectrometers [51]. Carnosine (CAS, β-alanyl-l-histidine) is an antioxidative and bioregulatory dipeptide, glutathione (GSH, l-(-glutamyl-l-cysteinyl-glycine)) is a ubiquitous tripeptide serving essential cellular functions. Both the CAS and the GSH spectra show numerous well-resolved peaks up to the Amide I and II region. The 100–900 cm−1 region of a TOSCA spectrum from GSH is shown in Fig. 19.8 together with a result from simulations in progress. The spectra obtained provide a good basis for comparison with and refinement of CHARMM simulations of GSH in the context of drug-binding studies involving glutathione S-transferase [52].
19 Biomolecular Spectroscopy |
451 |
19.5.4 Interpretational Aspects
Spectra from biomolecular systems pose challenging interpretational problems. Neutron techniques go beyond optical spectroscopy in that they furnish not only frequency distributions with emphasis on proton motions but also amplitude information. This puts greater constraints on the quantitative interpretation of neutron spectra, o setting to some extent the advantage (relative to optical techniques) of dealing with a much simpler elementary scattering process. Data from TOSCA and MARI are often analyzed by means of CLIMAX [53], a normal-mode spectral simulation program based on the Zemach– Glauber expression for scattering from a harmonic oscillator [11]. Apart from the three well-established molecular mechanics packages (CHARMM, GROMOS, AMBER), more sophisticated ab initio simulations incorporating density functional theory (DFT) have been used increasingly in recent years. In the context of neutron studies, DFT simulations were first employed by Ulicny et al. [54] to interpret low-temperature vibrational features of two antiviral agents (anthrone and bianthrone) belonging to the hypericin group of molecules.
During the 1990s, in CLIMAX simulations of spectra from NMA and polyglycine, Fillaux et al. [47, 48] found that satisfactory agreement between experiment and simulation could be reached only by discarding longestablished force fields and assuming instead that the proton and backbone dynamics were largely decoupled, leading to reassignment of the optically well-established N–H stretch frequency. Recent work by Kearley et al. [55] using DFT methods for the simulation of NMA spectra has gone some way towards resolving much debate and controversy about this subject. These authors concluded that previous CLIMAX simulations are seriously in error, and that the description of vibrations in molecular crystals such as NMA cannot be based on single-molecule dynamics but has to take into account intermolecular hydrogen-bonding.
19.5.5 Proteins and Biomaterials
In experiments on the dynamics of complex molecules, a strong case can often be made for using TOSCA and MARI (or HET) in parallel. Their energy ranges overlap to a large degree, and TOSCA data can already give a rough idea of the scattering response of a sample by providing “slices” through S(Q, ω) distributions. This approach was adopted in several experiments on biomolecules and model compounds.
As an example of MARI data, Fig. 19.9 shows sets of low-frequency spectra for D2O-hydrated samples of C-phycocyanin below and above the 200 K region [56]. As the only in vivo deuterated protein available in gram quantities (from algae grown in perdeuterated media), the light-transducing chromoprotein C-phycocyanin has been a prominent “guinea pig” protein for neutron studies ever since the first such experiments at Harwell and Grenoble
2.5 |
|
2.5 |
|
|
|
|
|
2.0 |
|
2.0 |
|
30 |
|
|
|
|
|
|
|
|
|
|
d-PC 100 K |
|
d-PC 240 K |
25 |
|
Lysozyme |
|
|
|
|
|
|
|
1.5 |
|
1.5 |
|
|
|
|
|
|
|
|
|
20 |
|
SNase |
|
|
|
|
|
|
1.0 |
|
1.0 |
|
15 |
|
|
|
|
|
|
|
|
|
|
|
|
|
|
10 |
|
BSA |
|
0.5 |
|
0.5 |
|
|
|
|
|
|
|
|
|
|
0.0 |
|
|
|
5 |
|
|
|
|
1 _ |
|
|
|
|
|
1 _ |
10 |
10 |
1 |
4 |
8 |
12 |
hw (meV) |
hw (meV) |
|
_ |
|
|
|
hw (meV) |
|
|
|
|
|
|
|
Fig. 19.9. Right: MARI spectra of D2O-hydrated d-phycocyanin binned in eight groups with <Q0> from 0.284 (lowest) to 2.87 ˚A−1 (highest traces) [54]. Distinct Q- dependent bands centered on 3–4 meV (24–32 cm−1) are observed at 100 K. Above the dynamic transition region they merge with rapidly increasing quasi-elastic broadening. Left: Spectral shape of “Boson peak” region with approximate band centroids (dotted lines) for lysozyme (3.80 meV), staphylococcal nuclease (4.03 meV), and bovine serum albumin (3.57 meV), measured using LAM-40 at KEK. Spectra averaged over 0.3 < Q < 2 ˚A−1. Adapted from [42]
in the 1970s [1, 21]. The bands shown in Fig. 19.9 and the way they change across the 200 K region relate to much-discussed questions about the significance of the ubiquitous “Boson peaks” observed in spectra from nearly all biopolymers. Three features of well-resolved data from MARI experiments are of particular interest: (i) substantially higher quasielastic wing intensities (0.5 ω 2 meV) at 240 K relative to 100 K, probably due to enhanced merging of low-frequency α-relaxation processes with a broad distribution of β-type relaxations at somewhat higher ω; (ii) disproportionate intensity increases at low-to-medium Q values relative to the high-Q spectra; (iii) redshift of the Boson peak centroids from 3.3 (100 K) to 2.8 meV (240 K). A more quantitative interpretation of these first results requires data at intermediate temperatures and full MD simulations.
In studies of natural biocomposites like bone or teeth, or of part-synthetic composites developed for medical applications, the dominance of modes due to protonated groups may be exploited to contribute decisive information to the interpretation of optical and NMR spectra. Bone is a dense composite of calcium phosphate crystallites and type I collagen fibers in roughly equal proportions, with about 15% of the volume occupied by living cells in channels and cavities. The structural and spectroscopic properties of variously substituted hydroxyapatite nanocrystals are of central interest here. In IR and Raman spectra, the vibrational modes of OH groups and hydrogen phospate are often masked in the presence of substituent anions, whereas in neutron spectra they show up prominently. Both the OH librational band at 660 cm−1 and
19 Biomolecular Spectroscopy |
453 |
nm-HAp
μm-HAp |
nm-HAp |
|
|
μm-HAp |
Bovine |
Bovine |
Rat |
Rat |
|
500 1000 _1500 |
2000 3000 |
hw (cm−1)
|
|
|
6 |
|
|
|
|
|
(w) |
4 |
|
|
|
|
|
|
|
|
|
|
|
135 |
|
|
|
|
|
|
S |
2 |
|
|
|
|
|
|
|
|
|
4000 |
5000 |
|
0 |
600 |
700 |
800 |
|
500 |
|
|
|
|
_ |
|
|
|
|
|
|
hw (cm−1) |
|
Fig. 19.10. Left: Neutron spectra of micrometer-sized and nanometer-sized hydroxyapatite (HAp) crystalline powders, compared with bovine and rat bone crystallites (y-shifted for clarity) (from [58]). Right: Decomposition of the OH librational band of HAp into components assigned to the monoclinic and the hexagonal form (from [57])
the high-energy bond-stretch region (3000–3600 cm−1), together with overtone and combination bands, provide valuable data relating in particular to questions about the degree of hydroxylation and the extent to which adsorbed water may have “contaminated” certain preparations. These problems are being addressed in current work at ISIS using TOSCA and HET [55], and at IPNS using the chopper spectrometer HRMECS [57] (Fig. 19.10). The bestresolved data come from TOSCA experiments [58]. Shown in Fig. 19.10 is an example of a decomposition of the OH libration band into four components is shown.
19.5.6 Biopolymers
Collagen [59], amylose [60], and DNA [61] are the only natural biopolymers for which wide-range vibrational neutron spectra have been studied. The lowfrequency region typically consists of two broad bands each carrying a number of distinct lines, the first due primarily to dispersive phonon modes and the second to weakly dispersive skeletal deformation modes. In the absence of MD simulations, the semiquantitative interpretation of collagen data from TOSCA and MARI requires comparison with spectra and normal-mode calculations for structurally related triple-helical polypeptides: polyglycine II (PGII), polyproline II (PPII), and (Pro-Pro-Gly)10 (PPG10). Theoretical results for PGII give a maximum due to longitudinal modes at 13 cm−1 in the isolated molecule, but this is shifted upward to 40 cm−1 when H-bonding to neighboring chains is taken into account. The intensity maximum appears to be due to an inflection in the longitudinal mode branch, induced by softening of modes with wavevectors matching the pitch of the crystallographic helix. The 45 cm−1 peak in collagen and PPG10 spectra can be identified with
1335
|
0.25 |
588 |
|
|
|
1040 |
|
0.20 |
920 |
|
|
|
) |
0.15 |
|
|
(w |
|
|
|
135 |
|
|
|
S |
0.10 |
|
|
|
|
|
0.05
0.00
−0.05
500 1000
1467 |
|
|
|
|
|
2650 |
2970 |
|
2395 |
|
PPG-h |
|
|
|
CL-h, 6% |
|
|
PPG-d |
|
1500_ 2000 |
2500 |
3000 |
hw (cm−1) |
|
|
|
Fig. 19.11. Comparison of TOSCA spectra at intermediate and high frequencies (all at 30 K): PPG-h and PPG-d, hydrogenous and deuterated (Pro-Pro-Gly)10; CL-h, collagen fibers oriented at right angles to the scattering plane, “dry” (6% H2O). Spectra shifted by ∆S = 0.05 relative to CL-h (from [59])
this maximum for longitudinal acoustic modes in PGII-like chains that are H-bonded and supercoiled to form the collagen triple helix (Fig. 19.11). The longitudinal acoustic phonon frequency in PGII matches that of its associated interhelical ice shell, suggesting e cient coupling between modes in the latter and the polypeptide backbone.
At higher energy transfers, the modes observed involve predominantly stretching or bending of C–H, N–H and O–H bonds, together with torsional deformations. The Amide V band is one focus of attention here. Triple-helical supercoiling leads to a downward shift of the Amide V mode of the Gly-Pro linkage, together with skeletal deformation and C=O in-plane bending modes of the Pro-Pro linkages. Examples are the various amide modes between 700 and 1550 cm−1, the in-plane and out-of-plane bending modes of aromatic ring hydrogens between 600 and 1600 cm−1, and the methylene and methyl deformations between 950 and 1450 cm−1. These major features of collagen spectra, and the assignment of several other bands and peaks on the basis of optical data and normal-mode calculations for triple-helical polypeptides, have been discussed in considerable detail [59].

19 Biomolecular Spectroscopy |
455 |
19.5.7 Nucleotides and Nucleosides
Low-temperature neutron spectra for dry polycrystalline powder samples of the purines (adenine, guanine), pyrimidines (cytosine, thymine, uracil), and the nucleoside uridine were measured at ISIS using TOSCA [62], whereas similar data for the nucleosides adenosine, guanosine, and cytidine were collected at ILL using the beryllium-filter spectrometer IN1-BeF [62, 63]. Following earlier, less refined simulations, most of the nucleotide and nucleoside spectra were reanalyzed during the past 4 years at the DFT level, by Gaigeot et al. [64] for isolated molecules and by Plazanet et al. [65] for hydrogenbonded unit cells with periodic boundary conditions. In 15 K spectra of the bases, for example, a large number of peaks in the interval 25–200 meV (200– 1600 cm−1) could be assigned to modes involving CH, NH, NH2, and ring deformations (Fig. 19.12). As in the peptide work discussed in Section 19.5.2, neutron spectra at T < 100 K reflect closely the normal modes, and state- of-the-art simulations can provide a wealth of detail on both frequencies and intensities when analyzed in conjunction with crystallographic data. It is an open question, however, to what extent the information gained from anhydrous systems at very low temperatures will be transferable to, and hopefully improve, the empirical potentials of the commonly used biodynamics simulation packages. TOSCA data for peptides [51] and DNA [61] show how features that are well-resolved below 100 K quickly coalesce into broad undi erentiated bands as the temperature is raised, due to the combined e ect of higher DW factors, enhanced overtone and combination lines, and the onset of anharmonic interactions.
186 |
312 |
357 |
409 450 |
535 577 |
660 710 |
763 |
845 |
925 |
975 |
1035 |
1090 |
1143 |
1230 |
218 |
277 |
|
499 |
625 |
|
|
|
|
|
|
|
|
|
201 |
434 |
528 |
577 |
771 |
831 |
1007 |
1240 1251 |
1417 1468 |
1527 |
166 |
|
907 |
1104 |
|
|
|
|
741 |
|
|
|
|
|
100 400 _ 800 |
1200 |
1600 100 400 _ 800 |
1200 |
1600 |
hw (cm−1) |
|
hw (cm−1) |
|
|
Fig. 19.12. Neutron spectra for anhydrous uridine (left) and uracil (right) at 15 K compared with DFT simulations for isolated molecules. Adapted from [64]

456 H.D. Middendorf
19.6 Neutron Compton Scattering (NCS)
For energy transfers beyond the highest excitations observable by the spectrometers discussed in Section 19.5.2, but below the region of ionizing interactions, neutron–nuclei collisions are dominated by a neutron analogue of the Compton e ect [66]. Neutrons with eV energies “see” target nuclei as almost free and interact with them over distances shorter than 0.1 ˚A. A key concept here is the impulse approximation (IA) according to which the dynamic structure factor S(Q, ω) (e ectively incoherent) consists of a superposition of Gaussians centered on the recoil energy Erec,i = ( Q)2/mi of each atom species i. The relevant partial structure factor Si(Q, ω) can be expressed as an integral over the product of ni(p) and δ(ω + p2/2mi − (p · Q)2/2mi), where p is the nuclear momentum and ni(p) the momentum distribution of nuclei with mass mi. The total intensity of each recoil contribution is proportional to the fraction of nuclei of mass mi in the sample weighted by the scattering cross-section, whilst its width and shape are related analytically to ni(p) along Q. The zero-order interpretation of NCS spectra, valid for Q −→ ∞, is based on the IA. In this limit, Si(Q, ω) is proportional to the neutron Compton profile, Ji(y), i.e., the projection of the ni(p) along the direction of Q. For large but finite Q, deviations from the IA are of great interest since they provide a means to measure two important quantities: ∆2V, the Laplacian of the interatomic potential V, and <F 2>, the mean-square force on the target atom.
At ISIS, the eV spectrometer VESUVIO [67] (formerly called eVS) has been used in several mostly exploratory experiments. Compton profiles have been measured for H and D in ACN crystals (Fig. 19.13) [68], in paracrystals
1.0
0.8
0.6
0.4
D
0.2
H
0.0
−2.5 0.0 2.5
I* (y)
_ 5.0 7.5 10.0 12.5 hw (eV)
0.5
0.4
0.3
0.2
0.1
0.0
−30 −20 −10 0 10 20 30 y (Å−1)
Fig. 19.13. Left: NCS spectrum from ACN at 2θ = 33◦, showing decomposition into near-elastic (C,O,N), deuterium (D), and proton (H) recoil lines (from [68]). Right: Proton Compton profile analyzed as superposition of pure Gaussian (impulse approximation, dotted line) plus asymmetric component representing the first term of Sears expansion (from [68])
19 Biomolecular Spectroscopy |
457 |
of DNA [69], and in aligned arrays of collagen fibers [70]. In a recent experiment on phospholipid bilayer stacks, the aim was to detect anisotropies in the mean kinetic energy of protonated groups due to the incorporation of a functionally important protein [71]. Although improvements in resolution and data reduction methods are needed before the full potential of NCS can be realized, it seems clear that we have a valuable new source of information here. This technique will be useful mainly for the study of highly ordered, minimally hydrated biomolecules and their building blocks. Exploiting orientation, H/D occupancies and temperature as principal variables, it should be feasible in favorable cases to unscramble well-resolved sets of neutron Compton profiles with the aim of obtaining direct information on potential well shapes and force fields.
19.7 Conclusions and Outlook
The instrumental developments and range of applications reviewed in this chapter demonstrate amply that neutron techniques using pulsed sources have an increasingly important role to play in work on biomolecular dynamics. Although at present only about one in six to seven biodynamics projects use pulsed-beam spectrometers, it is clear that this is bound to change substantially in the years following the commissioning of the new facilities under construction.
It is equally clear, however, that significant increases in data collection rates, while crucial for bringing sample sizes down to reasonable levels, are but one of three or four factors determining the overall impact of biodynamics work using neutrons. Paramount among these will be e orts to ease access and coordinate scheduling for users from the life sciences who are willing to embark on longer-term projects addressing problems for which neutron experiments can provide key data. Projects of this kind are likely to require substantial resources for producing selectively or fully covalently deuterated samples, which even for 10–20 mg quantities can be very considerable. While the value of neutron experiments in providing complementary or unique data is recognized by many biology users, the low level of access, haphazard system of beam time allocation and piecemeal data collection combine to make neutron techniques unattractive compared with NMR and optical techniques, which are widely available and seen as more user-friendly. Experiments addressing questions of more “direct” relevance to research in the life sciences have decreased markedly during the 1990s, whereas physics-dominated projects have increased steadily. This shift is largely due to experimental and simulation work focusing on e orts to understand glass-like transitions in globular proteins and fibrous biopolymers at T < 270 K.
The scientific programmes for the third-generation sources to be commissioned between 2006 and 2008 all contain strong commitments to prioritize applications of neutron scattering to soft-matter physics, materials science,