Neutron Scattering in Biology - Fitter Gutberlet and Katsaras
.pdf16 Quasielastic Neutron Scattering: Applications |
397 |
155.S. Magaz`u, G. Maisano, F. Migliardo, C. Mondelli, J. Phys. Chem. B 108, 13580–13585 (2004)
156.S. Magaz`u, G. Maisano, F. Migliardo, C. Mondelli, Phys. Chem. Chem. Phys. 6, 1962–1965 (2004)
157.M. Tehei, B. Franzetti, D. Madern, M. Ginzburg, B.Z. Ginzburg, M.-T. Giudici-Orticoni, M. Bruschi, G. Zaccai, EMBO Reports 5, 66–70 (2004)

17
Conformational Dynamics Measured with Proteins in Solution
J. Fitter
17.1 Introduction
Biological macromolecules, such as enzymes or transport proteins, share a structural complexity which is also reflected in a complex dynamical behavior. Therefore, a complete understanding of these biomolecules is possible only if we know the three-dimensional structures of the ground state and the intermediate states, the kinetics of conformational changes, and thermal equilibrium fluctuations occurring in the structures. In particular, fast stochastic fluctuations on a picosecond timescale (a typical task for neutron spectroscopy) are relevant to overcome energy barriers which are given by the energy landscape in the biomolecules [1–3]. These fluctuations can determine the kinetics of transitions between conformational (intermediate) states (see for example [4–7]). In addition, these fluctuations contribute significantly to the conformational entropy of a biopolymer and are therefore important for protein stability, protein folding, and protein–ligand interactions [8–11]. The variation of environmental parameters, such as temperature, hydration level, pressure, salinity, or pH, o ers a possibility to elucidate mechanisms how fluctuations control important properties of biomolecules, like catalytic activities or protein stability.
The ability to study proteins under most physiological conditions, which in most cases is provided by a solution, is a challenge for any experimental technique. Due to problems with strong solvent scattering (70–90% of the scattered intensity in a protein solution is related to solvent scattering), neutron spectroscopy was applied mainly to hydrated powder samples in the past. In some cases this type of sample with hydration levels in the order of 0.2–0.5 g solvent per gram biomaterial exhibits almost physiological characteristics (e.g., hydrated stacks of purple membranes, hydrated powder of myoglobin [5, 12, 13]). In a living cell, the volume fraction of biopolymers (mainly proteins) is in the order of up to 30%, but in general the concentration of one type of protein (there are about a few thousand di erent species in one single cell) is in the submicromolar regime (a notable exception from
400 J. Fitter
this can be found in the case of red blood cells with very high concentration of oxygen carriers such as hemoglobin). There is evidence that proteins already show many functional properties when hydrated with only 1–2 layers of water [14], which corresponds to a hydrated powder owing a hydration level of 0.3 g solvent per gram protein. However, in most cases globular proteins need much more surrounding solvent to ensure su cient di usion rates of substrates in order to display full functionality.
Other properties of interest, such as folding/unfolding transitions of proteins or specific protein–ligand interactions, are generally strongly perturbed by pronounced unspecific protein–protein interactions such as protein aggregation at very high protein concentrations (like in hydrated powders). Therefore, a protein solution (still with concentrations ≥20 mg ml−1) is a step in the right direction, at least if a broad spectrum of applications with rather di erent proteins is in the focus of interest. Recently, an increasing number of neutron spectroscopy studies investigating protein solutions are emerging in the literature. Approaches on how to gain information on structural dynamics of proteins in solution and how to investigate biologically relevant question with this type of samples are the purpose of this chapter.
17.1.1 Dynamics in Proteins:
Types of Motions and Their Biological Relevance
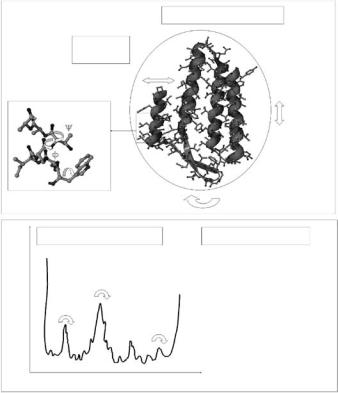
It is quite obvious to any considerate observer that a fundamental feature of living matter is “motion.” Rest of atoms or absolute rigidity of biological structures is indicative for death or at least for the absence of life. For a large scope of timescales and length scales living and motion are indispensable related to each other. In the case of biological macromolecules which consist of a few thousand atoms, the involved timescales of motions range from 10−14 s to seconds. Possible biological relevance of these motions would strongly depend on the particular functional role of the considered protein. Dynamical features of proteins having structural roles (constituents of fibrous tissue or muscle) are expected to play a di erent role as compared to enzymes or transport proteins. Our knowledge about these motions and their specific roles for function and for other aspects, like the structural stability, is far from complete. However, a promising step toward understanding these roles is to determine the nature of these structural fluctuations themselves. This includes the study of the amplitudes of motions, the probability of motions (how often they occur) and the timescales of motions. Various techniques, such as NMR spectroscopy [6], fluorescence spectroscopy [15, 16], molecular dynamics (MD) simulations [17], M¨ossbauer spectroscopy [18], vibrational spectroscopy [19, 20], time-resolved di raction techniques [21], and neutron spectroscopy [12, 13, 22–25] were already and are still employed to study these tasks. From a vast body of experimental and theoretical studies, a picture of protein dynamics emerged which is schematically summarized in Fig. 17.1.

17 Conformational Dynamics Measuredwith Proteins in Solution |
403 |
milliseconds, play a role for transport, signaling, and specific protein–protein interactions (see for example [32]).
17.2 Samples in Neutron Spectroscopy:
Sample Preparation, Sample Characterization,
and Sample Environment
As discussed by Lechner et al., Part I in this volume, the measured neutron scattering of biological samples is dominated by incoherent scattering from hydrogen nuclei for the most scattering angles (i.e., when Bragg reflections are not excited in the observed Q-space). The high density of hydrogen nuclei in all biological macromolecules results in a total scattering function S(Q, ω) which is dominated by the incoherent scattering function Si(Q, ω). The Fourier-transform in space and time of the latter provides a direct interpretation of dynamical properties by means of the so-called Van Hove self-correlation function Gs(r, t). Because the bound hydrogens are distributed more or less homogeneously in the protein structure, they serve perfectly as local probes to monitor internal structural fluctuations of the protein. Most neutron spectroscopy applications to biological samples deal with this type of measurements. Here, the measured spectra are utilized to estimate the trajectories of all hydrogens in a specific time and space window given by the instrumental settings (see the contribution by Lechner et al., Part I this volume). Unfortunately, trajectories of individual hydrogens cannot be resolved in a spectrum where in general a few thousand hydrogens, as bound in average to a protein, contribute to the total scattering function. However, a sum over the scattering from all these hydrogens is nevertheless a feasible measure of important dynamic properties of a biomolecule (see Doster, Lehnert et al., Sokolov et al., this volume and Sect. 17.4, this contribution).
In order to obtain appropriate samples for neutron spectroscopy, one has to consider all contribution (predominantly from hydrogens) of ingredients (bu er, solvent, etc.) with respect to their impact on the total scattering. Therefore, in general D2O is used as solvent instead of H2O, because the total cross-section of deuterium is smaller by a factor of 11 as compared to hydrogen (the incoherent cross-section of deuterium is even smaller by a factor of40 as compared to hydrogen). Due to their specific chemical environment various hydrogens in a protein structure are not bound covalently to the protein structure but can form hydrogen bonds either with other structural parts of the protein or with solvent molecules. Many groups in the protein, like back-bone NH-groups and various side-groups, such as tryptophan, arginine and asparagine, glutamine (the latter under specific pH condition), can act as proton donors in transient hydrogen bonds. As a consequence, extensive hydrogen/deuterium exchange has to take into account when deuterated solvents are used. In order to prepare proper samples with an uniform ensemble of well-characterized proteins, a stable and well-defined number of hydrogens
404 J. Fitter
bound to the protein exhibiting a scattering background as low as possible, the following procedures and precautions are helpful:
–The large amount of protein ( 100 mg, which is generally required for neutron spectroscopy studies) should be transferred in a deuterated bu er. An extensive washing and purifying of the protein sample is recommended because all exchanged hydrogens in the protein solution need to be removed. Further, quite often lyophilized protein powders (as received from the producer) contain salts or other ingredients which can give rise to unwanted scattering. For example, a threefold to fourfold use of a desalting gel filtration column gives reasonable results.
–If certain ingredients in the bu er are used in very high concentrations and if they contain hydrogens, it is necessary to use these ingredients in
a deuterated form. The rather high concentrations (1–5 mol l−1) of urea or guanidine hydrochloride (unfolding ingredients) are examples for which these considerations have to be taken into account.
–In the case of studies with unfolded proteins, one has to consider the fact that hydrogens in the interior of a folded protein might exchange only after a long time (sometimes after month) if ever. In the unfolded state the H/D exchange will be accelerated. In order to achieve proper results, one has to make sure that the H/D exchange of the folded protein is already (more or less) completed before performing the washing and purifying procedures (see above). Increased temperatures or other reversible “prefolding” conditions can promote a more complete H/D exchange.
–A proper characterization of the proteins in our sample before (and in some cases after) the neutron scattering measurements is a prerequisite for data analysis and any reasonable interpretation of results. Depending on the accessibility to various spectroscopic techniques and the specific topic of investigations the following measurements might be helpful or are necessary: (i) Vibrational IR-absorption of amide protons in the protein is
indicative for the completeness of H/D exchange (i.e., the comparison of amide II band (1550 cm−1) and of amide II band (1450 cm−1, see for example [30]). (ii) Tryptophan fluorescence emission spectroscopy and circular dichroism (CD) spectroscopy gives information about structural integrity of the 3D structure and of secondary structure elements (see for example [33, 34]). (iii) Dynamic light scattering (DLS) [35], PFG-NMR [36], Fluorescence correlation spectroscopy (FCS) [37] and SANS/SAXS [38] are well-suited techniques to measure di usion coe cients of proteins diffusing in solutions. These measurements are helpful in order to find proper condition for samples without unspecific aggregation.
–As mentioned earlier, in most cases the solvent is D2O. On the other hand, most published studies on enzymatic activity or thermodynamic properties (e.g., melting temperature Tm or Cp and Hm of the folding/unfolding transition) of the protein of interest, have been performed in H2O. Therefore,
17 Conformational Dynamics Measuredwith Proteins in Solution |
405 |
one has to check whether D2O solvent changes some of these properties significantly.
The average beam size of a neutron spectrometer is in the order of 10–20 cm2. In a reasonable neutron scattering experiment, one would like to illuminate as much sample as possible in order to obtain a good signal-to-noise ratio. The limiting factor (besides availability of sample material) is multiple scattering, caused by too high densities of scattering nuclei. As a rule of thumb the sample transmission T for neutrons should be in the order of 0.9. The sample transmission
T = e−ρs/ms·Na·(σs+σa)d |
(17.1) |
is a function of the density of scattered nuclei (ρs in g cm−3), the molecular mass (ms in g) of the scatterer, the scattering and absorption cross-sections (σs and σa both in 10−24 cm2, i.e., barns), and the e ective travelling length of neutrons through the sample (d in cm). A rather thin sample, covering an area in the order of the beam size, is appropriate with respect to our purpose. Slabshaped samples meet theses requirements. In the case of hydrated powders samples of biological macromolecules exhibit a thickness of a few tenths of a millimeter. For protein dissolved in D2O bu er the thickness can be around 1 mm. The sample containers (often made from aluminum because of its low neutron scattering and absorption cross-sections) must be sealed perfectly in order to prevent the sample from dehydration during the experiment. A typical measuring time is in the order of hours and the sample containers are often placed in vacuum. Therefore, sealing is a crucial point in sample preparation, and it is recommended to check proper sealing by weighing the sample before and after each measurement.
17.3 From Spectra to Results: Data Acquisition, Data Analysis, and Data Interpretation
The obtained experimental data in a quasielastic neutron scattering experiments using a time-of-flight or a backscattering spectrometer is a set of energy-transfer spectra measured at di erent scattering angles. For a proper data analysis and interpretation not only a su cient counting statistics of the sample measurements is essential but also an additional measurements of a vanadium sample (detector calibration and determination of the elastic energy resolution) and of the empty sample container (scattering background measurements) are required. If protein solutions are under investigation, an additional measurement of the pure bu er solutions can be used to subtract solvent scattering in order to isolate scattering solely from the protein. In this case, measurements with excellent counting statistic are required because the spectra of interest are di erence spectra (see below). Before more details about
406 J. Fitter
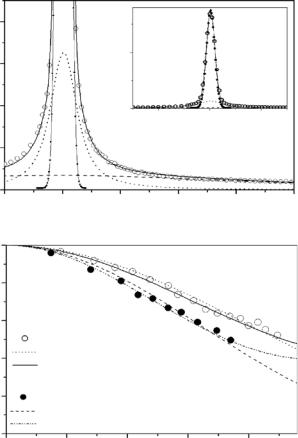
the data analysis of studies dealing with protein solutions are discussed, some general properties of scattering spectra from proteins are introduced first. As already shown in previous chapters, a typical energy transfer spectrum is characterized by a component of elastic scattering, several components of quasielastic scattering, and a continuum-like set of inelastic components occurring as a broad background scattering. The dominant quasielastic scattering from proteins at physiological conditions (room temperature and su cient hydration) is caused by a di usive type of motion and can be parameterized by Lorentzian-shaped curves (see Fig. 17.2a for hydrated powder samples).
This type of motion is specified by a characteristic correlation time (how often that type of motion occurs) and by an “amplitude” of the motion (a jump distance for example, depending on a specific model used for data interpretation). Characteristic correlation times of motions are obtained from the widths of the Lorentzian-shaped curves. The amplitudes are given by the Q- dependence of the elastic incoherent scattering amplitude (EISF or A0) (see Fig. 17.2b).
As mentioned earlier, we deal with a few thousand hydrogen nuclei bound to the protein, every single one in a slightly di erent environment, contributing to the measured total scattering function. Therefore, we would not expect a perfectly uniform type of motion for all contributing hydrogens. However, within the limit of the given energy and Q resolution (Qmax 2 ˚A−1), obtained spectra are characterized by the following properties:
–All spectra can be fitted reasonably well with only one or two quasielastic Lorentzian-shaped components (besides an elastic component and a flat background component).
–The obtained quasielastic components give line-widths which do not change significantly over the measured Q-range.
–The above described features are at least observable for di erent energy resolutions between 2 and 500 eV (FWHM). The line width of the major quasielastic component strongly depends on the elastic energy resolution and is, in average, two times larger as compared to the elastic energy resolution.
These observations, which are visible from the so-called phenomenological fits without using a specific model (see contribution by Lechner et al., Part II), give rise to the following picture: The protein dynamics is characterized by broad continuum of di erent correlation times (at least in the time regime from nanoseconds to picoseconds) of localized di usive, jumplike motions (e.g., polypeptide side-group reorientation). In this time regime, the “average amplitudes” of motion are in the order of 0.4–1.2 ˚A for native proteins. Because of the heterogeneous dynamic character of hydrogen movements in a complex structure like a protein, the obtained parameters (correlation times, amplitudes of motion) must be understood as averaged values. Nevertheless, one would like to use these parameters to compare protein properties at di erent environmental conditions, to compare these properties for