

Neutron Scattering in Biology - Fitter Gutberlet and Katsaras
.pdf478 W. Doster
0.12 |
|
|
|
|
|
|
|
|
|
|
Dry |
|
|
|
|
|
|
|
|
Vitrified |
|
|
|
|
|
|
0.08 |
|
Hydrated |
|
|
|
|
||
|
|
|
|
|
|
|
|
|
) |
|
|
|
|
|
|
|
|
2 |
|
|
|
|
|
|
|
|
>(Å |
|
|
|
|
|
|
|
|
2 |
|
|
|
|
|
|
|
|
x |
|
|
2 |
|
|
|
|
|
< |
|
< x1 |
> |
|
|
|
|
|
|
|
|
|
|
|
|||
0.04 |
|
|
|
|
|
|
||
|
|
|
|
|
|
|
|
|
|
|
|
|
|
|
< x22> |
|
|
0.00 |
|
|
|
|
|
|
|
|
0 |
50 |
100 |
|
150 |
200 |
250 |
300 |
350 |
|
|
|
|
T (K) |
|
|
|
|
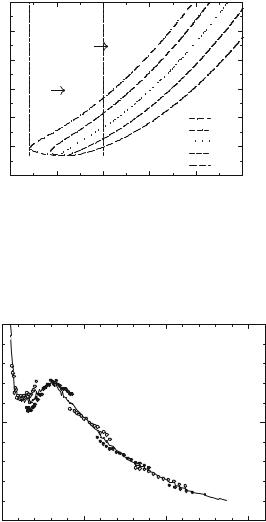
Fig. 20.13. Second moment of the displacement distribution (myoglobin, dry, d-glucose-vitrified and hydrated (0.4 g g−1) at a fixed time of 50 ps, derived from data in Fig. 20.12, closed symbols: harmonic component, open symbols: total displacements, lines: from fits in Fig. 20.12, (instrument: IN13, ILL)
|
4 |
|
|
|
|
|
|
|
T = 203, 213, ..., 323K |
Displacement distribution |
|
||
|
|
|
|
|
||
|
|
|
|
Hydrated myoglobin |
|
|
=50 10ps) |
3 |
|
|
|
|
|
2 |
|
|
|
|
|
|
(r,t |
Component 1 |
|
|
|
||
|
|
|
|
|||
s |
|
|
|
|
|
|
G |
|
|
|
|
|
|
π.24r |
1 |
|
|
|
|
|
|
|
|
Component 2 |
|
|
|
|
|
|
|
|
|
|
|
0 |
|
|
|
|
|
|
0.0 |
0.5 |
1.0 |
1.5 |
2.0 |
2.5 |
|
|
|
|
r (Å) |
|
|
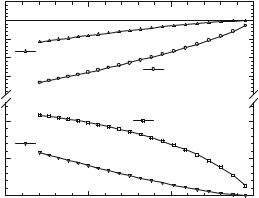
Fig. 20.14. Displacement distribution (myoglobin, D2O-hydrated (0.4 g g−1) at a fixed time of 50 ps versus temperature derived from data in Fig. 20.12, (instrument: IN13, ILL)
hydrogens, which are attached to the protein side-chains and, to a minor fraction, to the main chain. As discussed above structural changes of the protein chain involve mostly rotational jumps, while displacements in liquids are more continuous and on a small scale. Rotational jumps of methyl groups and of

20 Molecular Motions in Biomolecules |
479 |
heavy atom dihedral transitions are the most natural modes of motion of a polypeptide chain. Moreover, the partial cross-section due to methyl groups is about 25%, which is the most significant individual contribution. Since we know its partial cross-section, the structure factor and the barrier to rotation from energy-resolved experiments one can calculate the scattering function without adjustable parameters. The results are shown as the solid lines in Fig. 20.12 and 20.13. The average rotational barrier of methyl groups in myo-
globin amounts about 10 kJ mol−1. The increase in the apparent displacements
" #
due to component 2, ∆x2 2, in Fig. 20.13 most likely results from an increasing rotational rate at fixed instrumental resolution (50 ps). A low temperatures the apparent displacement of component 2 is zero because the transitions are too slow to be resolved by the instrument. The slight discrepancy between the data and the theoretical curve at low temperatures may indicate a distribution of rates. The close agreement with experimental data produced by this model suggests strongly that rotational transitions, essentially of methyl groups, are the origin of the nonGaussian displacement distribution. Dynamical heterogeneity seems to be of minor importance. Rotation of methyl groups occurs in the hydrated, the dry as well as in the vitrified state. Water induces additional small scale protein displacements, which appear as anharmonic enhancements of the vibrational component 1.
20.9 Data Analysis
High resolution instruments collect data at constant angle and not at constant Q in contrast to three-axis spectrometers. As a result one has to transform the experimental data from a “constant angle” to a “constant Q” format: The momentum exchange, ∆p = Q, at fixed angle, varies with the energy transfer ω, according to [17]
|
m |
+ ω − 2cos(θ) · E0(E0 + ω)). |
|
Q2 |
= 2 2n (2E0 |
(20.33) |
To determine the physically relevant quantity S(Q, ω) based on S(θ, ω) data involves extrapolation and interpolation as indicated in Fig. 20.15. Only the area of the kinetic plane enclosed by the lines contains experimental data. Figure 20.16 illustrates for a particular case, how the “constant angle” data di er from the final interpolated “constant-Q” spectrum.
The low-Q regime, which is quite important to data analysis, is hampered by two di culties; the necessity to extrapolate finite Q data and the relevance of multiple scattering. Multiple scattering tends to generate a Q- independent inelastic background [35]. Figure 20.17 shows that even for a thin sample with 91% transmission about 15% of the incident neutrons are multiply scattered.
 Mb-D
Mb-D


482 W. Doster
of seconds vanishes, because of reduced picosecond structural fluctuations as suggested in [39]. The essential dynamical quantity is the solvent viscosity (Eq. 20.1), which was not taken into account in [39]. The displacements of molecules on a microscopic scale including water molecules in the active site are discontinuous and always fast. The millisecond time scales come about by high energetic or entropic barriers which prevent particular rearrangements for long-time intervals. Enzymes are thus devices, which select by construction a small fraction of events out of a large number of fast structural fluctuations.
Acknowledgments
The author is grateful for technical support by the instrument responsibles of the Institut Laue Langevin and the collaboration with many colleagues, in particular with Marcus Settles, who rediscovered the moment method for biology. Financial support by the Bundesministerium f¨ur Bildung und Forschung ( grant 03DOE2M) is gratefully acknowledged.
References
1.K.A. Dill, Biochemisby 29 (1990), 7132–7155
2.W. Doster, M. Diehl, H. Leyser, W. Petry, H. Schober, in Spectroscopy of Biological Molecules J. Greve, G.J. Puppels, C. Otto (Eds.) (Kluwer, Dordrecht, 1999) pp. 655–659
3.W. G¨oetze, L. Sj¨ogren, Rep. Prog. Phys. 55 (1992), 241–376
4.J. Fitter, R. Lechner, G. B¨uldt, N.A. Dencher, Proc. Natl Acad. Sci. USA 93 (1996), 7600–7605
5.U. Lehnert, V. Reat, M. Weik, G. Zaccai, C. Pfister, Biophys. J. 75 (1998), 1945–1952
6.M.C. Bellissent-Funel, J.M. Zanotti, S.H. Chen, Faraday Discuss. 103 (1996), 281–294
7.W. Doster, S. Cusack, W. Petry, Nature (London) 337 (1989), 754
8.W. Doster, S. Cusack, W. Petry, Phys. Rev. Lett. 65 (1990), 1080
9.M. Tarek, D. Tobias, Mod. Phys. Lett. B 5 (1991), 1407
10.W. Doster, M. Settles, in Hydration Processes in Biology, Protein Dynamics, The Role of Hydrogen Bonds, Nato Science Series A Life Science, Vol. 305 (IOS Press, Amsterdam, 1998), pp. 177–194
11.J.L. Green, J. Fan, A. Angell, J. Phys. Chem. 98 (1994), 13780–13790
12.W. Doster, M. Settles, Biochim. Biophys. Acta 1749 (2005), 173–186
13.A. Kitao, F. Hirata, N. Go, Chem. Phys. Lett. 158 (1991), 447–472
14.S. Hayward, A. Kitao, F. Hirata, N. Go, J. Mol. Biol. 234 (1993), 1207–1217
15.G. Kneller, Chem. Phys 261 (2000), 1–24
16.F. Mezei, in Liquids, Freezing and The Glass Transition, J.P. Hansen, D. Levesque, J. Zinn-Justin (Eds.) (Elsevier, Amsterdam, 1991, Les Houches, 1989), pp. 632
20 Molecular Motions in Biomolecules |
483 |
17.M. Bee, Quasielastic Neutron Scattering (Adam Hilger, Bristol, Philadelphia, 1988), p. 16
18.W. Marshall, S.W. Lovesey, Theory of Thermal Neutron Scattering (Clarendon, Oxford, 1971)
19.F. Parak, E.W. Knapp, D. Kucheida, J. Mol. Biol. 161 (1982), 177–194
20.D.J. Bicout, Phys. Rev. E. 62 (2000), 261–271
21.K. Hinsen, A.J. Petrescu, S. Dellerue, M.C. Bellissent-Funel, G.R. Kneller, Chem. Phys. 261 (2000), 25–37
22.G.E. Uhlenbeck, L.S. Orstein, Phys. Rev. 36 (1930), 823–829
23.W. Doster, M. Settles, Biochim. Biophys. Acta 1749 (2005), 173–186
24.J.B. Boon, S. Yip, Molecular Hydrodynamics, (McGraw-Hill, New York, 1980)
25.W. G¨oetze, L. Sj¨ogren, Trans. Theory Stat. Phys. 24 (1995), 801–853
26.H. Leyser, W. Doster, M. Diehl, Phys. Rev. Lett. 82 (1999), 2897
27.M. Diehl, W. Doster, W. Petry, H. Schober, Biophys. J. 73 (1997), 2726–2732
28.W. Doster, T. Bachleitner, M. Hiebl, E. L¨uscher, A. Dunau, Biophys. J. 50 (1986), 213–219
29.M. Settles, W. Doster, Faraday Discuss. 103 (1996), 269–279
30.M. Settles, W. Doster, in Biological Macromolecular Dynamics, H. B¨uttner et al. (Eds.) (Adenine, New York, 1996), pp. 307–331
31.M. Sakamoto, B.N. Brockhouse, R.G. Johnson, N.K. Pope, J. Phys. Soc. Jpn 17 (1962), 370–376
32.M. Settles, Thesis (Technical University Munich, Munich, 1997)
33.H. Nakagawa, H. Kamikubo, I. Tsukushi, T. Kanaya, M. Kataoka, J. Phys. Soc. Jpn 73 (2004), 491–495
34.J.A. Hayward. J. Smith, Biophys. J. 82 (2002), 1216
35.S. Cusack, W. Doster, Biophys. J. 58 1990, 243–251
36.M. Tarek, D. Tobias, Phys. Rev. Lett. 88 (2002), 138101
37.H. Lichtenegger, W. Doster, T. Kleinert, B. Sepiol, G. Vogl, Biophys. J. 76 (1999), 414–422
38.T. Kleinert, W. Doster, H. Leyser, W. Petry, V. Schwarz, M. Settles, Biochemistry 37 (1998), 717–733
39.R.M. Daniel, J. Smith, M. Ferrand, S. Hery, R. Dunn, J. Finney, Biophys. J. 75 (1998), 2504

21
Internal Dynamics of Proteins and DNA: Analogy to Glass-Forming Systems
A.P. Sokolov, R.B. Gregory
21.1 Introduction
One of the main goals of protein research is to understand the relationship between protein structure, dynamics and function. Methods of structural analysis (X-ray di raction and NMR spectroscopy) are well developed and, as a consequence, the structures of thousands of proteins are now known. Describing the dynamic properties of proteins, i.e., exploring the potential energy landscape, and relating dynamics to function is a far more di cult task. The importance of protein and DNA motions for an understanding of their function, and the advantages of neutron spectroscopy for analysis of protein dynamics have already been emphasized in previous chapters. In this chapter we focus our attention on the internal dynamics of proteins and DNA. Their dynamic behavior exhibits many similarities to the dynamics of glass-forming systems or, speaking more generally, to dynamics of complex systems. Free translational di usion and rotation of a molecule as a whole is excluded from our discussion. These kinds of motions do contribute to neutron scattering spectra of protein solutions, but are usually easily distinguished from internal dynamics [1, 2].
Neutron scattering spectra of hydrated lysozyme and DNA are shown in Fig. 21.1. These spectra are typical for biological macromolecules at ambient conditions and are dominated by quasielastic scattering. The dynamics of proteins and DNA span an enormous time (frequency) range from picoseconds (THz) to seconds, and involve local atomic fluctuations, collective motions of side-chains and loops, segmental motions and a variety of rigid body motions such as hinge-bending [5]. Neutron spectroscopy easily covers the range from Terahertz down to ν 100 MHz, i.e., from picoseconds to nanoseconds. Using the neutron spin-echo (NSE) technique, the time scale can be extended to hundreds of nanoseconds. Because of some technical di culties, NSE has been used for analysis of protein dynamics in only a few cases [6]. Above ν 3 THz ( 100 cm−1) high-frequency atomic vibrations of small groups of atoms are present. This frequency range can be easily analyzed using modern IR or Raman spectroscopy. At frequencies below 3 THz collective excitations of many atoms (amino-acid residues and base-pairs) are present which are amenable to study by neutron spectroscopy.
21 Internal Dynamics of Proteins and DNA |
487 |
structure factor, S(Q, ω) (Fig. 21.1). The width of the quasielastic spectrum provides an estimate of the characteristic relaxation time. The quasielastic neutron scattering spectra are often approximated by a sum of a few Lorentzians from which the wave-vector (Q) and temperature dependence of the Lorentzian line width Γ are analyzed [1, 8]. It is known, however, that relaxation in complex systems, including biological macromolecules, usually cannot be represented by a single exponential decay, but instead involves a number of processes, each of which is strongly stretched [3, 7, 9, 12].
An alternative way to analyze quasielastic neutron scattering spectra is through their representation as the imaginary part of the dynamic susceptibility, χ (Q, ν), instead of the dynamic structure factor, S(Q, ν). The dynamic susceptibility is related to S(Q, ν) through the Bose occupation number nB(ν) = [exp(hν/kT ) − 1]−1
χ (Q, ν) S(Q, ν)/nB(ν). |
(21.1) |
The susceptibility presentation has several advantages: (i) trivial temperature variations are taken into account; (ii) scattering data can be directly compared to dielectric ε (ν) or mechanical G (ν) loss spectra; (iii) a relaxation process in the susceptibility spectrum appears as a maximum at νmax (2πτ )−1, where τ is a characteristic relaxation time; relaxation processes with wellseparated τ appear as separated peaks; (iv) the spectral shape of the susceptibility maximum provides information on the stretching of the relaxation process, usually highand low-frequency tails can be approximated by a power law χ (Q, ν) νa; where values of a = 1 or −1 correspond to a single exponential relaxation, while −1 < a < 1 corresponds to a stretched relaxation process or a broad distribution of relaxation times. In this respect the dynamic susceptibility presentation simplifies analysis of complex relaxation spectra.
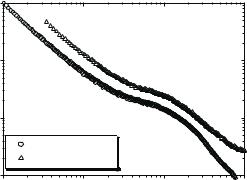
Figure 21.2 shows neutron scattering spectra of DNA and lysozyme using the susceptibility presentation. The spectra clearly show two well-separated relaxation processes in hydrated biomolecules, while only one, the fast process, remains in the spectra of dry DNA and lysozyme. Both processes are strongly stretched and an attempt to fit them by Lorentzian functions can give incorrect estimates of the characteristic relaxation times.
21.3 Slow Relaxation Process
In this section we focus on analysis of the slow relaxation process, its temperature and hydration dependence and its relationship to the dynamic transition. Susceptibility spectra of hydrated samples reveal a slow relaxation process with a maximum in the Gigahertz frequency range (Fig. 21.2). Time- of-flight spectrometers do not have su cient energy resolution to explore slow relaxation processes and so a combination of time-of-flight and backscattering spectrometers is required to provide reasonable spectra of the slow process in a
488 A.P. Sokolov et al.
Slow process |
Fastprocess |
||
|
|
||
103 |
|
|
|
|
Wet |
|
|
n"()(GHz)c |
Dry |
|
(a) |
|
|
||
|
|
|
|
|
Wet |
|
|
|
Dry |
|
(b) |
|
|
|
|
100 |
101 |
102 |
103 |
n (GHz)
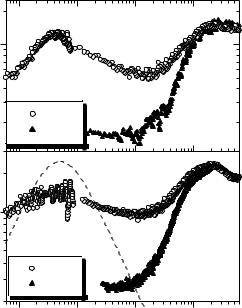
Fig. 21.2. The same spectra shown in Fig. 21.1 of hydrated DNA at T = 320 K (a) and lysozyme at T = 290 K (b) presented as the imaginary part of the susceptibility. The spectra are extended at lower frequencies using data from a backscattering spectrometer. The dashed line shows the spectrum expected for a single exponential relaxation (Lorentzian). Significant stretching is observed in the spectra of the slow process of both biomolecules. Spectra of dry samples at the same temperatures are shown for comparison. No slow process is observed in the spectra of dry samples. Data are from [3, 4]
broad enough frequency range. The slow relaxation process in hydrated DNA at T 320 K has a maximum at νmax 4 GHz (Fig. 21.2a) corresponding to a relaxation time τS (2πνmax)−1 40 ps. The maximum for the slow process in fully hydrated lysozyme at T 290 K appears at νmax 3 GHz, which corresponds to τS 50 ps (Fig. 21.2b). For comparison, Fig. 21.2 includes the spectrum that would be obtained for an intermediate scattering function, I(Q, t), consisting of a single exponential relaxation, i.e., I(Q, t) = exp(−t/τS) (a Lorentzian peak in the susceptibility spectrum). The slow relaxation peak observed for both protein and DNA is significantly broader than the Lorentzian peak, indicating that the slow relaxation process is strongly stretched in these systems (Fig. 21.2) [3, 9, 12] and better described by a Kohlrauch–Williams– Watts relaxation function: i.e., I(Q, t) = exp[−(t/τS)β ]. The slope of the susceptibility spectrum (χ (ν) ν−b) provides an estimate of the stretching exponent b 0.3 − 0.35 that appears to be rather temperature independent