Добавил:
Опубликованный материал нарушает ваши авторские права? Сообщите нам.
Вуз: Предмет: Файл:

Neutron Scattering in Biology - Fitter Gutberlet and Katsaras

.pdf
Скачиваний:
62
Добавлен:
10.08.2013
Размер:
10.95 Mб
Скачать

22 Structure and Dynamics of Model Membrane Systems

519

Static and dynamic

Correlation length scale

ξ

dz

Undulation lu

modes

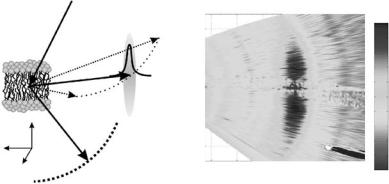
Fig. 22.8. Schematic of a double bilayer with some elementary excitations and the corresponding length scales. Apart from undulation modes with typical wavelengths of several hundred ˚Angstr¨oms, the short wavelength correlations and dynamics in the plane of the membrane can be probed by coherent neutron scattering. The corresponding length scale ξ is thereby in the order of 20 ˚A. dz is the bilayer thickness

X-ray scattering are related to the energy–momentum relation of the neutron versus the photon probe, strongly a ecting energy resolution, and accessible (Q,ω) range. At high Q the energy of the incident neutrons is in the range of the excitations (some microelectron volts) resulting in a high energy resolution (up to 300 eV), in comparison to 1.5 meV of the inelastic X-ray experiment. A better energy resolution in combination with a smaller ratio between central peak and Brillouin amplitudes leads to very pronounced satellites, which are easier to evaluate. This is of particular advantage for the identification of peaks in the central part of the dispersion relation, as well as for the experimental verification of a predicted nondispersive mode at high energies, as shown later. Due to the dispersion relation of the neutron itself ( Q2), the range at low Q and high ω values is di cult to access by INS. The determination of the exact speed of sound is therefore a domain of inelastic X-ray scattering.

The collective dynamics of the lipid acyl chains in the model system DMPC (-d54, deuterated 1,2-dimyristoyl-sn-glycero-3-phosphatidylcholine), were studied by INS. By selective deuteration of the chains, the respective motions are strongly enhanced over other contributions to the inelastic scattering

520 T. Salditt, M.C. Rheinst¨adter

cross-section. The dynamical structure factor S(Qr , ω) in the gel (Pβ ) and fluid (Lα) phase, and its temperature dependence in the vicinity of the main phase transition has been investigated. The measurements were carried out on the cold TAS IN12 and the thermal spectrometer IN3 at the high flux reactor of the ILL in Grenoble, France, the principles of which are described next.

The concept of TAS has undoubtedly been very successful in the investigation of collective excitations in condensed matter physics, i.e., phonons and magnons in crystals. Advantages of TAS are their relatively simple design and operation and the e cient use of the incoming neutron flux to the examination of particular points in (Q, ω) space. Figure 22.9 shows a schematic of a TAS. By varying the three axes of the instrument, the axes of rotation of the monochromator, the sample and the analyzer, the wavevectors ki and kf

w (meV)

14

Mono Analyzer

chromator

12

10


Neutron


guide

Sample

Detector

8


6


4


2


0

0

1

2

3


Qr (Å1)


(a)

(b)

Neutrons

Analyzer crystals

He3 Counters

Sample

Shielding Sheets

Fig. 22.9. Accessible (Q,ω) range of the cold TAS IN12 (top). The inset shows a schematic of a triple-axis instrument with monochromator, sample and analyzer. Principle of IN3’s multianalyzer detector (bottom (a)). 32 Cu-analyzer blades with a dedicated 3He counter (from [59]) each covering 1in scattering angle 2θ (b). All analyzers are arranged on a circle (with a radius of 1031 mm) and aligned to the same final energy of Ef = 31 meV

22 Structure and Dynamics of Model Membrane Systems

521

and the energies Ei and Ef of the incident and the scattered beam, respectively, can be determined. Q, the momentum transfer to the sample, and the energy transfer, ω, are then defined by the laws of momentum and energy conservation:

Q = k f − ki and ω = Ei − Ef .

(22.6)

The accessible (Q,ω) range of IN12 for a fixed energy of the scattered beam Ef of 10 meV is shown in Fig. 22.9 and covers very well the range of the excitations expected in phospholipid model membranes. It is limited by the range of incident neutron energies o ered by the neutron guide as well as by mechanical restrictions of the spectrometer. The instrumental energy resolution in this configuration is ∆ω = 500 eV. By choosing smaller incident energies and energy transfers the energy resolution can be enhanced. A detailed description of the experimental set-up and method can be found elsewhere [57, 58].

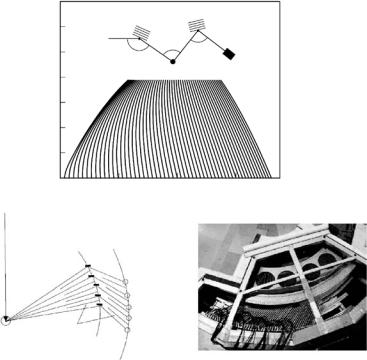
With a conventional TAS, single points in (Q,ω) space are scanned one by one. A more e cient use of the triple-axis technique is achieved by multiplexing, i.e., the use of several independent analyzer blades and position-sensitive detectors to investigate multiple (Q,ω) points at the same time. This option is implemented on the spectrometer IN3 by the usage of a multianalyzer detector. A schematic of the set-up is shown in Fig. 22.9a; Fig. 22.9b shows a photograph of the detector unit with analyzers and 3He counter tubes (for a detailed description of the set-up see Demmel et al., [59]).

The use of the multidetector is especially useful in systems with restricted dimensions. Considering the membranes as stacked two-dimensional layers, only two directions in space can be di erentiated, i.e., the plane of the bilayer, Qr , or the normal to it, Qz . Because of the missing periodicity in the third direction in space the scattered intensity is distributed rod-like in reciprocal space. The scattering is independent of one of the reciprocal axis and this allows to measure di erent Q vectors of the sensitive reciprocal axis at the same time in the di erent channels of the multi analyzer. The dispersion relation can therewith be measured for several Q-points at the same time. Considering elastic scattering, large areas of reciprocal space can be measured (or mapped) simultaneously.

22.5.2 Elastic Neutron Scattering

The use of a TAS o ers the possibility of measuring the static structure factor in the plane of the membranes, S(Qr ), the in-plane dynamics, S(Qr , ω), and the reflectivity on the same instrument in the same run without changing the setup (di raction is measured at energy transfer ω = 0). This is an invaluable advantage as the thermodynamic state of the lipid bilayer not only depends on temperature and relative humidity, but also on cooling and heating rates, preparation and thermal history. The combination of elastic and inelastic measurements (see later) leads to a complete picture of structure and (collective) dynamics of model membranes on a molecular length scale.

522 T. Salditt, M.C. Rheinst¨adter

(a)

(b)


Ki


Qr


)


–1


(A

0.6

0.4

0.2

0

500

450

400

350

300

Qz

z

x y Kf

Multidetector


250

0.2


200


0.4


150

0.6


100


50


0.8

1

1.2

1.4

1.6

1.8

2

0


Q

r

(A–1)


Fig. 22.10. (a) A typical multidetector Q-scan in reciprocal space. The incident (ki) and the outgoing beam (kf ) and the resulting momentum transfers Q for the di erent analyzer blades are given in the figure. (b) By rotating (rocking) the sample, the reciprocal (Qr , Qz ) space around the chain correlation peak can be mapped. The measurement was done in the gel phase of the phospholipid bilayer at T = 20

Figure 22.10 shows a (Qr ,Qz ) mapping of the interacyl chain correlation peak in the gel phase of the deuterated DMPC bilayer at T = 20C. Because of the quasi two dimensionality of the system, the peak is sharp in Qr , but the intensity is smeared out in the perpendicular Qz -direction. The data show excellent agreement with results of molecular dynamics (MD) simulations on the structure of lipid bilayers [60].

On IN12 temperature-dependent Q-scans through the interacyl chain peak of deuterated DMPC in the temperature range from T = 20C to T = 40C were performed to probe the static correlations in the plane of the bilayer. Figure 22.11a shows Q-scans of the interchain correlation peak at temperatures of T = 20 , T = 23, and T = 30C, respectively. The deuterated compound undergoes the phase transition from the more rigid gel phase into the liquid-like fluid phase at about Tc=21C, some degrees lower than in the protonated compound. When going from the gel to the fluid phase, the peak position changes to smaller Qr -values (larger average nearest neighbor distances) and the peaks broaden, indicating a decreasing correlation length ξr in the plane of the membranes.

Figure 22.11b gives Q0, the amplitude I and the correlation length ξr as obtained from the peak position, amplitude and width of the peak for all measured temperatures from T = 20–40C. The average nearest neighbor distance, as calculated from 2π/Q0, enlarges with temperature. Although the phase transition is of first order [22, 23, 61], the values point to a critical behavior (anomalous swelling) of the bilayer. As the analyzer cuts out only the elastically scattered neutrons and the quasielastic contribution to the background is reduced, the signal-to-noise ratio is drastically improved.

22 Structure and Dynamics of Model Membrane Systems

523

(a) 1400 T=20 C

T=23 C


1200

counts

T=30 C

1000

neutron

800


(b)


)

1.46

1


1.42

0


Q

1.38


intensity

1000

800


600

400

20

Q0

I

600

400

(Å)

r x

1.2

1.4

1.6

1.8


Qr 1)


xr

10


0

20

30

40


T ( C)


Fig. 22.11. (a) Q-scans of the acyl chain peak for temperatures from top to bottom T = 20, T = 23, and T = 30C through the main phase transition of the DMPC-d54 bilayer. (b) Q0, intensity and correlation length ξr as extracted from peak position, amplitude and width for all measured temperatures between T = 20 and 40

22.5.3 Collective Dynamics

A typical energy scan of deuterated DMPC collected at T = 20C, in the gel phase of the bilayer, measured on IN12 at Q = 1.0 ˚A1 is shown in Fig. 22.12. The inset shows the excitations of the bilayer in the gel and the fluid phase (T = 30C, nine degrees above the phase transition temperature), exhibiting well-pronounced peaks the position and width of which can be easily determined. The inelastic scans can be evaluated by the generalized three-e ective eigenmode theory (GTEE) [56, 62, 63], using the following function for leastsquare fitting:

S(Q, ω)

=

1


A0

Γh


+ As

γs + b(ω + ωs)

S(Q)


π

ω2 + Γh2

(ω + ωs)2 + γs2


(ω − ωs)2 + γs2


+

γs − b(ω −

ωs)

.


The model consists of a heat mode, centered at ω = 0 meV (Lorentzian with a width Γh), two sound modes, represented by Lorentzians at ω = ±ωs and a damping γs [62, 63]. From the width of the central mode, and the width and position of the Brillouin lines, the thermal di usivity, the sound frequency, and the sound damping can be determined, respectively, within the framework of a hydrodynamic theory. To fit the neutron data an additional Lorentzian component is added describing the broad quasielastic contribution presumably

524 T. Salditt, M.C. Rheinst¨adter


700

Qr =1.0 Å1


600

60

Pb´T=20˚C


counts

500

50


400

40


Neutron


300

30


La T=20˚C


200


20

6

5

4

PbT=20˚C


100


Qr =1.0 Å1


0


6

4

2

0

2


w (meV)

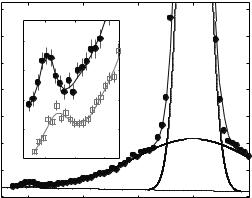
Fig. 22.12. Energy scan at a Qr = 1.0 ˚A1 in the gel phase of the bilayer. The inset shows the excitations of the bilayer in the gel (top) and the fluid phase (bottom)

associated with intramolecular degrees of freedom and incoherent scattering, not seen by inelastic X-ray scattering. The solid line in Fig. 22.12 is a fit by the three-e ective eigenmode model with an additional Lorentzian component.

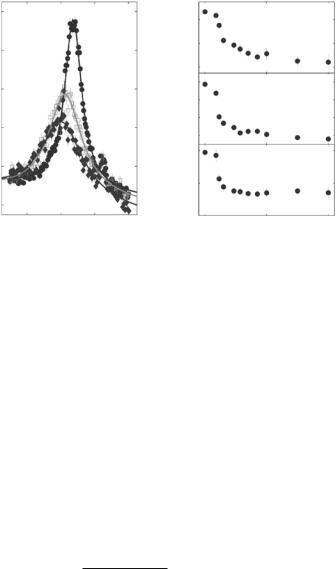
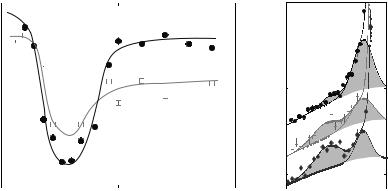
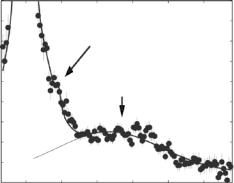
Figure 22.13a shows the dispersion relation in the gel and the fluid phase as measured by several constant Q-scans at Q-values ranging from Q = 0.7 to 3.0 ˚A1. The fluid dispersion has been measured far in the fluid phase of the DMPC bilayer. At small Qr , longitudinal sound waves in the plane of the bilayer are probed and give rise to a linear increase of ω Qr , saturating at some maximum value (“maxon”), before a pronounced minimum 0 (“roton”) is observed at Q0 1.4 ˚A1, the first maximum in the static structure factor S(Qr ) (the interchain correlation peak). Qualitatively, this can be understood if Q0 is interpreted as the quasi-Brillouin zone of a two-dimensional liquid. Collective modes with a wavelength of the average nearest neighbor distance 2π/Q0 are energetically favorable, leading to the found minimum. At Qr values well above the minimum, the dispersion relation is dominated by single particle behavior. The inelastic neutron data are less noisy and cover a wider range as compared to inelastic X-ray scattering [56]. A quantitative theory that predicts the absolute energy values of “maxon” and “roton” on the basis of molecular parameters is absent so far. However, the dispersion relation can be extracted from MD simulations by temporal and spatial Fourier transformation of the molecular real space coordinates [64] which shows excellent agreement.

Figure 22.13b shows corresponding energy scans taken at Q = 1.5 ˚A1 in the dispersion minimum for temperatures T between 20 and 40C. In the gel phase an excitation at ωs = 1 meV is found. At higher temperatures, the gel excitations decreases and a new excitation at energy values of ωs = 2 meV grows associated with the fluid phase. Clearly the excitations are not spurious

22 Structure and Dynamics of Model Membrane Systems

525

(a)

w(meV)


(b)

450


6


P


T=20 C (Lb´)


400


T=23 C (La)


5


counts


T=30 C (La)


350


4


neutron

300


3


250


2


La


200


gel


1


fluid


150


0

1.5

2

2.5

3


3 2 1

1


Qr 1)


w (meV)

Fig. 22.13. (a) Dispersion relations in the gel and the fluid phase of the DMPC bilayer as measured by several constant Q-scans at Q values ranging from Q=0.7 to 3.0 ˚A1. (b) Energy scans in the dispersion minimum at Q = 1.5 ˚A1 for temperatures T = 20C, T = 23C, and T = 30C (from top to bottom)

e ects as they are symmetric around the central peak. The assignment of the excitations to the particular phases is justified by their temperature dependence as in each phase there is a dominant excitation. Both modes are clearly dispersive and change its energy position when moving out of the minimum (Fig. 22.13a). Small traces of the “fluid excitation” are already present in the gel phase. At T = 30C, far in the fluid phase, the “gel excitation” is still present, indicating coexistence of fluid-phase and gel-phase domains. This coexistence is only observed in the range of the dispersion minimum, which coincides with the maximum of the static structure factor. One has to note that at the same time, the elastic scans do not show coexistence of two phases. While the transition is of first order, a pseudocritical swelling, i.e., a continuous change of the interlamellar distance in the range of Tc, is observed for DMPC and other lipids [22, 61, 65]. The changes in dz (see Fig. 22.3) are accompanied by corresponding changes in the mean distance between the acyl chains (Fig. 22.11b).

A crucial point is the size of the domains. The coexistence of macroscopic domains with sizes larger than the coherence length ξn of the neutrons in the sample would lead to a peak splitting of the acyl chain peak. Therefore, the domain sizes must be smaller than a few hundred angstroms estimated for ξn. Fluid domains in the gel phase and vice versa with sizes smaller than 0.01 m2 have been reported in a recent AFM study [66], and have been related to lateral strain resulting from density di erences in both phases. While the “maxon” and the high-Q range are energetically higher in the gel than in the fluid phase (due to sti er coupling between the lipid

526 T. Salditt, M.C. Rheinst¨adter

Neutron counts/mon

20

18

16

14

12

10

8

6

4

2

Qr =3.0 Å1

Dispersive mode

Nondispersive

mode

0

5

10

15

20

25

w (meV)

Fig. 22.14. Scan over a higher energy transfer showing both the dispersive excitation and the predicted by MD calculation

range at Qr =3.0 ˚A1 (IN3 data), nondispersive (optical) excitation

chains in all-trans configuration), 0, the energy value in the dispersion minimum, is actually smaller in the gel phase, roughly analogous to soft modes in crystals.

Figure 22.14 shows an energy scan in the gel phase at Qr =3.0 ˚A1, up to an energy transfer of 30 meV. Aside from the dispersive excitation due to in-plane density waves, a second nondispersive (optical) mode is observed at about ω = 14 meV with a width (FWHM) of about 13 meV, corresponding quite well to the predictions by Tarek et al., [64], and can be attributed to the motions of the methyl ends of the acyl chains. This mode was not observed by Chen et al., possibly due to the low signal-to-noise ratio in the inelastic X-ray measurements at high energy transfers.

22.6 Conclusions

Only a few methods are currently available to determine the fundamental smectic length scale Λ or the bilayer bending rigidity κ. While light scattering or optical microscopy techniques determine κ from thermal fluctuations on much larger length scales, which may lead to di erent values, X-ray powder di raction and line shape analysis is sensitive to Λ only in the limit of very soft and strongly undulating systems, untypical for phospholipids. By nonspecular neutron and X-ray scattering from aligned phases the bilayer structure and fluctuation is accessible over a wide range both for relatively sti and soft systems, covering length scales from the molecular scale up to a few 100 nm.

Nonspecular neutron scattering is a very useful tool to elucidate phospholipid membrane interaction on the basis of changing fluctuation and elasticity properties as described in this chapter. To this end, an appropriate model is

22 Structure and Dynamics of Model Membrane Systems

527

needed. Turner and Sens have explored the statistical physics of particle inclusions in smectic liquid crystals [67,68], providing a quantitative description of the deformation fields around static defects, as caused by inclusions. Their model, however, is based on the smectic model, and the inclusions lead to e ective smectic parameters, while the present data show that the scattering distribution can no longer be described by Caill´e theory.

Furthermore, the following problems are associated with the verification of the parabolic law HWHMqz (qx) predicted for smectic systems: (i) the width saturates for qx 0.01 ˚A1, indicating contributions from collective molecular motions that are distinct from bending, (ii) the initial increase in the curve shows some spread and may also be explained by functions other than parabolas. The first point is accompanied by corresponding deviations from the smectic model in the curve S(qx) also observed at high qx. We speculate that collective protrusion of peristaltic modes of the bilayers is at the origin of this observation. The present results have been verified by di erent samples and show consistency between two completely di erent modes of the experiments, monochromatic and TOF. However, suitable techniques of measuring the resolution, i.e., the intrinsic width of the cross-sections (cuts) along λ for constant angles 2θ have to be developed, in order to verify the resolution model according to [43].

Measurements of the collective short wavelength dynamics in lipid bilayers are a new but promising field, because the collective dynamics is likely to play a crucial role for di erent biological functions. The use of a triple-axis spectrometer allows to measure structure and dynamics, i.e., reflectivity, acyl chain correlation peak and in-plane dynamics, of model membranes on a molecular length scale in the same run without changing set-up. The dispersion relation measured in the gel and the fluid phase of the DMPC model system and the interpretation of the temperature dependent experiments point to a new interpretation of the gel–fluid phase transition and the collective excitations in lipid bilayers. Further inelastic investigations will address the influence of di erent head and tail groups to the collective dynamics.

On the interaction of peptides with model membranes the results presented also show that pronounced changes of the fluctuation spectrum occur already at moderate peptide concentration, e.g., at P/L = 0.005, where the changes in the specular reflectivity are still quite small. Furthermore the influence of cholesterol and membrane-active proteins will be studied, hopefully giving new insight into the functionality of these systems. The investigation of more and more complex systems might once lead to a better understanding of real biological membranes.

Acknowledgments

We thank R. Cubitt for helpful comments and for his great achievements in the design and construction of the novel D17 reflectometer, C. M¨unster and

528 T. Salditt, M.C. Rheinst¨adter

C. Ollinger for enjoyable collaborations on some of the original work discussed here, R. Siebrecht and V. Leiner for excellent support at ADAM, F. Demmel for help on the IN3 multidetector, G. Fragneto for experimental support and discussions and G. Brotons for helpful discussions regarding the data analysis. Financial aid by the Deutsche Forschungsgemeinschaft (DFG) through grants SA-772/3 and SA-772/4 and by the German Research Ministry under contract numbers 05300CJB6 and 05KS1TSA7 is gratefully acknowledged.

References

1.R. Lipowsky, E. Sackmann (eds.), Structure and Dynamics of Membranes, Vol. 1, Handbook of Biological Physics (Elsevier, North-Holland, Amsterdam, 1995)

2.G. B¨uldt, H.U. Gally, J. Seelig, G. Zaccai, J. Mol. Biol. 135 (1979), 673

3.M. Seul, M.J. Sammon, Thin Solid Films 185 (1990), 287

4.C.M. M¨unster, T. Salditt, M. Vogel, R. Siebrecht, J. Peisl, Europhys. Lett. 46 (1999), 486

5.J. Katsaras, Biophys. J. 75 (1998), 2157

6.J.F. Nagle, J. Katsaras, Phys. Rev. E 59 (1999), 7018

7.M. Vogel, C. M¨unster, W. Fenzl, T. Salditt, Phys. Rev. Lett. 84 (2000), 390

8.T. Salditt, C. M¨unster, J. Lu, M. Vogel, W. Fenzl, A. Souvorov, Phys. Rev. E 60 (1999), 7285

9.S.K. Sinha, E.B. Sirota, S. Garo , H.B. Stanley, Phys. Rev. B 38 (1988), 2297

10.R. Pynn, Phys. Rev. B 45 (1992), 602

11.C. M¨unster, PhD thesis, Sektion Physik, Universit¨at M¨unchen, 2000

12.J. Als-Nielsen, D. McMorrow, Elements of Modern X-Ray Physics (John Wiley & Sons, New York, 2001)

13.T. Salditt, C. Li, A. Spaar, U. Mennicke, Eur. Phys. J. E 7 (2002), 105

14.G. Pabst, M. Rappolt, H. Amenitsch, P. Laggner, Phys. Rev. E 62 (2000), 4000

15.A.E. Blaurock, Biochem. Biophys. Acta 650 (1982), 167

16.J. Katsaras, Biochem. Cell. Biol. 73 (1995), 209

17.T. Salditt, Curr. Opin. Coll. Interface Sci. 19 (2000), 232

18.D. Constantin, U. Mennicke, C. Li, T. Salditt, Eur. Phys. J. E 12 (2003), 283

19.U. Mennicke, PhD thesis, Institut f¨ur R¨ontgenphysik, Georg-August-Universit¨at G¨ottingen, 2003

20.C.R. Safinya, E.B. Sirota, D. Roux, G.S. Smith, Phys. Rev. Lett. 57 (1986), 2718

21.C.R. Safinya, E.B. Sirota, D. Roux, G.S. Smith, Phys. Rev. Lett., 62 (1989), 1134

22.J.F. Nagle, H.I. Petrache, N. Gouliaev, S. Tristram-Nagle, Y. Liu, R.M. Suter, K. Gawrisch, Phys. Rev. E, 58 (1998), 7769

23.H.I. Petrache et al., Phys. Rev. E 57 (1998), 7014

24.R.P. Rand, V.A. Parsegian, Biochim. Biophys. Acta 988 (1989), 351

25.T. Salditt, C. M¨unster, U. Mennicke, C. Ollinger, G. Fragneto, Langmuir 19 (2003), 7703

26.G. Smith, E.B. Sirota, C.R. Safinya, N.A. Clark, Phys. Rev. Lett. 60 (1988), 813

27.R.K. Thomas, J. Penfold, Curr. Opin. Coll. Interface Sci. 1 (1995), 23

28.T.M. Bayerl, R.K. Thomas, A. Rennie, J. Penfold, E. Sackmann, Biophys. J. 60 (1991), 1