Neutron Scattering in Biology - Fitter Gutberlet and Katsaras
.pdf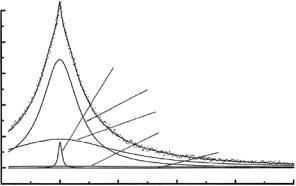
440 H.D. Middendorf
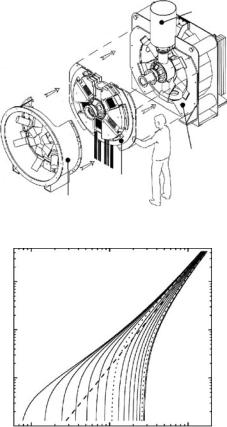
IRIS and OSIRIS are currently the two most advanced pulsed-source backscattering instruments [23]. In the “inverse” scattering geometry employed here (see Fig. 19.8 in Lechner et al. Part 1, this volume), the energy scan is achieved by the spread in velocity as neutron pulses from the moderator travel through a long guide toward the sample. Two disk choppers cut out a wavelength band that can be shifted over a wide interval by appropriate phasing. Neutrons scattered by the sample are energy-analyzed in near-backscattering (175◦) by two semicircular crystal arrays: a 51-element pyrolytic graphite (PG) array, and a similar mica array on the opposite semicircle. Backscattered neutrons are detected by 2 ×51 scintillator counters on a 0.55-m circle just below the analyzer-sample plane. By resetting chopper phasings and acquisition windows, it is possible to configure instruments of this kind for resolutions between ≈1 and 100 eV with energy windows ranging from around 100 eV to several meV.
Although spectrometer configurations o ering resolutions <10 eV are already available at ISIS, they are rarely used because of the demands on beam time. This will change dramatically with IRIS-type spectrometers on the new spallation sources because of both higher flux levels and the fact that these instruments are well suited to multianalyzer operation. The backscattering spectrometer DYANA [24] at JSNS, for example, features a stack of three analyzer banks, which can be moved into and out of the scattering plane. Since the emphasis in future work will increasingly be on complex and challenging biomolecular systems requiring measurement of di erence structure factors ∆S(Q, ω) with high accuracy, the potential of instruments such as DYANA for leading-edge experiments and for opening up new applications of neutron spectroscopy is very substantial indeed.
19.4.1 Hydration Dynamics
Hydration experiments using IRIS and OSIRIS have been concerned mostly with the dynamics of sorbed water in globular and fibrous proteins [25– 28], and in fully hydrated systems such as polysaccharide gels [29, 30] or “crowded” solutions [31]. Parameters characterizing nanoscopic mobilities are extracted from multicomponent lineshape analyses, which typically reveal slightly broadened elastic peaks and a superposition of Lorentzian-like wings. The range and quality of IRIS data are such that it is often possible to analyze lineshapes in terms of contributions from three dynamically distinct proton populations: (i) tightly bound backbone protons and other protons that belong to very slowly fluctuating structural elements, both contributing an e ectively elastic fraction δ(ω); (ii) protons belonging to closely associated waters and mobile side chains, with highly restricted rotational and librational degrees of freedom; (iii) protons of water molecules in the secondary hydration shells, with reduced translational and rotational mobilities that are qualitatively similar to those of supercooled H2O. The Q-dependence of the
19 Biomolecular Spectroscopy |
441 |
relevant width parameters are key quantities here, together with geometrical information contained in the elastic incoherent structure factor (EISF [2]).
Spectra obtained from aqueous polysaccharide gels at IRIS have provided insight into fundamental aspects of water–biopolymer interactions [29,30]. The polymer matrix dynamics and solvent coupling in agarose and hyaluronate gels di er substantially as a result of very di erent Coulomb interactions along their hydrated chains. For gels in the 1–20% concentration range, the spectra have been analyzed in terms of two mobile proton populations plus an irrotationally bound fraction. Agarose forms well-defined gels down to low concentrations, allowing a “perturbative” approach: spectra can be measured for a concentration series covering the transition from pure H2O to a dilute gel and then in steps to more concentrated gels. The data reveal changes in the solvent dynamics introduced by a random, increasingly dense 3D network of hydrophilic fibers carrying OH groups that mesh with and perturb transiently hydrogen-bonded water clusters. The Q-resolution made it possible to observe an oscillatory component in Γt(Q), the translational water proton mobility. This component appears to be the dynamic signature of density fluctuations with a correlation length of about 6 ˚A. MD simulations of pure H2O have predicted density fluctuations involving clusters of 20–30 waters [32]. The spatial wavelength extracted from Γt(Q) via Fourier transformation is close to the most probable cluster size determined by simulations. This suggests that superimposed on the dominant nearest-neighbour jump di usion there is a nanoscopic process associated with the breaking and reforming of water aggregates with average diameters of 10–12 ˚A.
19.4.2 Low-Temperature Dynamics and Glass-Like Transitions
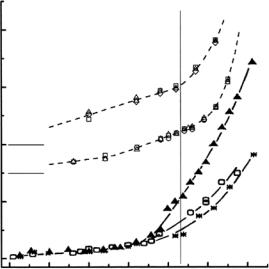
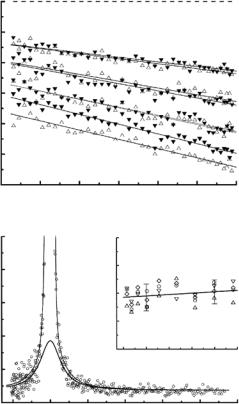
Observing the evolution of the energy landscape of biomolecules from very low to near-ambient temperatures has been a focus of much neutron work since the pioneering studies of Rorschach et al. at Oak Ridge [33]. Due to their size and complex architecture, biomolecular systems possess a large number of conformational substrates, which may be described by a potential energy hypersurface (or “energy landscape”) resembling that of small-molecule glass formers. Oligopeptides and proteins hydrated with H2O or D2O at specific hydrations h up to ≈0.7 (h = g water/g anhydrous protein) have been used in IRIS and OSIRIS experiments on the “unfreezing” of softer degrees of freedom and activation of anharmonic modes around 200 K [25–28, 34, 35]. The aim here is to obtain data either in the form of window-integrated intensities, Sqe(Q, T ), or as fully resolved dynamic structure factors that quantify the spectral evolution of low-frequency fluctuations and localized di usive modes. Since for H2O-hydrated and slightly D2O-hydrated biomolecules the scattering is incoherent to a good approximation, Sqe(Q, T ) is essentially proportional to a proton-weighted Debye–Waller (DW) factor in regions where the dynamic behavior is adequately described by a system of harmonic or
19 Biomolecular Spectroscopy |
443 |
Three conclusions have emerged so far: (i) <u2p> values increase substantially from around 200 K, as expected, but in addition the low-Q behavior of Sqe(Q, T ) exhibits some “up” vs. “down” di erences that may be ascribed to di erential freezing vs. unfreezing of low-frequency modes over 15– 20 ˚A (Fig. 19.5); (ii) the build-up of small shoulders in the wings at the onset of anharmonic and mode-coupling processes allow Q-dependent broadenings to be determined (Fig. 19.5); (iii) both the window-integrated and the spectrally resolved structure factors show small but significant di erences at and above 235 K that depend on thermal history. Experiments of this kind shed light on the molecular basis of glass-like transitions, especially by providing data constraining the parameters of studies modeling proteins as hierarchically organized multilevel systems.
19.4.3 Enzyme Dynamics and Folding–Unfolding Processes
S(Q, ω; T ) functions derived from neutron spectra provide a basis for interpreting the “unperturbed” dynamics of biomolecules. For a fuller understanding of functionally relevant properties, it is necessary to probe interactions with other (usually smaller) molecules, or to probe the response to externally applied electric fields or irradiation, e.g., by laser pulses. The redistribution of low-frequency modes as a function of ligand binding, changes in enzymatic activity, or folding/unfolding processes is of particular interest here [38]. This is typically done by measuring spectra for two states A and A of a solution sample in consecutive runs, plus additional runs for bu er and ligand alone. Data of this kind may be analyzed (i) to quantify changes in the wings of quasielastic peaks and their merging into damped low-frequency modes, and (ii) to derive proton-weighted frequency distributions ∆Zp(ω) from spectral changes in the 1–50 meV region (8–400 cm−1) with the aim of relating them to macroscopic quantities characterizing the A → A transition.
Very few studies along these lines have been undertaken so far, reflecting the di culty of separating spectral contributions due to the dynamics of interest from those due to the D2O bu er. It is essential to minimize “excess” solvent scattering that is unlikely to a ect the macromolecular dynamics. Although the total specific cross-section of a hydrogenous D-exchanged protein is larger than that for D2O by a factor of about 6, volumetrically the protein signal gets “diluted” quickly as the concentration is lowered. Since the information in nearly all such experiments is carried by the predominant incoherent scattering, the problem is that toward lower concentrations the useful signal becomes smaller, whereas at higher concentrations the scattering from “excess” water and from the shell of water closely associated with the protein globule become comparable. In the latter situation, reliable di erence structure factors ∆S(Q, ω) characterizing the macromolecular dynamics proper cannot be extracted just by subtracting spectra measured for the bu er alone.

19 Biomolecular Spectroscopy |
445 |
In early experiments at ILL [1,39], attempts were made to observe changes due to “hinge-bending” modes, i.e., low-frequency motions of domains around the active site of an enzyme. Di erence spectra for lysozyme revealed that the lysozyme–(NAG)3 complex (NAG = N -acetylglucosamine) is “tighter” than the free enzyme, and that the di erences are larger at Q values corresponding to distances of 10–15 ˚A. The only experiment on enzyme–ligand interactions using pulsed-source spectrometers was performed at KEK [40]. In spectra from Ca-saturated calmodulin with and without bound mastoparan (a tetradecapeptide), Izumi et al. observed di erence bands centered on 4 and 50 meV (30 and 400 cm−1).
Significant redistributions of low-frequency modes accompanied by increases in di usive degrees of freedom occur when a protein begins to unfold. In experiments at KEK, Kataoka et al. [41,42] compared neutron spectra measured for staphylococcal nuclease (SNase) at 100 and 300 K with those from a deletion mutant. This mutant lacks 13 residues at the C-terminal (SNase-13) and is known to assume a compact but denatured form. Relative to native SNase, the SNase-13 sample gave enhanced quasielastic but less inelastic scattering. To circumvent problems associated with solvent subtraction, slightly hydrated protein powders (h = 0.39) were used in these experiments. These few early results on ternary systems and functionally relevant interactions can only give a glimpse of what will be possible in the future once fast and versatile pulsed-source spectrometers capable of producing high-quality spectra from small samples become available.
19.5 Inelastic Scattering at 1 meV < ω < 1 eV (8 < ω < 8, 000 cm−1)
At higher energy transfers, overlapping with backscattering instruments in the 1–10 meV region (8–80 cm−1), two types of pulsed-source spectrometer cover about three decades in ω: (i) direct-geometry chopper spectrometers provide large sets of Q-dependent spectra within the accessible Q, ω-domain, whilst (ii) time-focusing crystal-analyzer or filter-di erence instruments produce only one or two spectra constrained to fixed trajectories in Q, ω-space. For (i), typical areas of application involve mapping out S(Q, ω) functions characterizing collective processes, which are either intrinsically Q-dependent (such as phonons or Brillouin modes), or for which a Q-dependence could give clues to their nature (such as bands in the “Boson peak” region). Instruments of type (ii), on the other hand, are high-throughput spectrometers designed to resolve e ectively nondispersive excitations over a wide ω range at Q values reflecting short-range interactions.
Optical spectroscopy units are commonly used in this area of neutron scattering: 1 meV = 8.06554 cm−1, 1 cm−1 = 0.12398 meV.

446 H.D. Middendorf
Table 19.2. Chopper (direct geometry) and crystal or filter analyzer (indirect geometry) spectrometers at pulsed sources. Highest energies accessible are between 0.5 and 1 eV
Facility |
Current |
Chopper instruments |
Crystal or filter analyzer |
|
A |
|
instruments |
ISIS |
190 |
MARI, HET, MAPS |
TOSCA (TFXA) (crystal) |
LANSCE |
100 |
HRMECS |
FDS (Be-filter) |
IPNS |
15 |
PHAROS |
CHEX (crystal) |
KEK |
6 |
INC |
CAT (crystal) |
|
|
|
|
19.5.1 Chopper Spectrometers
Direct-geometry chopper spectrometers on pulsed sources (Table 19.2) are straightforward adaptations of reactor instruments. Since the time structure of pulses is already “prepared” by the source, a single Fermi chopper (a fastrotating assembly of curved slits) plus one or two slower auxiliary disk choppers (to suppress background) are su cient to select a wide range of nearmonochromatic slices from the incident pulses. For geometrical reasons and the fact that the sample is not exposed to some fraction of the full spectrum of incident neutron pulses, direct-geometry spectrometers are easier to equip with low-angle arrays. This is an attractive feature for macromolecular work where low-Q coverage down to 0.1 or 0.05 ˚A−1 is desirable. MARI at ISIS, the fastest and best equipped instrument, uses a Fermi chopper to give incident energies in the range 9–1000 meV with resolutions of 1–2% [43]. It is similar in design to its sister machine HET, but with detector banks (920 detectors in total) providing full angular coverage from 2θ = 3◦ to 135◦. The range and quality of MARI data allow excellent 2D or 3D visualization of dynamic structure factors S(Q, ω), a data presentation option that is highly developed for this instrument.
19.5.2 Crystal-Analyzer and Filter-Di erence Spectrometers
Of the four instruments of this kind listed in Table 19.2, the time-focusing crystal-analyzer spectrometer TOSCA (Fig. 19.6) is by far the most refined and powerful instrument [44]. TOSCA is an upgraded version of an instrument called TFXA (to avoid confusion, no explicit distinction will be made between TFXA and TOSCA in the following). Time focusing is achieved by positioning the elements of two sets of analyzer crystals (one for backscattering, one for forward scattering) at slightly di erent Bragg angles in such a way that the di erences in reflected neutron energies are compensated for by small di erences in the total neutron flight paths. The e ective scattering angles are 135◦ (backscattering) and 45◦ (forward scattering) so that the conservation equations for momentum and energy yield Q2 = (2mn/ 2)Ef [2 + ω ±(1 + ω)1/2√2] where ω = ω/Ef and Ef = 3.95 meV (31.86 cm−1) is the fixed analyzer