

Intermediate Physics for Medicine and Biology - Russell K. Hobbie & Bradley J. Roth
.pdf380 14. Atoms and Light
caused by interaction of photons with substances placed on the skin, such as perfumes containing furocoumarins, lime peel, fungi, and fluorescein dye used in lipsticks.
Moseley (1994) reviews the safety issues involving ultraviolet light and lasers.
14.9.4 Ultraviolet Light Causes Skin Cancer
Chronic exposure to ultraviolet radiation causes premature aging of the skin. The skin becomes leathery and wrinkled and loses elasticity. The characteristics of photoaged skin are quite di erent from skin with normal aging [Kligman (1989)]. UVA radiation was once thought to be harmless. We now understand that UVA radiation contributes substantially to premature skin aging because it penetrates into the dermis. There has been at least one report of skin cancer associated with purely UVA radiation from a cosmetic tanning bed [Lever and Lawrence (1995)]. This can be understood in the context of studies showing that both UVA and UVB suppress the body’s immune system, and that this immunosuppression plays a major role in cancer caused by ultraviolet light [Kripke (2003); Moyal and Fourtanier (2002)].
There are three types of skin cancer. Basal-cell carcinoma (BCC) is most common, followed by squamouscell carcinoma (SCC). These are together called nonmelanoma or nonmelanocytic skin cancer (NMSC). Basal-cell carcinomas can be quite invasive (Fig. 16.44) but rarely metastasize or spread to distant organs. Squamous-cell carcinomas are more prone to metastasis. Melanomas are much more aggressive and frequently metastasize.
Armstrong and Kricker (1995) review the epidemiology of skin cancer. This summary is based on their paper. There are geographic di erences in incidence, the number of newly diagnosed cases per 100,000 population per year. Estimates of incidence for the three types of skin cancer for whites in the United States are given in Table 14.5. Melanoma incidence rates for whites in the United States are approximately 10 times higher than those for blacks living in the same geographic area, and 2–6 times higher than those for Hispanics living in the same area. An increase in melanoma incidence in professional or indoor occupations has been observed, probably related to an increase in recreational sun exposure. Also, the incidence is higher for people born in countries with lots of sunlight than for people who migrate to those countries, suggesting that the number of years of exposure or the age at exposure is important.
The incidence of melanoma increases with age until about age 50 and slows somewhat in older people. The incidence of NMSC increases steadily with age. The incidence of melanoma from the early 1960s to the late 1980s has increased at a rate of about 5% per year in populations of European origin, while increasing much less or not at all in other populations. Most of this increase has
been on the trunk, particularly in men. Similar increases in NMSC have been seen in the United States, primarily for BCC on the trunk. (It is much more di cult to obtain accurate figures for NMSC than for melanoma, because NMSC data are not typically kept since it has a much lower mortality.) The epidemiological data suggest an association between skin cancer and exposure to sunlight. There are also laboratory studies of the damage to cells caused by ultraviolet light. Armstrong and Kricker conclude that “the evidence leaves little room for doubt that sun exposure causes both melanoma and NMSC.” A pattern of infrequent, intense exposure to ultraviolet light is more likely to lead to melanoma than relatively continuous exposure; a plausible explanation has been proposed [Gilchrist et al. (1999)].
14.9.5Protection from Ultraviolet Light
Protection from the sun certainly reduces erythema and probably reduces skin cancer. Protection is most important in childhood years, both because children receive 3 times the annual sun exposure of adults and because the skin of children is more susceptible to cancer-causing changes The simple sun protection factor (SPF) alone is not an adequate measure of e ectiveness, because it is based on erythema, which is caused mainly by UVB. Some sunscreens do not adequately protect against UVA radiation. Buka (2004) reviews both sunscreens and insect repellents for children. He finds several products that adequately block both UVA and UVB. They are based on zinc oxide, titanium oxide, or avobenzone (Parsol 1789). An adequate amount must be used: for children he recommends 1 fluid ounce (30 ml) per application.
One study of the immunosuppressive protection factor (IPF) was done by exposing to UV light through various sunscreens the skin of volunteers who have a skin allergy to nickel. After exposure their skin is then coated with a nickel compound. If the irradiated skin showed less allergic response, the UV had caused immunosuppression [Poon et al. (2003)]. They showed that the IPF did not correlate strongly with the traditional SPF, but correlated strongly with the UVA protective factor. (The UVA-PF is determined by the degree of tanning.) While it is plausible that immunosuppression means that the body can less e ectively reject tumors that begin to grow, direct evidence must wait for additional experiments [Kripke (2003)].
Because of the high reflectivity of sand and snow, beach umbrellas provide at most a factor of 2 protection. Hats need to have a brim that is at least 7.5 cm wide [Di ey and Cheeseman (1992)].
Automobile window glass provides protection against UVB; however, untinted glass transmits enough UVA to present a significant exposure over several hours of driving [Kimlin and Parisi (1999)].

|
|
14.10 Heating Tissue with Light |
381 |
||
TABLE 14.5. Estimates of skin cancer incidence rates per 100,000.a |
|
|
|
||
Cancer type |
Population |
Males |
Females |
|
|
|
|
|
|
|
|
Melanoma |
White, New Orleans, 1983–87 |
6.9 |
5.3 |
|
|
|
White, Hawaii, 1983–1987 |
22.2 |
14.9 |
|
|
SCC |
White, U.S., 1994 (rough est.) |
100 |
45 |
|
|
BCC |
White, U.S., 1994 (rough est.) |
400 |
200 |
|
|
aSimplifications made by the authors from data in Armstrong and Kricker (1995).
14.9.6 Ultraviolet Light Damages the Eye
The e ect of ultraviolet light on the eye has been reviewed by Bergmanson and S¨oderberg (1995). Acute e ects include keratitis (inflammation of the cornea, the transparent portion of the eyeball) and conjunctivitis (inflammation of the conjunctiva, the mucous membrane covering the eye), also known as snow blindness or welder’s flash. Laboratory studies show that ultraviolet-light exposure causes thickening of the cornea and disrupts corneal metabolism. UVC radiation is absorbed by the cornea. The crystalline lens absorbs UVB and, in older persons, UVA and visible light. Only a little UVA light reaches the retina. The retina is also susceptible to trauma from blue light. Low doses cause photochemical changes in tissues, while high doses also cause thermal damage.
Chronic low exposure to ultraviolet light causes permanent damage to the cornea, known as droplet keratopathy or spheroid degeneration. UVA radiation is a significant factor in the development of a pterygium, a hyperplasia of the conjunctiva that may grow over the cornea and impair sight. Rarely, it causes blindness.
Properly designed spectacles and contact lenses can protect the eye against ultraviolet light [Giasson et al. (2005)]. However, both must be designed to absorb ultraviolet. Soft contacts are larger and provide more protection than rigid gas-permeable contacts. Protection from high ultraviolet light-intensity requires sunglasses or welding goggles. Wide-brimmed hats also help protect the eye from ultraviolet light.
14.9.7 Ultraviolet Light Synthesizes Vitamin D
Ultraviolet light has one beneficial e ect: it allows the body to synthesize vitamin D. Brief exposures are su - cient. Many foods are fortified with vitamin D, which has caused occasional overdoses [Haddad (1992)].
14.9.8 Ultraviolet Light Therapy
Ultraviolet light is used in therapy, primarily for the treatment of a skin disease called psoriasis. Psoriasis is an inflammatory disorder in which the basal cells move out to the stratum corneum in much less than the normal 28 days. The skin is red and has thick scaling. UVB radiation, often in conjunction with coal tar applied to
the skin, has been used as a treatment for psoriasis since the 1920s. In the 1960s a treatment was developed that uses UVA and a chemical either applied to the skin or administered systemically (photochemotherapy or PUVA— psoralen UVA). The chemical is a psoralen derivative. It a ects DNA, and when the a ected DNA is irradiated with ultraviolet light, cross-links form, preventing replication. There are well-defined guidelines for the use of PUVA [Studniberg and Weller (1993)]. Details of PUVA therapy are found in Grossweiner (1994, pp. 162–167). The treatment works, but it has also been found to increase the risk of NMSC [Nijsten and Stern (2003); Paul (2003)].
PUVA therapy is also useful in cutaneous T-cell lymphoma, a disease that first becomes apparent on the skin and then moves to internal organs. Another treatment, extracorporeal photopheresis, involves removing the patient’s blood, extracting the red blood cells, irradiating the plasma and white blood cells with UVA light outside the body, and returning the red blood cells and the irradiated white blood cells and plasma to the patient [Grossweiner (1994, pp. 167f); Knobler et al. (2002)].
Recently it has been shown that children who are rejecting a transplant in spite of conventional immunosuppressive therapy can benefit from extracorporeal phototherapy [Messina et al. (2003)].
14.10 Heating Tissue with Light
Sometimes tissue is irradiated in order to heat it; in other cases tissue heating is an undesired side e ect of irradiation. In either case, we need to understand how the temperature changes result from the irradiation. Examples of intentional heating are hyperthermia (heating of tissue as part of cancer therapy) or laser surgery (tissue ablation15). Tissue is ablated when su cient energy is deposited to vaporize the tissue. Heating may be a side e ect of phototherapy.
The temperature changes are often modeled by a heatflow equation containing a source term for the deposition of photon energy and a term representing flow of energy away from the site in warmed blood. This is one form of
15In surgery, ablation means the excision or amputation of tissue.

382 14. Atoms and Light
the bioheat equation, which can include additional terms in more complicated models.
The linear equation for heat conduction was mentioned as one form of the transport equation in Table 4.3:
dT jH = −K dx ,
with the units of the thermal conductivity K being J K−1 m−1 s−1. When extended to three dimensions and combined with the equation of continuity (conservation of energy), this gives a heat-conduction equation with the same form as Fick’s second law for di usion:
∂T |
= K 2T. |
(14.42) |
ρtCt ∂t |
Here ρt is the density of the tissue (kg m−3) and Ct the tissue specific heat capacity (J K−1 kg−1). The left-hand side of the equation is the rate of energy increase in the tissue per unit volume, and the right-hand side is the net rate of heat flow into that volume by conduction—energy flowing because warmer molecules with more kinetic energy transfer energy to cooler neighbors in a collision process analogous to a random walk. This model is for solids; in liquid one must also consider convection.
We now add a term for energy carried away by flowing blood. In the linear approximation it is proportional to the temperature di erence between the tissue and the blood supply and also to the rate of blood flow. Units for this term can be quite confusing and need to be examined in detail. Blood flow is usually defined by physiologists as the perfusion P , which is the volume flow of blood per unit mass of tissue. The SI units for P are
P [kg (tissue)] s .
Its product with the tissue density is the volume flow of blood per unit volume of tissue:
[kg (tissue)] m3 (blood)
ρtP = [m3 (tissue)] [kg (tissue)] s = m3(tissue) s = s-1.
The quantity is analogous to clearance (Chapter 2). Its inverse is the time it takes for a volume of blood equal to the tissue volume to flow through the tissue. Each term of our heat-flow equation has units of energy per unit volume of tissue per second. If we assume that the blood enters the tissue at temperature T0 and leaves at temperature T , the energy lost by the volume is the heat capacity of blood, Cb, times its mass per unit volume times the temperature rise. The new term in the heatflow equation is
Cb |
J |
× ρb |
kg (blood) |
× ρtP |
m3 (blood) |
K kg (blood) |
m3 (blood) |
m3 (tissue) s |
× [(T − T0) K]
or
J
CbρbρtP (T − T0) m3 (tissue) s ,
so the heat-flow equation with blood flow added is
ρtCt ∂T∂t = K 2T − CbρbρtP (T − T0).
The last term we consider is the energy deposited by the photon beam. In Sec. 14.5 we defined the particle fluence and particle fluence rate for photons. The definition can be used for both collimated beams and di use radiation. In a similar way we define the energy fluence Ψ as the ratio of the expectation value of the amount of photon energy traversing a small sphere of radius a divided by the area of a great circle of the sphere, πa2. The energy fluence rate is
ψ = |
dΨ |
. |
(14.43) |
|
|||
|
dt |
|
|
The energy per unit volume lost by a beam with energy fluence rate ψ can be determined by the following argument. Consider only the fluence rate due to photons traveling in a certain direction. Orient the z axis in that direction and consider a small volume dSdz. The rate at which energy flows into the volume is ψdS, and the rate at which it is absorbed is ψdSµadz. Therefore, the rate of absorption per unit volume is µaψ, independent of the direction the photons travel. The final heat-flow equation is
ρtCt ∂T∂t = K 2T − CbρbρtP (T − T0) + µaψ. (14.44)
For monoenergetic photons the photon energy fluence rate is related to the photon fluence rate by
ψ = hνϕ. |
(14.45) |
In general, one must first solve Eq. 14.26 to determine ψ and then solve Eq. 14.44. We could add other terms, such as one for the thermal energy produced by metabolism within the tissue.
Sometimes Eq. 14.44 is written with all terms divided by ρtCt, and sometimes with all terms divided by K. If we divide by ρtCt the equation is similar in form to the
di usion equation in Chapter 4: |
|
|
||||||
∂T |
Cb |
|
|
|
µa |
|
||
|
|
= D 2T − |
|
ρbP (T − T0) + |
|
ψ, (14.46) |
||
|
∂t |
Ct |
ρtCt |
|||||
where |
|
|
|
|
|
|
|
|
|
|
|
|
D = |
K |
. |
|
(14.47) |
|
|
|
|
|
|
|||
|
|
|
|
|
ρtCt |
|
|
|
Values of D are in the range (0.5–2.5) × 10−7 m2 s−1 depending on the tissue type [Grossweiner (1994), pp. 127–129]. We saw in Chapter 4 that for a spreading Gaussian solution to the di usion equation the variance is σx2 = σy2 = σz2 = 2Dt. The thermal relaxation time, that is, the average time for the temperature rise to spread a

distance x, is therefore x2/2D in one dimension, x2/4D in two dimensions, and x2/6D in three dimensions.
There is an interplay between the thermal conductivity term and the blood-flow term. The thermal penetration depth δth is the distance at which the two terms are comparable. For larger distances blood flow is more important. To estimate the penetration depth, assume that T − T0 changes over this distance. Then the Laplacian is approximated by 2T ≈ (T − T0)/δth2 . Equating the di usive and blood flow terms gives
D |
T − T0 |
= |
|
Cb |
ρ |
P (T |
− |
T |
) |
|
|||||
|
|
|
|
||||||||||||
|
|
δth2 |
|
Ct |
b |
|
|
0 |
|
|
|||||
so |
|
Ct |
|
|
1 |
|
|
|
K |
|
|
|
|||
δ2 |
= D |
|
|
= |
|
|
. |
(14.48) |
|||||||
|
|
|
|
|
|
|
|||||||||
th |
Cb ρbP ρtCbρbP |
|
|
||||||||||||
|
|
|
|
||||||||||||
Grossweiner (1994) discusses values for the various tissue parameters, their temperature dependence, and simple models for tissue heating and ablation.
14.11 Radiometry and Photometry |
383 |
14.11.1Radiometric Definitions
Radiant Energy and Power
The total amount of energy being considered is the radiant energy R, measured in joules. It can be the energy emitted by a source, transferred from one region to another, or received by a detector. We use subscripts s and d to refer to the source and detector. In optics the radiant energy is electromagnetic radiation. In radiological physics we will also consider energy transported by charged particles such as electrons, and protons, and by neutral particles such as photons and neutrons.
The rate at which the energy is radiated, transferred, or received is the radiant power P (watts).
Point Source: Radiant Intensity
The simplest source is a point that radiates uniformly in all directions. The radiant intensity or radiant power per unit solid angle (Appendix A) leaving a point source radiating uniformly in all directions is
14.11 Radiometry and Photometry
This section develops some of the concepts and vocabulary of radiometry, the measurement of radiant energy. We will be considering five types of radiant energy in the remaining chapters: infrared radiation, visible light, ultraviolet radiation, x rays, and charged particles. Concepts for the measurement of radiant energy were developed simultaneously in di erent disciplines and even in di erent wavelength regions, depending on the purpose and the measurement techniques that were originally available.
It is recommended that the term photometry be reserved for measurement of the ability of electromagnetic radiation to produce a human visual sensation, that radiometry be used to describe the measurement of radiant energy independent of its e ect on a particular detector, and that actinometry be used to denote the measurement of photon flux or photon dose (total number of photons) independent of any subsequent photoactivated process [Zalewski (1995), p. 24.7].
This section reviews radiometric units and introduces a few of the related units from photometry and actinometry. Nomenclature is slightly di erent for x rays and charged particles.
Section 14.5 described two quantities, the photon fluence and the photon fluence rate. The energy fluence and energy fluence rate were introduced in Sec. 14.10. These are reviewed and compared here so that all the definitions are in one place. The definitions are summarized in Table 14.6. Symbols are shown for quantities used in this text. The third column shows symbols that have been recommended by the American Association of Physicists in Medicine [AAPM 57 (1996)]. They often di er from the usage in this book.
dP |
= |
P |
(W sr-1). |
(14.49) |
|
dΩ |
4π |
||||
|
|
|
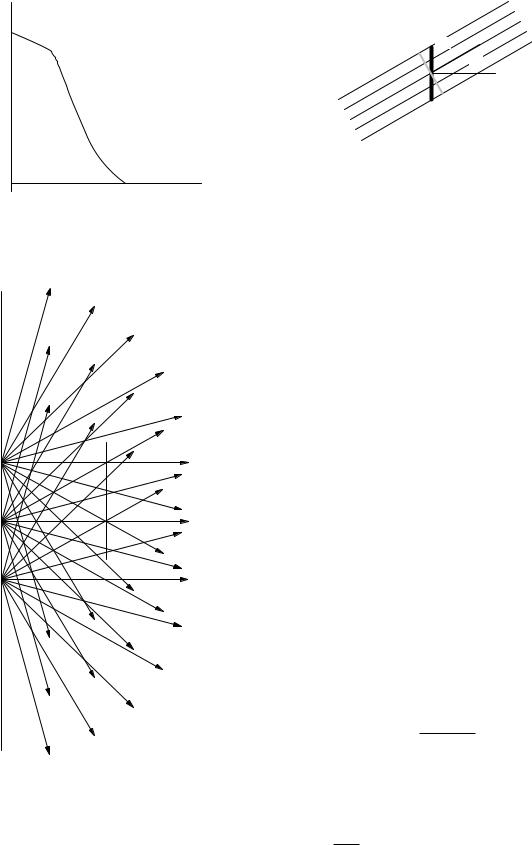
The power per unit area falls as 1/r2, while the power per unit solid angle is independent of r.16 A point source need not radiate uniformly in all directions. For example, a searchlight 1 m in diameter viewed from a point several kilometers away appears to be a point. The light might be confined to a cone with a half-angle of 1◦. Then a plot of dP/dΩ might look like Fig. 14.31. The total power radiated by the point source is
P = |
|
dP |
dΩ. |
(14.50) |
|
dΩ |
|||||
|
|
|
|
If the power per unit solid angle is symmetric about the axis of the beam and θ is the angle with respect to the beam axis, then (see Appendix L)
P = π dP 2π sin θ dθ.
0 dΩ
Extended Source: Radiance
The radiant energy leaving a source can travel in many di erent directions. The radiation striking a surface can come from many di erent directions. If we consider any small area in space there will generally be radiation passing through that area traveling in many di erent directions. In each case the radiant energy or the radiant power is proportional to the magnitude of the small area projected perpendicular to the direction the energy is traveling, and to the size of the solid angle—the range of directions—being considered.
16The lighting industry calls dP/dΩ the intensity, while in physical optics intensity is used for power per unit area. We will try to avoid using the word intensity alone.

384 14. Atoms and Light
TABLE 14.6. A comparison of radiometric, photometric, and actinometric quantities. Symbols are given for those quantities used in this text. The column “Symbol sometimes used” gives an alternate symbol that is often found. See, for example, AAPM57 (1996).
Radiometric |
Symbol |
Symbol Units |
Photometric |
Symbol Units |
Actinometric |
Symbol Units |
quantity |
used |
some- |
quantity |
|
quantity |
|
|
here |
times |
|
|
|
|
|
|
used |
|
|
|
|
|
General quantities |
|
|
|
|
|
Radiant energy |
R |
Q |
J |
|||
emitted, transferred, |
|
|
|
|
||
or received. |
|
|
|
|
||
Radiant flux or |
P |
P or Φ |
W |
|||
radiant power |
|
|
˙ |
|
||
|
or R |
|
||||
emitted, transferred, |
|
|
|
|
||
or received. |
|
|
|
|
||
Radiance: the |
L |
r |
W m−2 |
|||
radiant power per |
|
|
|
sr−1 |
||
unit solid angle per |
|
|
|
|
||
unit area of surface |
|
|
|
|
||
projected |
|
|
|
|
||
perpendicular to the |
|
|
|
|
||
radiant energy. It |
|
|
|
|
||
can be defined on |
|
|
|
|
||
the surface of a |
|
|
|
|
||
source or detector or |
|
|
|
|
||
at any point on the |
|
|
|
|
||
path of a ray of |
|
|
|
|
||
radiation. |
|
|
|
|
||
Energy fluence: the |
Ψ |
H0 |
J m−2 |
|||
ratio of the |
|
|
|
|
||
expectation value of |
|
|
|
|
||
the radiant energy |
|
|
|
|
||
striking a small |
|
|
|
|
||
sphere to the area of |
|
|
|
|
||
a great circle of the |
|
|
|
|
||
sphere. |
|
|
|
|
||
Energy fluence rate: |
ψ |
E0 |
W m−2 |
|||
the energy fluence |
|
|
|
|
||
per unit time. |
|
|
|
|
||
|
Quantities emitted from a surface |
|
|
|||
Radiant intensity: |
|
I |
W sr−1 |
|||
radiant power or |
|
|
|
|
||
flux emitted by a |
|
|
|
|
||
point source in a |
|
|
|
|
||
given direction per |
|
|
|
|
||
unit solid angle. |
|
|
|
|
||
Exitance: radiant |
|
Wr |
W m−2 |
|||
power or flux |
|
|
|
|
||
emitted or reflected |
|
|
|
|
||
per unit area. |
|
|
|
|
||
|
Quantities incident on a surface |
|
|
|
||
Irradiance: the |
E |
E |
W m−2 |
|||
power per unit area |
|
|
|
|
||
incident on a |
|
|
|
|
||
surface. |
|
|
|
|
||
Radiant exposure: |
|
H |
J m−2 |
|||
radiant energy |
|
|
|
|
||
arriving per unit |
|
|
|
|
||
area |
|
|
|
|
||
Luminous energy. |
Rv |
lm s |
Number of photons N |
|
|
|
emitted, transferred, |
|
|
|
or received. |
Luminous flux |
Pv |
lm |
Photon flux |
Luminance |
Lv |
candela |
Photon flux |
|
|
m−2 (cd |
radiance |
|
|
m−2) |
|
|
|
Photon (or particle) |
Φ |
|
|
fluence: the ratio of |
|
|
|
the expectation |
|
|
|
value of the number |
|
|
|
of photons striking a |
|
|
|
small sphere to the |
|
|
|
area of a great circle |
|
|
|
of the sphere. |
|
|
|
Photon fluence |
φ |
|
|
rate: the photon |
|
|
|
fluence per unit time |
|
Luminous intensity |
lm sr−1 |
Photon flux |
|
|
or candela |
intensity. |
|
|
(cd) |
|
|
Luminous exitance |
lm m−2 |
Photon exitance |
|
Illuminance |
lm m−2 or |
Photon flux |
|
|
lux |
irradiance |
|
Luminous exposure |
lm s m−2 |
Photon flux |
|
|
|
exposure |
|
s−1
m−2 sr−1
m−2
m−2 s−1
sr−1
m−2
m−2 s−1
m−2
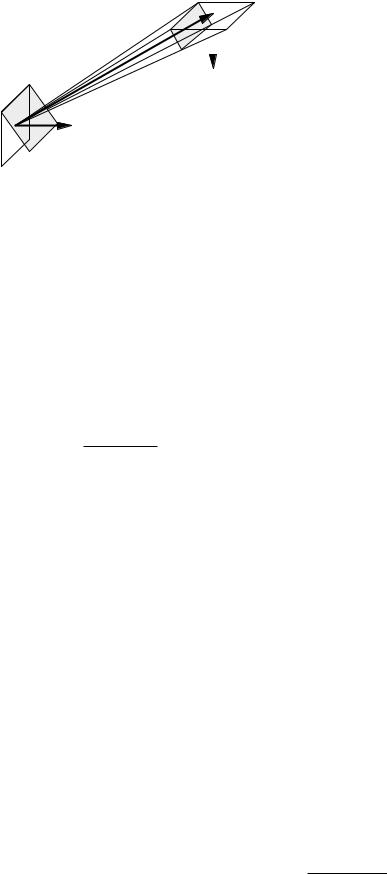
The radiance L is the amount of radiant power per unit solid angle per unit surface area projected perpendicular to the direction of the radiant energy. The radiance of radiation traveling through a small area in space is sometimes di cult to visualize. Figures 14.32 and 14.33 may help. Figure 14.32 shows radiation leaving three points on a surface at the left. Some of it passes through the surface
represented by the vertical line on the right. The energy passing through that surface has components from each point on the radiating surface. Figure 14.33 shows radiation in a very narrow cone of solid angles passing through surface dS whose normal is at an angle θ with the beam direction. The radiance is the power per unit solid angle divided by dS cos θ.
14.11 Radiometry and Photometry |
385 |
d P d Ω
dS cos θ |
dS |
|
θ |
||
|
FIGURE 14.33. Surface area dS, projected perpendicular to the direction of the radiation, has projected area dS cos θ.
θ
FIGURE 14.31. A plot of power per unit solid angle as a function of angle from the axis of a hypothetical searchlight.
FIGURE 14.32. Radiation emitted from di erent points of the surface on the left strikes the surface on the right.
We have already seen the energy fluence Ψ, which is a measure of the total radiation entering or leaving a small volume of space. It is the total amount of energy striking a small sphere of radius a divided by the area of
a great circle πa2 in the limit as the radius approaches zero. Strictly speaking, if we repeat the experiment many times, the amount of energy striking the sphere fluctuates. The energy fluence is defined in terms of the expectation value of this fluctuating quantity. Figure 14.12 shows two examples. In Fig. 14.12(a), a parallel beam with energy R passes through a circular area πa2 for a time ∆t. In Fig. 14.12(b), a total amount of energy R strikes a sphere of radius a from many di erent directions. In both cases Ψ = R/πa2. Notice that some of the energy passing through the sphere passes outside a great circle that is not perpendicular to the direction in which the radiation is traveling, but it does pass through a great circle constructed perpendicular to its direction of travel.
The energy fluence rate is the amount of energy fluence per unit time (which for the small sphere is P/πa2):
ψ = |
dΨ |
. |
(14.51) |
|
|||
|
dt |
|
|
The exitance Wr is the radiant power or flux emitted per unit area of a surface.
Energy Striking a Surface: Irradiance
Now consider the energy striking a surface. The irradiance E is the power per unit area incident on a surface. The strict definition is the ratio of the power incident on an infinitesimal element of detector surface dSd to the area projected perpendicular to the direction the radiant energy is traveling. If θd is the angle between a normal to the surface and the direction of propagation, the irradiance is
dP |
|
E = cos θd dSd . |
(14.52) |
For a point source radiating uniformly in all directions, the power at distance r is spread uniformly over a sphere of area 4πr2, so the irradiance on a detecting surface perpendicular to a line back to the source is
E = |
P |
(isotropic point source). |
(14.53) |
4πr2 |
For an extended source the power emitted by the surface is proportional to both the size of the emitting area
386 14. Atoms and Light
dSd cos θd |
|
|
This is also the power per unit area incident on a circle of |
|||
|
dSd |
radius a oriented perpendicular to the beam. Therefore, |
||||
|
|
|
|
|
for a collimated beam, |
|
|
r |
|
θd |
|
|
|
|
|
dΩ |
|
|
ψ = E (collimated beam). |
(14.57) |
|
|
|
|
|
|
|
θs
dSs cos θ s
dSs
FIGURE 14.34. Radiant energy is emitted from a source of surface area dSs into a cone of solid angle dΩ. The direction of emission is at an angle θs with the normal to the surface. A detecting surface has an element of area dSd oriented at a direction θd to the direction of travel of the radiation from source to detector. The shaded rectangles show the projections of dSs and dSd perpendicular to the line of length r from source to detector.
dSs and the solid angle of the cone dΩ into which the energy is radiated, as shown in Fig. 14.34. The solid angle subtended by a small element of area on the detector is dΩ, as shown by the dashed lines. The amount of power radiated into dΩ from dSs is
LdSsdΩ = |
d2P |
|
cos θs dSs dΩ dSs dΩ, |
(14.54) |
where the radiance L depends on the direction of emission as well as the location on the surface. This equation is valid whether the energy is emitted directly from the source (as in a glowing object) or is scattered by the surface (as from this page). The total power emitted is
|
|
|
P = |
L dSs dΩ. |
(14.55) |
The distinction between angles and areas for the source and the detector is shown in Fig. 14.34. Note that the solid angle subtended at the source by dSd is dΩ = dSd cos θd/r2. The power into an area dSd of the detector from area dSs of the source is therefore
d2P = |
L cos θs cos θd dSs dSd |
. |
(14.56) |
|
|||
|
r2 |
|
|
Plane-wave Relationships
We can derive some useful relationships for a beam of collimated radiation all traveling in one direction (a plane wave). Imagine that the collimated beam comes from a distant point source radiating power P . The energy fluence rate at distance r from the source is the power through a sphere of radius a divided by πa2:
πa2P |
1 |
|
|
P |
|
|||
ψ = |
|
|
|
= |
|
|
. |
|
4πr2 πa2 |
4πr2 |
|||||||
|
|
|
||||||
Isotropic Radiation: Lambert’s Law
In general, L may depend on the angle of emission. In some cases, such as reflection from a “perfectly di use” surface, the radiation is isotropic : L = L0. This is called
Lambert’s law of illumination or Lambert’s cosine law.17
A surface described by Lambert’s law will have equal power per unit area in the image regardless of the viewing angle. Look at surfaces around you. Do similar surfaces illuminated the same way appear to have the same brightness when they are oblique to your line of vision?
The power incident on a small element of surface area dSd from angle dΩ is L0dSd cos θd dΩ, where θd is the angle that the incident radiation makes with the normal to the surface. The solid angle is 2π sin θd dθd [see Fig. 14.11(b)]. The irradiance is
dSd2πL0 |
π/2 cos θd sin θddθd |
= πL0 |
. (14.58) |
|
E = |
|
0 |
||
|
dSd |
|||
|
|
|
|
|
The same geometry is used with dSs to show that for isotropic radiation the exitance is
Wr = πL0. |
(14.59) |
To determine the energy fluence rate for isotropic radiation consider a small sphere of radius a and the radiation arriving in a small solid angle dΩ about a line perpendicular to a great circle of the sphere. The power is L0πa2dΩ. This argument applies for any direction of the radiation. Integrating over all directions gives the total power L0πa24π. Therefore, for isotropic (Lambertian) radiation,
ψ = 4πL0 = 4E (isotropic radiation). |
(14.60) |
The Spectrum
When the energy is not monochromatic, we define the amount of energy per unit wavelength interval as Rλ, with units J m−1 or J nm−1. The total energy between wavelengths λ1 and λ2 is
λ2 |
|
Rλ(λ) dλ |
(14.61a) |
λ1 |
|
and between frequencies ν1 and ν2 it is |
|
ν2 |
|
Rν (ν)dν. |
(14.61b) |
ν1 |
|
The relationship between Rλ and Rν is the same as in Eqs. 14.35 and 14.36.
17Sometimes Eq. 14.56 is defined without the factor cos θs, in which case Lambert’s law has the form L(θs) = L0 cos θs.
|
1.0 |
|
|
|
|
|
|
V |
Scotopic, V′ |
|
|
Photopic, V |
|
||
function |
0.8 |
|
|
|
|
|
|
0.6 |
|
|
|
|
|
|
|
efficiency |
|
|
|
|
|
|
|
0.4 |
|
|
|
|
|
|
|
|
|
|
|
|
|
|
|
Spectral |
0.2 |
|
|
|
|
|
|
|
|
|
|
|
|
|
|
|
0.0 |
450 |
500 |
550 |
600 |
650 |
700 |
|
400 |
||||||
Wavelength, nm
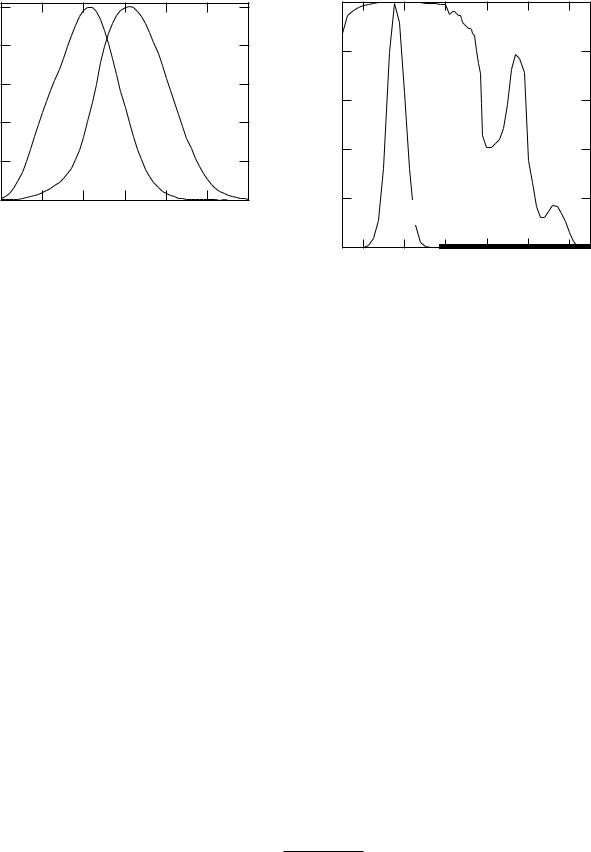
FIGURE 14.35. The spectral e ciency functions for the CIE standard eye. Plotted from data in Table 2 of Zalewski (1995).
14.11 Radiometry and Photometry |
387 |
Sensitivity |
1.0 |
|
|
|
|
|
|
|
|
Transmision of |
|||
0.8 |
|
|
2 cm of water |
|
||
|
|
|
|
|
||
|
|
|
|
|
|
|
or Relative |
0.6 |
|
|
|
|
|
|
|
|
|
|
|
|
Transmitted |
0.4 |
|
|
|
|
|
0.2 |
|
|
|
|
|
|
Fraction |
Photopic sensitivity |
|
|
|||
|
|
|
||||
|
of the eye |
NIR = 750-3000 nm |
||||
|
|
|
||||
|
0.0 |
600 |
800 |
1000 |
1200 |
1400 |
|
400 |
|||||
Wavelength (nm)
14.11.2 Photometric Definitions
For the photometric units we also need to know the sensitivity of the eye. The eye contains two types of light receptors: rods, which have no color discrimination but are most sensitive, and cones, which are less sensitive and can discriminate color. Photopic vision is normal vision at high levels of illumination in which the eye can distinguish colors. Scotopic vision occurs at low light levels with a dark-adapted eye. The CIE has established the spectral e ciency function V for the eye of a standard observer for both photopic vision [V (λ)] and scotopic vision [V (λ)]. Both are normalized to unity at their peak (Fig. 14.35).
The luminous flux Pv in lumens (lm) is the analog of the energy flux P . The peak sensitivity for photopic vision is for green light, λ = 555 nm. At that wavelength the relationship between P and Pv is
P = 1 W Pv = 683 lm, |
W. |
(14.62a) |
Pv = 1 lm P = 1.464 × 10⁻³ |
|
The ratio Pv /P at 555 nm is the luminous e cacy for photopic vision, Km = 683 lm W−1. For a distribution of wavelengths,
|
700 nm |
|
Pv = Km |
V (λ)Pλ(λ) dλ. |
(14.62b) |
|
400 nm |
|
An analogous relationship holds for scotopic vision, with Km ≈ 1, 700 lm W−1:
|
700 nm |
Pv (scotopic) = Km |
V (λ)Pλ(λ) dλ. (14.62c) |
|
400 nm |
If P were spread uniformly over the visible spectrum, the overall conversion e ciency would be about 200 lm W−1. A typical incandescent lamp has an e ciency of
FIGURE 14.36. Transmission of light through 2 cm of water, compared to the spectral e ciency of the eye.
10–20 lm W−1, while a fluorescent lamp has an e ciency of 60–80 lm W−1. The number of lumens per steradian is the luminous intensity, in lm sr−1. The lumen per steradian is also called the candle. Other units are shown in Table 14.6.
The peak of the eye’s spectral e ciency function is at about the peak of the sun’s blackbody spectrum when plotted as a function of wavelength (Eq. 14.32). Some authors have speculated that this is because we evolved in sunlight. There is a severe problem with this argument. The spectral e ciency function has the same value whether we consider a particular wavelength or its corresponding frequency. The blackbody spectrum is a distribution function—per wavelength interval (Eq. 14.32) or per frequency interval (Eq. 14.37).18 The sun’s blackbody spectrum plotted vs. frequency peaks at a frequency corresponding to a wavelength of 880 nm, far from the peak of the spectral e ciency function (See Fig. 14.24).
So er and Lynch (1999) have discussed this at length and describe several of the errors in the literature. The structures in the human eye, as in all vertebrate eyes, are mostly water. All vertebrate eyes are sensitive between 390 and 760 µm, with a peak at 500–550 µm. It is interesting to compare the spectral e ciency function with the transmission of light through 2 cm of water (Fig. 14.36). The eye’s response is pretty well centered in this absorption window. Many insects, crustaceans, fish, birds and reptiles have ultraviolet-sensitive receptors [Kevan et al. (2001)]; their eyes do not contain water.
18Other distribution functions are also useful, for example, per logarithmic frequency or wavelength interval. See So er and Lynch (1999) or Heald (2003).
388 |
14. |
Atoms and Light |
|
|
|
|
|
|
Cornea |
|
|
|
|
|
|
|
|
|
|
Aqueous |
h' |
α |
|
|
|
|
Pupil |
|
Iris |
|
|
|
|
α |
h |
Lens |
|
|
|
u |
|
|
v |
|
|
|
|
|
|
|
|
||
|
|
Vitreous |
|
|
|
|
|
|
|
|
|
|
Ω = |
πa |
2 |
πa2 |
|
|
|
|
dS' |
u2 |
dS |
|||
|
|
|
|
|
||||
|
|
|
|
|
|
|
||
|
|
|
|
u |
|
|
v |
|
Retina
Optic nerve connects to visual cortex in the brain
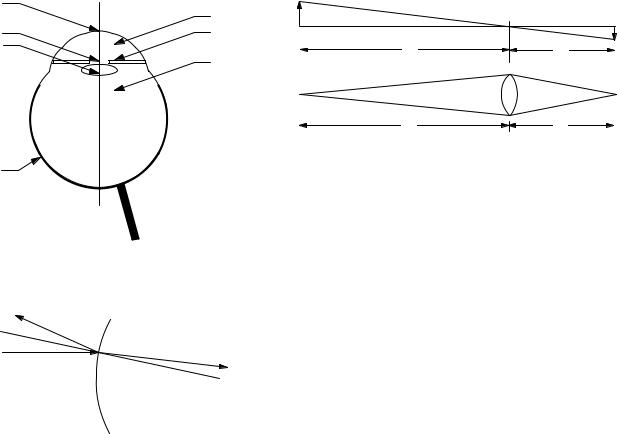
FIGURE 14.39. A source of height h emits light in all directions. Some of this light is intercepted by a lens and focused in an image. (a) Relation between object and image distances and sizes. (b) Collection of light by the lens.
FIGURE 14.37. A simplified cross viewed from above.
Reflected
θr
θ1
Incident
n1 n2
n1sinθ1 = n2 sinθ
θ1 = θr
section of the left eye,
Transmitted
Normal to |
θ |
2 |
|
|
|
surface |
|
|
2 |
|
|
FIGURE 14.38. When light passes from one medium to another with a di erent index of refraction. All angles are measured with respect to the normal to the surface
14.11.3 Actinometric Definitions
The actinometric quantities count the number of photons. For monochromatic photons the energy is the number of photons times hν. Therefore, an actinometric quantity is easily obtained when the radiometric quantity is known. The units are shown in Table 14.6.
14.12 The Eye
This section presents a simple model for the eye, su cient for us to understand how refractive errors are corrected and to see how photons strike the retina, so that the sensitivity of the eye can be determined in the next section.
A simplified cross section of the eye is shown in Fig. 14.37. The principal components through which the light passes are the curved, thin, transparent cornea, the aqueous, the lens, the vitreous, and the retina. The iris defines the area of the pupil, the opening in front of the lens through which light passes.
When light passes through a surface from one medium into another, part is reflected and part is transmitted. The transmitted light usually changes direction, a process called refraction. Figure 14.38 shows the angles involved, all measured with respect to the dashed line, which is normal to the surface at the point where the light ray strikes. The angle the reflected light makes with the normal is the same as the angle of incidence, θr = θ1. The direction the refracted light travels is described by Snell’s law, n1 sin θ1 = n2 sin θ2.
When light from an object strikes the eye, it must be refracted to form an image on the retina. Most of the refraction takes place at the surface between the air and the cornea. The cornea is very thin, and a light ray is deflected only a very small distance before it strikes the aqueous. Thus, most of the refraction occurs because of the di erence between the index of refraction of the air (n = 1.00) and the aqueous (n = 1.33). The light then passes through the crystalline lens (n = 1.42) and the vitreous (n = 1.33). The lens changes shape to provide the adjustable part of the overall refraction.
A number of models at varying levels of sophistication are used to describe the formation of the image on the retina. The most detailed take into account the refraction at each surface where the index of refraction changes, including variations in di erent layers of the lens itself. Others treat only the refraction at the air–cornea, aqueous– lens, and lens–vitreous interfaces. The simplest model, and the one we will use, treats the eye as a thin lens of adjustable focal length f , with object distance u and fixed image distance v, as shown in Fig. 14.39. The object and image distances and focal length are related by the thin-lens equation found in any general physics book:
1 |
|
+ |
1 |
= |
1 |
. |
(14.63) |
u |
|
v |
|
f |
|
||
When the object is infinitely far away the image distance is equal to the focal length of the lens, v = f . A typical value for v is 1.7 cm. As the object is brought closer to the eye v cannot change, but the lens changes to decrease the focal length.
14.12 The Eye |
389 |
TABLE 14.7. Convergence power of the eye in diopters.
Refracting |
Relaxed |
Most converging |
structure |
normal eye |
eye (age 25) |
|
|
|
Air-cornea surface |
45 |
45 |
Lens |
14 |
24 |
Entire eye |
59 |
69 |
|
|
|
In ophthalmology and optometry it is customary to describe the refraction of the eye in terms of the vergence. When light rays are emanating from a point they are diverging, and the vergence is negative. When they are coming toward a point the vergence is positive and they are converging. When they are parallel, the vergence is zero. Quantitatively, the vergences for the geometry shown in Fig. 14.39 are
1 |
|
(diverging from the object), |
|
||||
U = − |
|
|
|
|
|||
u |
|
||||||
V = |
1 |
|
(converging to the image), |
(14.64) |
|||
|
|||||||
v |
|
|
|
||||
F = |
1 |
(a converging lens). |
|
||||
f |
|
||||||
|
|
|
|
|
|
|
|
The relationship between the vergences is
V = F + U. |
(14.65) |
When the distances are in meters, the vergences are in diopters.
A given eye requires a particular value of V to form the image. The converging power of all the refracting surfaces in the eye must be F = V in order to focus on an object infinitely far away. Closer objects require more convergence from the eye, which is provided by the lens. Table 14.7 shows typical values for the converging power of the eye. Most of the convergence is provided by the front surface. When the eye is relaxed, F = V = 59 diopters, U = 0, and the eye is focused on an object infinitely far away. With F = 69 diopters, U = 10, and the eye is focused on an object 0.1 m away. This ability of the lens to change shape and provide additional converging power is called accommodation.
In the normal or emmetropic eye, the length of the eye is such that when the lens is relaxed, rays with no vergence (parallel rays from a source infinitely far away) are focused on the retina (V = F ).
In nearsightedness or myopia, parallel rays come to a focus in front of the retina. The eye is slightly too long for the shape of the cornea (F > V ). The total converging power of the eye is too great, and the relaxed eye focuses at some closer distance, from which the rays are diverging. Accommodation can only increase the converging power of the eye, not decrease it, so the unassisted myopic eye cannot focus on distant objects. Myopia can be corrected by placing a diverging spectacle or contact
|
16 |
|
|
|
|
|
|
|
diopters |
14 |
|
|
|
|
|
|
|
12 |
|
|
|
|
|
|
|
|
10 |
|
|
|
|
|
|
|
|
Accommodation, |
|
|
|
|
|
|
|
|
8 |
|
|
|
|
|
|
|
|
6 |
|
|
|
|
|
|
|
|
4 |
|
|
|
|
|
|
|
|
2 |
|
|
|
|
|
|
|
|
|
|
|
|
|
|
|
|
|
|
0 |
10 |
20 |
30 |
40 |
50 |
60 |
70 |
|
0 |
Age, years
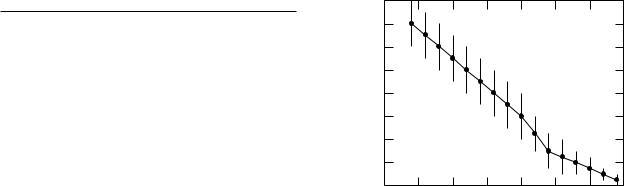
FIGURE 14.40. Accommodation vs age. There is considerable variation between individuals, shown by the error bars.
lens in front of the eye, so that incoming parallel rays are diverging when they strike the cornea.
The farsighted or hypermetropic eye does not have enough converging power (F < V ). The subject can focus on distant objects by providing some additional converging power from the lens, but then the lens cannot provide enough converging power to focus on nearby objects. The corrective lens provides additional convergence.
When the eye is not symmetric about an axis through the center of the lens, the images from objects oriented at di erent angles in the plane perpendicular to the axis form at di erent distances from the lens. This is called astigmatism, and it can be corrected with a spectacle lens that is not symmetric about the axis. The lack of symmetry usually occurs at the surface of the cornea, so a contact lens can restore the symmetry.
Surgery to change the radius of curvature of the cornea can also be used to correct errors of refraction.
As we age the accommodation of the eye decreases, as shown in Fig. 14.40. A normal viewing distance of 25 cm or less requires 4 diopters or more of accommodation. The graph shows that this limit is usually reached in the early 40s. Bifocals provide a portion of the spectacle lens that has increased converging power, usually in the bottom part of the lens. This can be done either by grinding the lower portion of the lens with a di erent radius of curvature or by fusing glass with a di erent index of refraction into the lens.
The sharpness of the image is reduced by two other e ects: chromatic aberration and spherical aberration. Chromatic aberration occurs because the index of refraction varies with wavelength. There is nearly a 2-diopter change in overall refractive power from the red to the blue. Spherical aberration occurs because the refractive power changes with distance from the axis of the eye. This is di erent from astigmatism, which is a departure from symmetry at di erent angles about the axis.