

Intermediate Physics for Medicine and Biology - Russell K. Hobbie & Bradley J. Roth
.pdf502 17. Nuclear Physics and Nuclear Medicine
|
1.0 |
|
|
|
|
1 |
|
|
|
|
|
|
|
|
|
|
|
|
|
|
|
|
|
|
7 |
|
|
|
|
|
|
|
|
|
|
|
|
|
|
|
|
|
6 |
|
|
|
|
|
|
|
|
|
|
|
|
|
|
|
|
|
5 |
|
|
|
|
|
|
|
|
|
|
Function |
0.8 |
|
|
|
Function |
|
4 |
|
|
|
|
|
|
|
|
|
|
|
|
|
|
|
3 |
|
|
|
|
|
|
|
|
|
|
||
|
|
|
|
|
2 |
|
|
|
|
|
|
|
|
|
|
||
0.6 |
|
|
|
|
|
|
|
|
|
|
|
|
|
|
|
||
Transfer |
|
|
|
Transfer |
|
|
|
|
|
|
|
|
|
|
|
|
|
|
2.5 cm |
|
|
0.1 |
|
|
|
|
|
|
|
|
|
2.5 cm |
|
||
|
|
|
|
|
|
|
|
|
|
|
|
|
|
|
|||
|
7.5 cm |
|
|
|
7 |
|
|
|
|
|
|
|
|
7.5 cm |
|
||
Modulation |
0.4 |
|
|
Modulation |
|
|
|
|
|
|
|
|
|
|
|||
|
|
|
|
6 |
|
|
|
|
|
|
|
|
|
|
|||
|
|
|
|
|
5 |
|
|
|
|
|
|
|
|
|
|
||
|
15 cm |
|
|
|
4 |
|
|
|
|
|
|
|
15 cm |
|
|||
|
|
|
|
|
|
|
|
|
|
|
|
|
|||||
0.2 |
|
|
|
|
3 |
|
|
|
|
|
|
|
|
|
|
||
|
|
|
|
2 |
|
|
|
|
|
|
|
|
|
|
|||
|
|
|
|
|
|
|
|
|
|
|
|
|
|
|
|
|
|
|
0.0 |
0.5 |
1.0 |
1.5 |
2.0 |
0.01 |
2 |
3 |
4 |
5 |
6 7 |
2 |
3 |
4 |
5 |
6 7 |
2 |
|
|
|
|
|
|
0.1 |
|
|
|
|
1 |
|
|||||
|
|
Spatial frequency (cmÐ1) |
|
|
|
|
|
|
Spatial frequency (cmÐ1) |
|
|||||||
FIGURE 17.19. Modulation transfer function curves for a typical parallel-hole collimator for di erent source-to-collimator distances. Both linear and log-log plots are shown. The source-to-collimator distances are 2.5, 7.5, and 15 cm. Data are from J. C. Erhardt, L. W. Oberly, and J. M. Cuevas, Imaging Ability of Collimators in Nuclear Medicine, Rockville, MD, U.S. Dept. HEW, Publ. No. (FDA)79-8077 (1978), p. 39.
This is plotted in Fig. 17.25 for µ = 0, µ = 10 m−1 (511keV annihilation radiation) and µ = 15 m−1 (140 keV 99mTc). When µ = 0, F (x) = AV (2a∆x∆z), where 2a is the thickness of the source along the projection. Corrections for attenuation are made in a number of ways.11 Other nuclides used besides 99mTc are 81mKr, 133Xe, 131I, 67Ga, 123I, and 201Tl.
TABLE 17.6. Positron emitters used in nuclear medicine.
Nuclide |
Half-life |
11C |
20.3 min |
6 |
|
13N |
10.0 min |
7 |
|
15O |
2.1 min |
8 |
|
18F |
109.7 min |
9 |
|
17.14 Positron Emission Tomography
If a positron emitter is used as the radionuclide, the positron comes to rest and annihilates an electron, emitting two annihilation photons back to back. In positron emission tomography (PET) these are detected in coincidence. This simplifies the attenuation correction, because the total attenuation for both photons is the same for all points of emission along each γ ray through the body (see Problem 54). Positron emitters are short-lived, and it is necessary to have a cyclotron for producing them in or near the hospital. This is proving to be less of a problem than initially imagined. Commercial cyclotron facilities deliver isotopes to a number of nearby hospitals. Patterson and Mosley (2005) found that 97% of the people in the United States live within 75 miles of a clinical PET facility.
We have mentioned that nuclear medicine procedures have the potential to measure function, as the molecules to which the isotopes are bound move from or-
11See Cherry et al. (2003, pp. 305–312); Larsson (1980).
gan to organ in the body. This is particularly true for some of the lighter positron emitters, which have the advantage of being natural constituents of molecules in the body or similar to them (Table 17.6). PET can provide a functional image with information about metabolic activity. A very common positron agent is 18F fluorodeoxyglucose—glucose in which a hydroxyl group has been replaced with 18F. The PET signal is largest in those cells that have taken up the 18F because they are actively metabolizing glucose. PET has become particularly important in studies of brain function, where active neurons are detected by an increase in their metabolism, and in locating metastatic cancer. The number of installed PET scanners is growing very rapidly. Most of them have built-in CT scanners to provide accurate fused PET/CT images.
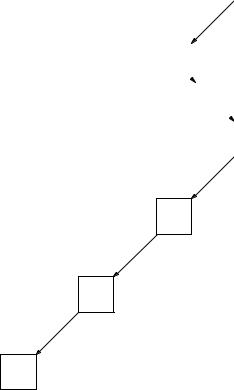
A PET scan overlaid on a magnetic resonance (MRI) image is shown in Fig. 17.26 The positron emitter is 15O- labeled water. The views are described in the caption. The subject is sequentially touching each finger of the left hand with the thumb. Activity can be seen in the
17.15 Brachytherapy and Internal Radiotherapy |
503 |
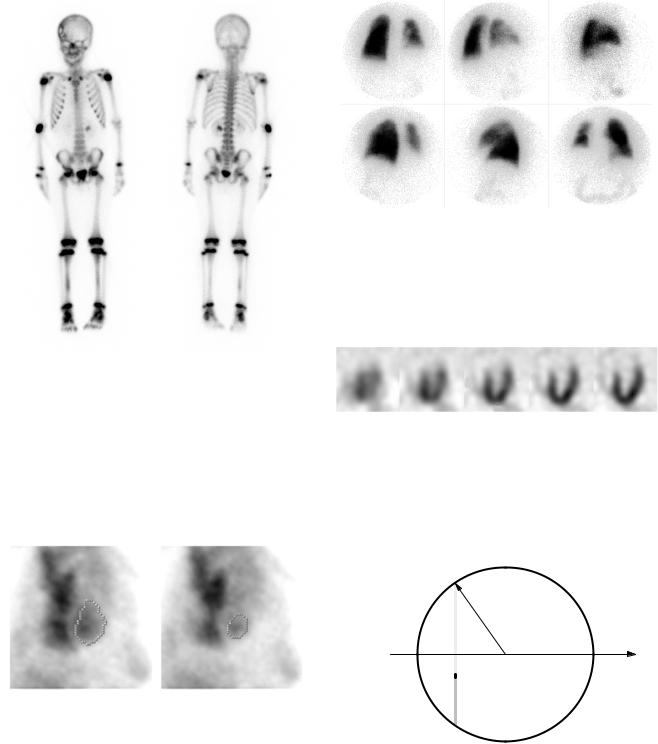
FIGURE 17.20. A scintillation camera “bone scan” of a 7-year-old male who received a 99mTc–diphosphonate injection. An anterior view is on the left, and a posterior view is on the right. The scan shows an area of decreased uptake surrounded by a dark ring in the right anterior skull, consistent with an eosinophilic granuloma. Identifiable hot regions are the injection site in the right elbow, an attempted injection site in the right hand, the bladder, and the left kidney, which is probably not remarkable on this exam, along with the ends of the long bones. Photograph courtesy of B. Hasselquist, Ph.D., Department of Diagnostic Radiology, University of Minnesota.
FIGURE 17.22. Lung scans of a patient who has received a lung transplant. The upper left is a posterior view; each successive view is rotated about the patient, ending with an anterior view on the lower right. The left lung is the transplant. It has much more activity than the diseased right lung. Photograph courtesy of B. Hasselquist, Ph.D., Department of Diagnostic Radiology, University of Minnesota.
FIGURE 17.23. Single photon emission computed tomographic (SPECT) slices of the heart. The patient was injected with 99mTc–tetrofosmin, an agent that is taken up by myocardium. The images have been reconstructed in planes parallel to the axis of the heart. The dark myocardium surrounds the blood in the left ventricle. Photograph courtesy of B. Hasselquist, Ph.D., Department of Diagnostic Radiology, University of Minnesota.
FIGURE 17.21. Two gated-scintillation camera views of the heart, imaged with 99mTc-labeled red blood cells. The dots outline the left ventricle. On the left is end diastole (left ventricle filled with blood). On the right is end systole (left ventricle at smallest volume). The ejection fraction is 66%. Photograph courtesy of B. Hasselquist, Ph.D., Department of Diagnostic Radiology, University of Minnesota.
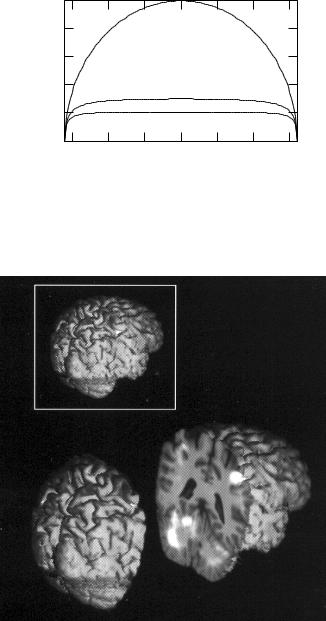
a = (R 2 − x 2 )1/2
R
x
dy
y − (− a)
− a = − (R 2 − x 2 )1/ 2
FIGURE 17.24. Projection perpendicular to the x axis for a radioactive source of uniform concentration, including the e ect of photon attenuation.
right cerebral sensorimotor cortex (slice, upper right) and in the left cerebellum (slice, lower left). The technique is described by Rehm et al. (1994) and Strother et al. (1995).
17.15Brachytherapy and Internal Radiotherapy
Brachytherapy (brachy means short) involves implanting in a tumor sources for which the radiation falls o
504 17. Nuclear Physics and Nuclear Medicine
)] |
1.0 |
|
|
|
|
|
|
1/2 |
|
|
|
|
|
= 0 |
|
) |
0.8 |
|
|
|
|
|
|
2 |
|
|
|
|
|
|
|
- x |
|
|
|
|
|
|
|
2 |
0.6 |
|
|
|
|
|
|
2 R |
|
|
|
|
|
|
|
|
|
|
|
|
|
|
|
- |
0.4 |
|
|
|
= 10 mÐ1 |
|
|
-exp( |
|
|
|
|
|||
0.2 |
|
|
|
|
|
|
|
)[1 |
|
|
|
= 15 mÐ1 |
|
||
|
|
|
|
|
|||
(1/ |
0.0 |
|
|
|
|
|
|
|
|
|
|
|
|
|
|
|
-15 |
-10 |
-5 |
0 |
5 |
10 |
15 |
x (cm)
FIGURE 17.25. Plot of the projection including attenuation, Eq. 17.64, for µ = 0, µ = 10 m−1 (corresponding to 511-keV annihilation radiation) and µ = 15 m−1 (corresponding to the photons from 99mTc). The radius of the circle is 16 cm.
FIGURE 17.26. A positron emission tomography (PET) scan is overlayed on an MR image. At the upper left is a three- -dimensional MRI of the brain viewed from above and to the right. At the bottom the image has been sliced through the motor strip and cerebellum, and the two pieces are separated. The PET image has been overlaid on the slice. The positron emitter is 15O-labeled water. The subject is sequentially touching each finger of the left hand with the thumb. Activity can be seen in the right cerebral sensorimotor cortex (slice, upper right) and in the left cerebellum (slice, lower left). Image courtesy of Prof. Kelly Rehm, University of Minnesota and the PET Imaging Service, Veterans Administration Medical Center, Minneapolis.
rapidly with distance because of attenuation, short range, or 1/r2. Originally the radioactive sources (seeds) were implanted surgically, resulting in high doses to the oper-
ating room personnel. In the afterloading technique, developed in the 1960s, hollow catheters are implanted surgically and the sources inserted after the surgery. Remote afterloading, developed in the 1980s, places the sources by remote control, so that only the patient receives a radiation dose.
We saw in Chapter 16 that fractionation of the dose results in better sparing of normal tissue for a given probability of killing the tumor. Afterloading allows the sources to be placed and removed, but it is often di cult for the patient to tolerate the catheters for long periods of time. This has led to the development of high-dose-rate brachytherapy (HDR), in which the dose is given in one or a few fractions over the course of a day or two [Nag (1994)]. Though this is much easier for the patient, tissue sparing is not as great as with a longer treatment. Current practice seeks to compensate for this by meticulous treatment planning based on an extended version of the linear-quadratic model, and by making sure that the tumor receives much higher doses than the surrounding normal tissue.
Radium was the first brachytherapy source, but it has been replaced by a number of nuclei that decay by β− emission or electron capture. Conventional low-dose-rate brachytherapy is delivered at 0.4–1.0 Gy hr−1. High dose rates are about 1 Gy min−1.
Patients with coronary artery disease are often treated with balloon angioplasty, in which a coronary artery is dilated by inserting a balloon on the end of a catheter into the femoral artery in the leg and from there through the aorta and into the coronary artery. One problem is restenosis or reclosure of the artery. Restenosis can be reduced by placing a stent —a helical coil of wire—in the artery at the time of the angioplasty. Restenosis sometimes occurs within a stent, though the rate of recurrence is reduced by using a stent which elutes (gives o ) a restenosis-inhibiting drug. If restenosis does occur, it can be treated by placing a string of radioactive seeds in the stent. Treatments may use either a gamma emitter, 192Ir, for 20 minutes, or a beta emitter (90Sr/90Y) for 3 minutes [Kaluza and Raizner (2004); Fox (2002)].
Internal radiotherapy treats the patient with a radionuclide in a chemical that is selectively taken up by the tumor. The classic example is the administration by mouth of capsules containing 131I for treatment of hyperthyroidism and thyroid cancer. Other nuclides are being used experimentally for breast and neuroendocrine tumors and melanoma [Fritzberg and Wessels (1995)]. A radionuclide for this purpose should emit primarily nonpenetrating radiation, have a physical half-life long compared to the biological half-life, have a large activity per unit mass, and exhibit a high degree of specificity for the tumor. If the nuclide can be delivered within the cell, then Auger electrons can be exploited. One way to achieve high concentrations in the tumor is radioimmunotherapy: monoclonal antibodies are tagged with the radionuclide [see the special issue of Medical Physics edited by Buchsbaum
and Wessels (1993)]. It turns out that double-strand DNA breaks from Auger cascades occur more often than had been expected, and that the bystander e ect is important. The use of Auger electrons from nuclides attached to the appropriate antibodies for cancer therapy is under active development; see Kassis (2004). The MIRD formulation can be adapted to the dose calculations [Watson et al. (1993)]. Radionuclide therapy is described for a general audience by Coursey and Nath (2000).
17.16 Radon
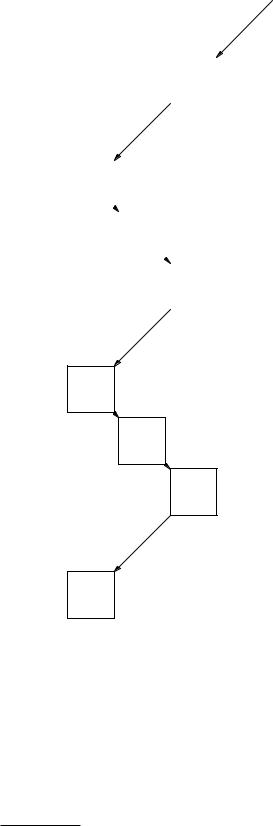
The naturally occurring radioactive nuclei are either produced continuously by cosmic γ ray bombardment, or they are the products in a decay chain from a nucleus whose half-life is comparable to the age of the earth. Otherwise they would have already decayed. There are three naturally occurring radioactive decay chains near the high-Z end of the periodic table. One of these is the decay products from 23892 U, shown in Fig. 17.27. The halflife of 238U is 4.5 × 10⁹ yr, which is about the same as the age of the earth. A series of α and β decays lead to radium, 226Ra, which undergoes α decay with a half-life of 1620 yr to radon, 222Rn.
Uranium, and therefore radium and radon, are present in most rocks and soil. Radon, a noble gas, percolates through grainy rocks and soil and enters the air and water in di erent concentrations. Although radon is a noble gas, its decay products have di erent chemical properties and attach to dust or aerosol droplets which can collect in the lungs. High levels of radon products in the lungs have been shown by both epidemiological studies of uranium miners and by animal studies to cause lung cancer [Committee on the Biological E ects of Ionizing Radiations, BEIR IV (1988); BEIR VI (1999)]. The deposition process is quite complicated. A certain fraction of the decay products attach to aerosol droplets. That fraction is an important parameter in estimating the dose, because the unattached particles are deposited in the airways; those that have attached to aerosols also are also deposited in the airways, the site depending on the droplet size. The rate at which natural mucus clearing from the lungs removes them is also variable.
The 22286 Rn decay scheme is shown in Fig. 17.28. (Alternate branches that occur very rarely are not shown.) The shaded nuclides are the greatest contributors to the dose. Radon is a noble gas; once it decays the other shaded nuclides decay shortly after. Radon dosimetry is described on pp. 137–158 of BEIR IV (1988) and in BEIR VI (1999). Typical uranium activities in soil are 20 Bq kg−1 (range 7–40), leading to radon concentrations in the air over average soil of about 4 Bq m−3.
The working level (WL) has been defined to be any combination of the shaded isotopes in Fig. 17.28 in 1 liter of air at ambient temperature and pressure that results in the ultimate emission of 1.3 × 10⁵ MeV of α-particle
|
17.16 Radon |
505 |
||||
|
|
|
|
|
|
|
146 |
|
|
|
|
23892 U |
|
|
|
|
|
4.5 X 10⁹ yr |
|
|
|
|
|
|
|
|
|
|
|
|
|
|
|
|
145 |
|
|
α |
|
|
|
|
|
|
|
|
|
|
|
|
|
|
|
||
144 |
234 Th |
|
|
|
|
|
90 |
|
|
|
|
|
|
|
24.1day |
|
|
|
||
|
|
|
β Ð |
|
|
|
|
|
|
|
|
||
|
|
|
234 Pa |
|
|
|
143 |
|
|
91 |
|
|
|
|
|
1.2m |
|
|
|
|
|
|
|
|
|
|
|
|
|
|
|
|
|
|
|
|
|
|
|
|
|
|
|
|
|
|
234 U |
|
142 |
|
|
|
|
92 |
|
|
|
|
|
2.5 X 10⁵ yr |
|
|
|
|
|
|
|
|
|
|
|
|
|
|
|
|
N 141
140 23090 Th
8 X 10⁴ yr
139
138 22688 Ra
1620 yr
137
13622286Rn
3.8day
86 |
87 |
88 |
89 |
90 |
91 |
92 |
Z
FIGURE 17.27. Decay of 238U to radon.
energy. This is about the energy liberated by the decay products in equilibrium with 100 pCi (3.7 Bq) of radon. Thus, 1 WL corresponds to 3.7 Bq l−1 or 3700 Bq m−3. More recently, the activity of radon and its decay products has been described by the Potential Alpha Energy Concentration (PAEC) [BEIR VI (1999), p. 179]. Its units are J m−3.
The working-level month (WLM) measures the total radon exposure and is 1 WL for 170 h (1 month of 40-h work weeks). Another unit is the PAEC multiplied by the number of hours exposure, measured in J h m−3. There are 3.5 × 10⁻³ J h m−3 per WLM.
Dose estimates for the miners and for the general population require models of aerosol size, unattached fraction, target cells, exercise level, and occupancy factors that are described in BEIR IV (1988). Averaging over all of these variables shows a dose in the lungs of about 6 mGy per WLM, with a factor-of-2 uncertainty because of these variables.
The report uses a time-since-exposure model to estimate the risk of lung cancer on the basis of four studies of groups of miners. The model predicts a relative risk ratio that is unity for no exposure and increases linearly to 3.5 for a continuous exposure of 5 WLM per year
506 17. Nuclear Physics and Nuclear Medicine
|
|
|
|
|
|
|
|
|
|
|
|
|
|
|
|
|
|
|
222 |
Rn |
|
136 |
|
|
|
|
|
|
86 |
|
|
|
|
|
|
|
|
|
|
|
3.8 day |
|
|
135 |
|
|
|
|
|
|
|
|
|
|
|
|
|
|
|
|
|
|
|
|
|
|
|
|
|
|
|
|
|
|
|
|
|
|
218 |
Po |
|
|
|
|
|
|
|
134 |
|
84 |
|
|
|
|
|
|||
|
3 |
min |
|
|
|
|
|
|
||
|
|
|
|
|
|
|
|
|||
|
|
|
|
|
|
|
|
|
|
|
α
133
132 |
21482Pb |
|
|
||||
27 min |
|
|
|
|
|
||
|
|
|
|||||
|
|
|
β Ð |
|
|||
|
|
|
|
|
|
|
|
131 |
|
|
21483Bi |
|
|
|
|
|
|
20 min |
|
|
|
||
|
|
|
|
|
|||
|
|
|
|
|
|
||
|
|
|
|
|
|
|
|
N 130 |
21484 Po |
||||||
164 |
µs |
||||||
|
|
|
|
|
|||
|
|
|
|
|
|
|
|
129
128 21082Pb
22 yr
127 21083 Bi
5 day
126 21084 Po
138 day
125
124 20682Pb Stable
82 |
83 |
84 |
85 |
86 |
Z
FIGURE 17.28. Decay of radon. The decay of the shaded nuclides is most significant in determining dose.
over a lifetime.12 The report uses the linear-non-threshold model to estimate risks to the general population at small exposures. The issue of applying the linear-no-threshold model was discussed in Sec. 16.13. See particularly the
12BEIR IV (1988), Fig. 2.2. This is averaged by BEIR over smokers and nonsmokers and by me over sex.
data from the Cohen study in Fig. 16.57. Typical radon concentrations in houses are usually less than 4r0 or 4 pCi l−1 (128 Bq m−3) or 0.04 WL. (We saw in Sec. 16.13 that r0 = 37 Bq m−3 = 1 pCi l−1). Exposure to r0 for 24 h per day for one year gives 0.5 WLM. The miners had exposures of 5–100 WLM per year, over periods of 3–20 years.
Symbols Used in Chapter 17
Symbol |
Use |
Units |
|
First |
|
|
|
|
used on |
|
|
|
|
page |
a |
Distance |
m |
|
501 |
b |
Source to collimator |
m |
|
511 |
|
distance |
|
|
|
c |
Speed of light |
m s−1 |
|
482 |
d |
Width of collimator |
m |
|
511 |
|
channel |
|
|
|
e |
Electron charge |
C |
|
482 |
fr |
Fraction of transition |
|
|
485 |
|
energy released as photons |
|
|
|
fK , fL |
Fraction of transition |
|
|
485 |
|
energy released in K- or |
|
|
|
|
L-shell internal conversion |
|
|
|
g |
Detector e ciency |
|
|
511 |
h |
Planck’s constant |
J s |
|
488 |
h, k |
Denote specific organs |
|
|
489 |
l |
Collimator thickness |
m |
|
511 |
m0 |
Rest mass |
kg |
|
482 |
mx |
Rest mass of particle type |
kg |
|
483 |
|
x |
|
|
|
ni |
Mean number (fraction) of |
|
|
489 |
|
emissions of type i per |
|
|
|
|
transition |
|
|
|
p |
Momentum |
kg m s−1 |
486 |
|
rh, rk |
Source and target regions |
|
|
489 |
r |
Distance |
m |
|
494 |
r0 |
Radon concentration unit |
Bq m−3 |
506 |
|
s |
Path length |
m |
|
494 |
t |
Time |
s |
|
484 |
t |
Collimator septum |
m |
|
511 |
|
thickness |
|
|
|
v |
Speed |
m s−1 |
|
482 |
w |
Distance across collimator |
m |
|
511 |
|
wall in the direction of |
|
|
|
|
photon travel |
|
|
|
x, y, z |
Position |
m |
|
501 |
A |
Mass number |
|
|
482 |
A, A0 |
Activity |
Bq |
|
484 |
˜ |
Cumulated activity in |
Bq s |
|
489 |
Ah |
|
|||
|
organ h |
|
|
|
B |
Buildup factor |
|
|
494 |
B, BK , BL |
Binding energy |
eV |
|
484 |
Ch, C˜h |
Activity and cumulated |
Bq kg−1; |
492 |
|
|
activity per unit mass in |
kg−1 |
|
|
|
organ h |
|
|
|
D |
Dose |
J |
kg−1 |
489 |
|
|
(Gy) |
|
|
E, Eγ |
Energy |
J, eV |
|
482 |
Fh |
Fraction of activity in |
|
|
490 |
|
organ h |
|
|
|
|
|
|
|
|
|
|
|
|
|
|
|
|
Problems |
507 |
||
Symbol |
Use |
Units |
First |
trons in each shell are |
|
|
|
|
|
|
||||||
|
|
|
|
|
used on |
|
Shell |
Number of electrons |
|
BE per electron (eV) |
||||||
|
|
|
|
|
page |
|
|
|||||||||
Fh |
Fraction of activity in organ h |
|
490 |
|
|
|
|
|
|
|
|
|
|
|||
|
|
K |
|
|
|
2 |
|
69,525 |
|
|||||||
F |
Projection |
Bq |
501 |
|
|
|
|
|
|
|||||||
|
L |
|
|
|
8 |
|
11,023 |
|
||||||||
K |
Geometric factor |
|
511 |
|
|
|
|
|
|
|||||||
M, MX |
Mass |
kg |
487 |
|
M |
|
|
|
18 |
|
2,125 |
|
||||
N |
Neutron number |
|
482 |
|
N |
|
|
|
32 |
|
215 |
|
||||
N, N0 |
Number of nuclei |
|
484 |
|
O |
|
|
|
12 |
|
35 |
|
||||
R, R0 |
Nuclear radius |
m |
482 |
|
|
|
|
|
|
|||||||
|
P |
|
|
|
2 |
|
|
1 |
|
|||||||
R |
Radius of disk |
m |
501 |
|
|
|
|
|
|
|
||||||
|
|
|
|
|
|
|
|
|
|
|||||||
Rt, Ro |
True and observed counting |
s−1 |
510 |
Calculate the atomic rest energy of tungsten. |
|
|
||||||||||
|
|
|
rates |
|
|
|
|
|||||||||
|
|
|
|
|
|
|
|
|
|
|
|
|
|
|
||
S |
Mean absorbed dose per unit |
J kg−1 |
489 |
|
|
|
|
|
|
|
|
|
|
|||
|
|
|
cumulated activity |
|
|
Section 17.4 |
|
|
|
|
|
|
||||
S |
Area |
m2 |
494 |
|
|
|
|
|
|
|||||||
T |
Kinetic energy |
J, eV |
482 |
Problem 4 Refer to Figs. 17.2 and 17.5. Uranium splits |
||||||||||||
T |
Time |
s |
508 |
|||||||||||||
roughly in half when it undergoes nuclear fission. Will the |
||||||||||||||||
T1/2 |
Half-life |
s |
484 |
|||||||||||||
Tj |
Half-life for jth biological |
s |
490 |
fission fragments decay by β+ or β− emission? |
|
|
||||||||||
|
|
|
disappearance process |
|
|
Problem 5 The following nuclei of mass 15 are known: |
||||||||||
WK |
Fluorescence yield for K shell |
|
493 |
|||||||||||||
Z |
Atomic number (number of |
|
482 |
15 |
15 |
15 |
|
|
15 |
N is stable. How do the |
||||||
|
|
|
protons) |
|
|
6 C, |
7 N, and 8 O. Of these, |
|
||||||||
|
|
|
|
|
others decay? |
|
|
|
|
|
|
|||||
αK , αL |
Internal conversion coe cient |
|
485 |
|
|
|
|
|
|
|||||||
|
|
|
|
|
|
|
|
|
|
|
||||||
αh |
Fraction of total activity in |
|
508 |
Problem 6 Look up the decay schemes of the following |
||||||||||||
|
|
|
organ h |
|
|
isotopes (for example, in the Handbook of Chemistry and |
||||||||||
β−, β+ |
Electron and positron (in β |
|
485 |
|||||||||||||
|
Physics, CRC Press, or at www.nndc.bnl.gov/). Com- |
|||||||||||||||
|
|
|
decay) |
|
|
|||||||||||
λ |
Physical decay constant |
s−1 |
484 |
ment on their possible medical usefulness: 3H, 15O, 13N, |
||||||||||||
λj |
Decay constant for jth |
s−1 |
490 |
18F, 22Na, 68Ga, 64Cu, 11C, 123I, and 56Ni. |
|
|
||||||||||
|
|
|
biological process |
|
|
|
|
|
|
|
|
|
|
|
|
|
µ |
|
|
Attenuation coe cient |
m−1 |
501 |
Problem 7 Look up the half-lives of the isotopes in Fig. |
||||||||||
µen |
Energy absorption coe cient |
m−1 |
494 |
17.6 |
(for |
instance in |
the |
Handbook of Chemistry |
and |
|||||||
ν, |
ν |
|
Neutrino, antineutrino |
|
486 |
Physics, |
CRC Press |
or at |
www.nndc.bnl.gov/). Relate |
|||||||
ν |
Photon frequency |
Hz |
488 |
|||||||||||||
qualitatively the half life to the position of the isotope on |
||||||||||||||||
ρ |
Density |
kg m−3 |
494 |
|||||||||||||
σφ |
Standard deviation of φ |
|
494 |
the parabola. |
|
|
|
|
|
|
||||||
φi |
Absorbed fraction |
|
489 |
|
|
|
|
|
|
|
|
|
|
|||
τ |
Detector dead time |
s |
510 |
|
|
|
|
|
|
|
|
|
|
|||
τh |
Residence time in organ h |
s |
490 |
Section 17.5 |
|
|
|
|
|
|
||||||
∆i |
Mean energy emitted in |
J |
489 |
Problem 8 Calculate the conversion factor k of Eq. |
||||||||||||
|
|
|
radiation type i |
|
|
|||||||||||
Φj |
Specific absorbed fraction |
kg−1 |
489 |
17.22b. |
|
|
|
|
|
|
|
|||||
Problems
Section 17.1
Problem 1 The best current (2002) value for the mass of the proton is 1.007276467 u. The mass of the electron is 5.485799095 ×10⁻⁴ u. The binding energy of the electron in the hydrogen atom is 13.6 eV. Calculate the mass of the neutral hydrogen atom.
Problem 2 Solve Eq. 17.1 for the kinetic energy, T . Show that when v c, it reduces to the familiar T = m0v2/2.
Problem 3 The rest energy of the 74184W |
nucleus is |
171, 303 MeV. The average binding energies |
of the elec- |
Section 17.6
Problem 9 Show that 1 Ci h = 1.332 × 10⁸ disintegrations or Bq s.
Problem 10 Obtain a numerical value for the residence time for 99mTc-sulfur colloid in the liver if 85% of the drug injected is trapped in the liver and remains there until it decays.
Problem 11 Derive Eqs. 17.40–17.42.
Problem 12 Calculate numerical solutions of Eqs. 17.40 and 17.42 and plot them on semilog paper. Use
λ = 2, λ1 = 0.5, λ2 = 3.
Problem 13 Eq. 17.42 is not valid if λ1 = λ2. In that case, try a solution of the form N2 = Bte−λt and obtain a solution.
Problem 14 Derive Eqs. 17.43 and 17.44.
508 17. Nuclear Physics and Nuclear Medicine
Problem 15 The biological half-life of iodine in the thyroid is about 25 days. 125I has a half-life of 60 days. 132I has a half-life of 2.3 h. Find the e ective half-life in each case.
Problem 16 For Sec. 17.6.4, with λ = 0.05 h−1, λ1 = 1
−1 −1 ˜ ˜
h , and λ2 = 0.1 h , find A1 and A2 in terms of the initial activity A0 and in terms of the initial number of nuclei N0.
Problem 17 N0 radioactive nuclei with physical decay constant λ are injected in a patient at t = 0. The nuclei move into the kidney at a rate λ1, so that the number in the rest of the body falls exponentially: N (t) = N0e−(λ+λ1)t. Suppose that the nuclei remain in the kidney for a time T before moving out in the urine. (This is a crude model for the radioactive nuclei being filtered into the glomerulus and then passing through the tubules before going to the bladder.)
(a)Calculate the cumulated activity and the residence time in the kidney by finding the total number of nuclei entering the kidney and multiplying by the probability that a nucleus decays during the time T that it is in the kidney.
(b)Calculate the cumulated activity and residence time in the bladder, assuming that the patient does not void.
Problem 18 Suppose that at t = 0, 99mTc with an activity of 370 kBq enters a patient’s bladder and stays there for 2 h, at which time the patient voids, eliminating all of it. What is the cumulated activity? What is the cumulated activity if the time is 4 h?
Problem 19 Suppose that the 99mTc of the previous problem does not enter the bladder abruptly at t = 0, but that it accumulates linearly with time. At the end of 2 h the activity is 370 kBq and the patient voids, eliminating all of it. What is the cumulated activity?
Problem 20 A radioactive substance has half-life T1/2. It is excreted from the body with biological half-life T1. N0 radioactive nuclei are introduced in the body at t = 0. Find the total number that decay inside the body.
Problem 21 The fractional distribution function αh is
the fraction of the total activity which is in organ h:
αh(t) = Ah(t)/A(t) = Ah(t)/A0e−λt.
(a) Show that τh = ∞ αh(t)e−λtdt.
0
(b) Calculate α1(t) and α2(t) for Eqs. 17.40 and 17.42 and show that integration of these expressions leads to Eqs. 17.44.
Problem 22 Suppose that the fractional distribution function (defined in the previous problem) is α(t) = 1, t < T ; α(t) = b, t > T ; (b < 1). Find the residence time. This is a simple model for the situation where a bolus (a fixed amount in a short time) of some substance passes through an organ once and is then distributed uniformly in the blood.
Problem 23 The distribution function qh(t) is defined to be the activity in organ h corrected for radioactive decay to a reference time. If the correction is from time t to time 0, find an expression for qh(t) in terms of Ah(t).
Problem 24 The “o cial” definition of the fractional distribution function αh(t) is the ratio of the distribution function qh(t) produced by a bolus administration to the patient, divided by the activity A0 in the bolus. Show that this is equivalent to the definition in Problem 21.
Problem 25 Show that if the uptake in a compartment is not instantaneous but exponential, with subse-
˜
quent exponential decay, the cumulated activity is A = 1.443A0(TeTue/Tu), where Te is the e ective half-life for excretion, and Tue = TuT1/2/(Tu + T1/2). Hint: See Eq. 17.43.
Section 17.7
Problem 26 Use the output data of Fig. 17.4 to estimate values for WK , Kα/(Kα +Kβ ), and Kβ /(Kα +Kβ ). Compare your values to those used in Table 17.2.
Problem 27 Rearrange the output data of Fig. 17.4. Find the total ∆ for emission of photons below 30 keV and charged particles. Rank the radiations in the order they contribute to the dose.
Problem 28 Calculate the entries in the output data of Fig. 17.4 for γ3, using the same techniques that were used in the text for γ1 and γ2.
Problem 29 The isotope 13354 Xe is used for studies of pulmonary function by inhalation. It decays by β emission with a half-life of 5.3 days to 13355 Cs. The maximum β energy is 0.346 MeV; the average is 0.100 MeV. The cesium then emits a 0.081-MeV γ ray. The Cs has the following properties:
αK = 1.46, αL = 2.35, αM = 0.078
EK = 0.031 MeV, BK = 0.036 MeV, BL = 0.006 MeV.
Calculate ∆i for the β particle, the γ ray, K and L internal conversion electrons, and Kα x rays. Assume that all x rays are Kα.
Problem 30 Nitrogen-13 has a half-life of 10 min. All of the disintegrations emit a positron with end point energy 1.0 MeV (average energy 0.488 MeV). There is no electron capture. Make a table of radiations that must be considered for calculating the absorbed dose and determine Ei and ∆i for each one.
Problem 31 A patient swallows 3.5 × 10⁹ Bq of 131I. The half-life of the iodine is 8 days. Ten minutes later the patient vomits all of it. If none had yet left the stomach and all was vomited, determine the cumulated activity and residence time in the stomach.
Section 17.8
Problem 32 Derive Eq. 17.61 by substituting Eqs. 17.59 and 17.60 in Eq. 17.58. You will also have to justify and use Eq. 17.62.
Problem 33 The body consists of two regions. Region 1
˜
has mass m1 and cumulated activity A1. It is completely surrounded by region 2 of mass m2 and cumulated activity
˜ |
˜ |
˜ |
. We can say that the mass of the total body |
A2 |
= A0 |
−A1 |
is mT B = m1 + m2 = m1 + mRB. A single radiation is emitted with disintegration energy ∆. The radiation is nonpenetrating so that
φ(1 ← 1) = φ(2 ← 2) = 1,
φ(1 ← 2) = φ(2 ← 1) = 0.
(a)What are φ(TB← 1) and φ(TB← 2)?
(b)What are the corresponding values of Φ and S?
(c)Show that directly from the definition, Eq. 17.58
˜
D1 = A1∆/m1,
˜
D2 = DRB = A2∆/m2,
˜
DTB = A0∆/(m1 + m2)
˜˜
(d)Calculate Au and A1.
(e)What is S(1 ←TB)? Remember that φ is calculated for activity uniformly distributed within the source region.
(f ) Calculate the dose to region 1 using Eq. 17.61 and show that it agrees with (c).
(g)Evaluate S(1 ←RB) using Eq. 17.62 and show that it agrees with S(1 ← 2).
Problem 34 The body consists of two regions. Region 1
˜
has mass m1 and cumulated activity A1. It is completely surrounded by region 2 of mass m2 and cumulated activ-
˜
ity A2. A single radiation is emitted with disintegration energy ∆. The characteristics of the radiation are such that
φ(1 ← 1) + φ(2 ← 1) = 1,
φ(1 ← 2) + φ(2 ← 2) + φ(0 ← 2) = 1,
where φ(0 ← 2) represents energy from region 2 that has escaped from the body. Obtain expressions for the dose to each region and the whole body dose.
Section 17.9
Problem 35 Consider the decay of a parent at rate λ1 to an o spring that decays with rate λ2.
(a)Write a di erential equation for the amount of o - spring present.
(b)Solve the equation.
(c)Discuss the solution when λ2 > λ1.
(d)Discuss the solution when λ2 < λ1.
(e)Plot the solution for a technetium generator that is eluted every 24 h.
Problems 509
Problem 36 N0 nuclei of 99mTc are injected into the body. What is the maximum activity for the decay of the metastable state? When does the maximum activity for decay of the ground state occur if no Tc atoms are excreted? What is the ratio of the maximum metastable state activity to the maximum ground-state activity?
Problem 37 If 1 µCi of 99mTc is injected in the blood and stays there, relate the activity in a sample drawn time t later to the volume of the sample and the total blood volume. If the gamma rays are detected with 100% e ciency, what will be the counting rate for a 10-ml sample of blood if the blood volume is 5 liters? (Using non-SI units was intentional.)
Problem 38 Assume that aggregated human albumin is in the form of microspheres. A typical dose of albumin microspheres is 0.5 mg of microspheres containing 80 MBq of 99mTc and 15 µg of tin. There are 1.85 × 10⁶ microspheres per mg.
(a)How many 99mTc atoms are there per microsphere?
(b)How many tin atoms per microsphere?
(c)How many technetium atoms per tin atom?
(d)What fraction of the surface of a microsphere is
covered by tin? Assume the sphere has a density of 103 kg m−3.
Problem 39 It is estimated that the total capillary surface area in the lung is 90 m2. Assume each capillary has 50 segments, each 10 µm long, and a radius of 5 µm.
(a)How many capillaries are there in the lung?
(b)There are about 3 × 10⁸ alveoli in both lungs. How many capillaries per alveolus are there?
(c)An alveolus is 150–300 µm in diameter. Are the above answers consistent?
(d)A typical dose of albumin microspheres is 0.5 mg with an average diameter of 25 µm. There are 1.85 × 10⁶ spheres per mg. What fraction of the capillaries are blocked if there is good mixing?
Section 17.10
Problem 40 The half-life of 99mTc is 6.0 h. The halflife of 131I is 8.07 day. Assume that the same initial activity of each is given to a patient and that all of the substance remains within the body.
(a)Find the ratio of the cumulated activity for the two isotopes.
(b)99mTc emits 0.141-MeV photons. For each decay of 131I the most important radiations are 0.89 β− of average energy 0.192 MeV and 0.81 photons of 0.365 MeV. If all of the decay energy were absorbed in the body, what would be the ratio of doses for the same initial activity?
Problem 41 A patient is given an isotope which spreads uniformly through the lungs. It emits a single radiation: a γ ray of energy 50 keV. There are no internal-conversion
510 17. Nuclear Physics and Nuclear Medicine
electrons. The cumulated activity is 40 GBq s. Find the absorbed dose in the liver (m = 1.83 kg).
Problem 42 The decay of 99mTc can be approximated by lumping all of the decays into two categories:
Radiation |
Ei (MeV) |
∆i (J) |
γ |
0.14 |
2 × 10⁻¹⁴ |
Electrons and soft x rays |
|
2.76 × 10⁻¹⁵ |
Remember that for activity uniformly distributed in the total body, φ(lung←TB) = mlung/mTB and use some of the information in Table 17.4 to show that
S(lung ← TB) = 1.463 × 10⁻¹⁶ J kg−1,
S(TB ← TB) = 1.414 × 10⁻¹⁶ J kg−1.
Sulfur colloid labeled with 100 MBq of 99mTc is given to a patient and is taken up immediately by the liver. Assume it stays there. Find the dose to the liver, spleen, and whole body. Use the following information:
|
|
Absorbed fraction for a source in |
|
|
|
the liver |
|
|
|
|
|
Target organ |
Mass (kg) |
E(γ) = 0.1 MeV |
E(γ) = 0.2 MeV |
|
|
|
|
Liver |
1.833 |
0.165 |
0.158 |
Spleen |
0.176 |
0.000 606 |
0.000 645 |
Whole body |
70.0 |
0.454 |
0.415 |
Problem 43 An ionization-type smoke detector contains 4.4 µCi of 241Am. This isotope emits α particles (which we will ignore) and a 60-keV γ ray, for which n = 0.36. The half-life is 458 yr.
(a)How many moles of 241Am are in the source?
(b)Ignoring attenuation, backscatter, and buildup in any surrounding material (such as the cover of the smoke detector), what is the absorbed dose in a small sample of muscle located 2 m away, if the muscle is under the detector for 8 h per day for 1 year?
Problem 44 One mCi of a radioactive substance lodges permanently in a patient’s lungs. The substance emits a single 80-keV γ ray. It has a half-life of 12 h. Find the cumulated activity and the dose to the liver (mass 1833 g).
Problem 45 The dose calculation for microspheres in the lung was an oversimplification because technetium leaches o the spheres. The footnote in Section 17.10 lists some more realistic residence times. If none of the technetium is excreted from the body, the sum of all the residence times will still be 8.7 h. Assume that the residence time in the lungs is 4.3 h and the residence time in the rest of the body is 4.4 h.
(a) Show that A˜ |
= 4.46 |
× |
3, 600 |
× |
A |
0 |
and A˜ |
= |
u |
|
|
|
lung |
|
4.24 × 3, 600 × A0.
(b) For a source distributed uniformly throughout the total body, the absorbed fractions for 140-keV photons are φ(lung←TB) = 0.0053, φ(TB←TB) = 0.3572. Split the radiation into penetrating and nonpenetrating components:
S(lung ← TB)
= (φnonpen∆nonpen + φpenetrating∆penetrating)/mlung.
(c) Calculate the dose to the lungs and the total body dose for an initial activity of 37 MBq. Compare the values to those in Table 17.4.
Section 17.12
Problem 46 Nuclear counting follows Poisson statistics. Show that for a fixed average counting rate R (counts per second) the standard deviation of a sum of N measurements each of length T is the same as a single measurement of duration N T . (Hint: You will first have to consider the situation where one measures y = x1 + x2 + · · · and find the variance of y in terms of the variances of the xi when there is no correlation between the xi.)
Problem 47 The interaction of a photon in a nuclear detector (an “event”) initiates a process in the detector that lasts for a certain length of time. A second event occurring within a time τ of the first event is not recorded as a separate event. Suppose that the true counting rate is Rt. A counting rate Ro is observed.
(a) A nonparalyzable counting system is “dead” for a time τ after each recorded event. Additional events that occur during this dead time are not recorded but do not prolong the dead time. Show that Rt = Ro(1 − Roτ )and
Ro = Rt/(1 + Rtτ ).
(b)A paralyzable counting system is unable to record a second event unless a time τ has passed since the last event. In other words, an event occurring during the dead
time is not only not recorded, it prolongs the dead time. Show that in this case Ro = Rte−Rt τ . (Hint: Use the Poisson distribution of Appendix J to find the fraction of events separated by a time greater than τ . The probability that the next event occurs between t and t + dt is the probability of no event during time t multiplied by the probability of an event during dt.)
(c)Plot Ro vs. Rt for the two cases when τ is fixed. The easiest way to do this is to plot Roτ vs. Rtτ .
Problem 48 Two channels of a collimator for a gamma camera are shown in cross section, along with the path of a photon that encounters the minimum thickness of collimator septum (wall).
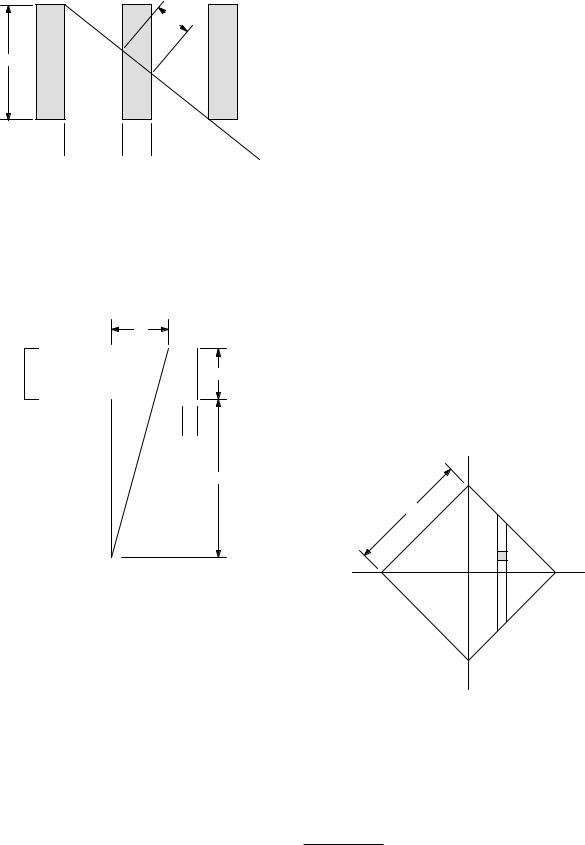
w
l
 d
d 
 t
t 
(a)Show that if (d + t)/l 1, then w/t = l/(2d + t).
(b)If transmission through the septum is to be less than 5%, what is the relationship between t, d, l, and µ? Evaluate this for 99mTc and for a positron emitter.
Problem 49 Photons from a point source a distance b below a collimator pass through channels out to a distance a from the perpendicular to the collimator passing through the source.
a
l
 d
d 
b
Point Source
Problems 511
(c) Calculate the geometric e ciency g assuming that all channels that pass any photons have the same e - ciency as the one on the perpendicular from the source. Show that it is of the form
g = K2 |
d |
2 |
d |
2 |
|
d + t |
|
||
|
l |
|
||
and evaluate K. More detailed calculations show that K is about 0.24 for a hexagonal array of round holes and
0.26for hexagonal holes.13
(d)How does the detector e ciency relate to the collimator resolution?
Section 17.13
Problem 51 (a) Derive Eq. 17.64 from Eq. 17.63.
(b) Calculate the limit of Eq. 17.64 when there is no attenuation.
Problem 52 The attenuation distortion for SPECT can be reduced by making measurements on opposite sides of the patient and taking the geometric mean. The geometric mean of variables x1 and x2 is (x1x2)1/2. Calculate the geometric mean of two SPECT measurements on opposite sides of the patient. Ignore possible 1/r2 e ects.
Problem 53 Consider a radioactive source having a uniform activity per unit volume AV and the square geometry shown below.
y
R
x
(a)Find an expression for a in terms of b, d, and l.
(b)Assume that a is related to the spatial frequency k for which the modulation transfer function (MTF) = 0.5 in Fig. 17.19 by a = K/k, where K is a constant. Calculate the thickness l of the collimator.
Problem 50 The collimator e ciency of a gamma camera is defined to be the fraction of the γ rays emitted isotropically by a point source that pass through the collimator into the scintillator.
(a)Consider a circular channel of diameter d in the collimator directly over the source. Show that the fraction of the photons striking the scintillator after passing through that channel is d2/16(l + b)2. (Assume that any photons that strike the septum are lost).
(b)Use the result of the previous problem to estimate the number of channels through which at least some photons from the point source pass. Assume that the fraction
of collimator area that is occupied by channels rather than lead is [d/(d + t)]2.
(a) Calculate the projection F (x) including the e ects of attenuation with coe cient µ.
(b) Plot F (x) for µ = 0 and for µR = 3.
Section 17.14
Problem 54 Suppose that A positrons are emitted from a point per second. They come to rest and annihilate
13Cherry et al. (2003, p. 242); R. P. Grenier, M. A. Bender, and R. H. Jones (1974). A computerized multicrystal scintillation gamma camera, Chapter 3 in H. G. Hine and J. A. Sorenson, eds. Instrumentation in Nuclear Medicine. New York, Academic, Vol. 2.