Добавил:
Опубликованный материал нарушает ваши авторские права? Сообщите нам.
Вуз: Предмет: Файл:

Intermediate Physics for Medicine and Biology - Russell K. Hobbie & Bradley J. Roth

.pdf
Скачиваний:
92
Добавлен:
10.08.2013
Размер:
20.85 Mб
Скачать

512 17. Nuclear Physics and Nuclear Medicine

within a short distance of their source. When a positron annihilates, two photons are emitted in opposite directions. Two photon detectors are set up on opposite sides of the source. The source is distance r1 from the first detector, of area S1, and r2 from the second detector of area S2. The area S2 is large enough so that the second photon will definitely enter detector 2 if the first photon enters detector 1. Assume that both detectors count with 100% e ciency.

S1 r1

a2

r

a1

2


S2

(a) Show that the number of counts in the first detector would be 2AS1/4πr12 if there were no attenuation between source and detector, and that it is (2AS1/4πr12)e−µa1 if attenuation in a thickness a1 of the body is considered.

(b) Detector 2 detects the second photon for every photon that strikes detector 1. Assuming a uniform attenuation coe cient and body thickness a2, find an expression for the number of events in which both photons are detected.

Problem 55 Positron emission tomography relies on simultaneous detection of the back-to-back annihilation gamma rays (a “coincidence”). In addition to true coincidences, there can be “scatter coincidences” in which annihilation photons coming from a point that is not on the line between the two detectors enter both detectors. There can also be “random coincidences” which arise from photons from completely independent decays that occur nearly simultaneously. Consider a ring of detectors around a patient. Make three drawings showing true coincidences, scatter coincidences and random coincidences.

Section 17.16

Problem 56 The half-life of 235U is 7 ×10⁸ yr. The age of the earth is 4.5 billion years. What fraction of the 235U that existed on the earth when it was first formed is present now?

Problem 57 There are three naturally occurring decay series beginning with three long-lived isotopes: 238U (Figs. 17.27 and 17.28), 235U, and 232Th. The 232Th series begins with the α decay of 232Th (half-life = 1.4×10¹⁰ yr) to

nucleus A which undergoes βdecay to nucleus B which undergoes βdecay to nucleus C which undergoes α decay to nucleus D which undergoes α decay to nucleus E, etc. Make a chart like Fig. 17.27 showing the first five steps in the series, and identify the five nuclei A– E.

Problem 58 One way to determine the age of biological remains is “carbon-14 dating.” The common isotope of carbon is stable 12C. The rare isotope 14C decays with a half-life of 5,370 yr. 14C is constantly created in the atmosphere by cosmic rays. The equilibrium between production and decay results in about 1 of every 1012 atoms of carbon in the atmosphere being 14C, mostly as part of a CO2 molecule. As long as the organism is alive, the ratio of 12C to 14C in the body is the same as in the atmosphere. Once the organism dies, it no longer incorporates 14C from the atmosphere, and the number of 14C nuclei begins to decrease. Suppose the remains of an organism have one 14C for every 1013 12C nuclei. How long has it been since the organism died?

Problem 59 Consider a fictitious two-step decay series analogous to the more complex series shown in Fig. 17.27. The series starts with isotope A which decays at rate λ1 to isotope B. Isotope B decays to isotope C with rate λ2. Isotope C is stable.

(a)Derive the di erential equation governing the number of nuclei NA, NB , and NC . Where else in this chapter have you seen the same equations?

(b)Solve the di erential equations using the initial con-

ditions NA(0) = N, NB (0) = NC (0) = 0. Make sure your solutions make sense for t → 0 and t → ∞.

(c)Find NB /NA in the limit λ2 λ. Ignore short times. Also find activities AA and AB . Explain physically how such a small number of nuclei NB can contribute so much to the total activity.

References

Arqueros, F., and G. D. Montesinos (2003). A simple algorithm for the transport of gamma rays in a medium.

Amer. J. Phys. 71(1): 38–45.

BEIR IV (1988). Committee on the Biological E ects of Ionizing Radiations. Health Risks of Radon and Other Internally Deposited Alpha-Emitters. Washington, D.C., National Academy Press.

BEIR VI (1999). Committee on Health Risks of Exposure to Radon. Health E ects of Exposure to Radon.

Washington, D.C., National Academy Press.

Berger, M. J. (1968). Energy Deposition in Water by Photons from Point Isotropic Sources. NM/MIRD Pamphlet 2. New York, Society of Nuclear Medicine.

Buchsbaum, D., and B. W. Wessels (1993). Introduction: Radiolabeled antibody tumor dosimetry. Med. Phys. 20(2, Pt. 2): 499–501.


References

513

Cherry, S. R., J. A. Sorenson, and M. E. Phelps (2003).

Loevinger, R., T. F. Budinger, and E. E. Watson

Physics in Nuclear Medicine, 3rd ed. Philadelphia,

(1988). MIRD Primer for Absorbed Dose Calculations.

Saunders.

New York, Society of Nuclear Medicine.


Co ey, J. L., and E. E. Watson (1979). Calculating the

Nag, S. ed. (1994). High Dose Rate Brachytherapy: A

dose from remaining body activity: A comparison of two

Textbook. Armonk, NY, Futura.


methods. Med. Phys. 6(4): 307–308.

Patterson, J. C., and M. L. Mosley (2005). How avail-

Coursey, B. M. and R. Nath (2000). Radionuclide ther-

able is positron tomography in the United States? Mol.

apy. Physics Today 53(4): 25–30.

Imaging Biol. 7(3): 197–200.


Dillman, L. T., and F. C. Von der Lage (1974). Ra-

Rehm, K., S. C. Strother, J. R. Anderson, K. A.

dionuclide Decay Schemes and Nuclear Parameters for

Schaper, and D. A. Rottenberg (1994). Display of

Use in Radiation Dose Estimation. NM/MIRD Pamphlet

merged multimodality brain images using interleaved pix-

10. New York, Society of Nuclear Medicine.

els with independent color scales. J. Nucl. Med. 35: 1815–

Eckerman K. F., R. J. Westfall, J. C. Ryman, and M.

1821.


Cristy (1994). Availability of nuclear decay data in elec-

Sastry, K. S. R. (1992). Biological e ects of the Auger

tronic form, including beta spectra not previously pub-

emitter iodine-125: A review. Report No. 1 of the AAPM

lished. Health Phys. 67(4): 338–345.

Nuclear Medicine Task Group No. 6. Med. Phys. 19(6):

Eisberg, R., and R. Resnick (1985). Quantum Physics

1361–1370.


of Atoms, Molecules, Solids, Nuclei, and Particles, 2nd

Snyder, W. S., M. R. Ford, and G. G. Warner (1976).

ed. New York, Wiley.

Specific Absorbed Fractions for Radiation Sources Uni-

Evans, R. D. (1955). The Atomic Nucleus. New York,

formly Distributed in Various Organs of a Heterogeneous

McGraw-Hill.

Phantom. NM/MIRD Pamphlet 5, revised. New York,

Fox, R. A. (2002). Intravascular brachytherapy of the

Society of Nuclear Medicine.


coronary arteries. Phys. Med. Biol. 47: R1–R30.

Snyder, W. S., M. R. Ford, G. G. Warner, and H. L.

Fritzberg, A. R., and B. W. Wessels (1995). Therapeu-

Fisher (1969). Estimates of Absorbed Fractions for Mono-

tic radionuclides. In H. N. Wagner, Jr., Z. Szabo, and J.

energetic Photon Sources Uniformly Distributed in Var-

W. Buchanan, eds. Principles of Nuclear Medicine, 2nd

ious Organs of a Heterogeneous Phantom. NM/MIRD

ed. Philadelphia, Saunders, pp. 229–234.

Pamphlet 5. New York, Society of Nuclear Medicine.


Howell, R. W. (1992). Radiation spectra for Auger-

Snyder, W. S., M. R. Ford, G. G. Warner, and S.

emitting radionuclides: Report No. 2 of the AAPM Nu-

B. Watson (1975). S, Absorbed Dose per Unit Cumu-

clear Medicine Task Group No. 6. Med. Phys. 19(6):

lated Activity for Selected Radionuclides and Organs.

1371–1383.

NM/MIRD Pamphlet 11. New York, Society of Nuclear

Humm, J. L., R. W. Howell, and D. V. Rao (1994).

Medicine.


Dosimetry of Auger-electron-emitting radionuclides: Re-

Stabin, M. G., and L. C. Q. P. da Luz (2002). Decay

port No. 3 of the AAPM Nuclear Medicine Task Group

data for internal and external dose assessment. Health

No. 6. Med. Phys. 12(12): 1901–1915.

Phys. 83(4): 471–475.


Hunt J.G., F. C. da Silva and C. L. Mauricio (2004).

Stabin, M. G., R. B. Sparks, and E. Crowe (2005).

The validation of organ dose calculations using voxel sim-

OLINDA/EXM: The second-generation personal com-

ulators and Monte Carlo methods applied to point and

puter software for internal dose assessment in nuclear

water immersion sources. Rad. Prot. Dosimetry 108(1):

medicine. J. Nucl. Med. 46(6): 1023–1027.


85–89.

Strother, S. C., J. R. Anderson, Jr., K. A. Schaper,

Kaluza, G. L.. and A. E. Raizner (2004). Brachyther-

J. J. Sidtis, J. S. Liow, R. P. Woods, and D. A. Rot-

apy for restenosis after stenting for coronary artery dis-

tenberg (1995). Principal component analysis and the

ease: its role in the drug-eluting stent era. Current Opin-

scaled subprofile model compared to intersubject averag-

ion in Cardiol. 19: 601–607.

ing and statistical parametric mapping: I. Functional con-

Kassis, A. I. (2004). The amazing world of Auger elec-

nectivity of the human motor system studied with 15O-

trons. Int. J. Rad. Biol., 80(11-12): 789–803.

water PET. J. Cerebral Blood Flow Metab. 15(5): 738–

Larsson, S. A. (1980). Gamma camera emission to-

753.


mography: Development and properties of a multisec-

Watson, E. E., M. G. Stabin, and J. A. Siegel

tional emission computed tomography system. Acta Ra-

(1993). MIRD formulation. Med. Phys. 20(2, Pt. 2): 511–

diol. (Suppl. 363).

514.


Links, J. M., and J. C. Engdahl (1995). Planar imaging.

Weber, D. A., K. F. Eckerman, L. T. Dillman,

Chapter 17 in H. N. Wagner, Jr., Z. Szabo, and J. W.

and J. C. Ryman (1989). MIRD: Radionuclide Data

Buchanan, eds. Principles of Nuclear Medicine, 2nd ed.

and Decay Schemes. New York, Society of Nuclear

Philadelphia, Saunders.

Medicine.


18

Magnetic Resonance Imaging

Magnetic resonance imaging (MRI) (formerly called nuclear magnetic resonance imaging) provides very-high- resolution images without ionizing radiation. There is also the potential for more elaborate imaging, including flow, di usion, and the signature of particular atomic environments.

Magnetic resonance phenomena are more complicated than x-ray attenuation or photon emission by a radioactive nucleus. MRI depends upon the behavior of atomic nuclei in a magnetic field, in particular, the orientation and motion of the nuclear magnetic moment in the field. The patient is placed in a strong static magnetic field (typically 1–4 T). This is usually provided by a hollow cylindrical (solenoidal) magnet, though some machines use other configurations so that the physician can carry out procedures on the patient while viewing the MRI image. Other coils apply time-varying spatial gradients to the magnetic field, along with radio-frequency signals that cause the magnetization changes described below. Still other coils detect the very weak radio-frequency signals resulting from these changes.

First, we must understand the property that we are measuring. Section 18.1 describes the behavior of a magnetic moment in a static magnetic field, and Sec. 18.2 shows how the nuclear spin is related to the magnetic moment. Section 18.3 introduces the concept of the magnetization vector, which is the magnetic moment per unit volume, while Sec. 18.4 develops the equations of motion for the magnetic moment. In order to describe the motion of the magnetization, it is convenient—in fact, almost essential—to use the rotating coordinate system described in section 18.5.

To make a measurement, the nuclear magnetic moments originally aligned with the static magnetic field are made to rotate or precess in a plane perpendicular to the static field, after which the magnetization gradually returns to its original value. This relaxation phenomenon

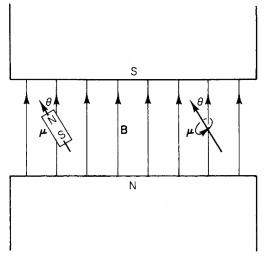
FIGURE 18.1. A magnetic dipole in a magnetic field. The dipole can be either a bar magnet or a current loop.

is described in Sec. 18.6. Sections 18.7 and 18.8 describe ways in which the magnetization can be manipulated for measurement or imaging.

Imaging techniques are finally introduced in Sec. 18.9. Sections 18.10 and 18.11 describe how chemical shifts and blood flow can a ect the image or can themselves be imaged. The last two sections describe functional MRI (fMRI) and di usion e ects.

18.1Magnetic Moments in an External Magnetic Field

Magnetic resonance imaging detects the magnetic dipoles in the nuclei of atoms in the human body. We saw in Chapter 8 that isolated magnetic monopoles have never

516 18. Magnetic Resonance Imaging

been observed [see Eq. 8.6], and that magnetic fields are produced by moving charges or electric currents. In some cases, such as bar magnets, the external field is the same as if there were magnetic charges occurring in pairs or dipoles.1 The strength of a dipole is measured by its magnetic dipole moment µ. (In Chapter 8 the magnetic dipole moment was called m to avoid confusion with µ0. In this chapter we use µ to avoid confusion with the quantum number m and to be consistent with the literature in the field.) The magnetic dipole moment is analogous to the electric dipole moment of Chapter 7; however, it is produced by a movement of charge, such as charge moving in a circular path. The units of µ are J T1 or A m2. We saw that when a magnetic dipole is placed in a magnetic field as in Fig. 18.1, it is necessary to apply an external torque τ ext to keep it in equilibrium. This torque, which is required to cancel the torque exerted by the magnetic field, vanishes if the dipole is aligned with the field. The torque exerted on the dipole by the magnetic field B is

τ = µ × B

(18.1)

(This is Eq. 8.4.)

The potential energy of the dipole is the work that must be done by τ ext to change the dipole’s orientation in the magnetic field without changing any kinetic energy it might have. To increase angle θ by an amount requires that work be done on the dipole–magnetic field system. This work is the increase in potential energy of the system:

dU = µB sin θ dθ.

(18.2)

This can be integrated to give the change in potential energy when the angle changes from θ1 to θ2:

U (θ2) − U (θ1) = −µB(cos θ2 cos θ1).

If the energy is considered to be zero when the dipole is at right angles to B, then the potential energy is

U (θ) = −µB cos θ = −µ · B.

(18.3)

In many cases the moving charges that give rise to the magnetic moment of an object possess angular momentum L. Often the magnetic moment is parallel to and proportional to the angular momentum: µ = γ L. The proportionality factor γ is called the gyromagnetic ratio (sometimes called the magnetogyric ratio). When such an object is placed in a uniform magnetic field, the resulting motion can be quite complicated. The torque on the object is τ = µ × B = γ L × B. It is not di cult to show (Problem 1) that the torque is the rate of change of the

1Dipoles can be arranged so that their fields nearly cancel, giving rise to still higher order moments such as the quadrupole moment or the octupole moment. (See Chapter 7). A configuration for which the quadrupole moment is important is two magnets in a line arranged as N-S-S-N.

FIGURE 18.2. A particle of charge q and mass m travels in a circular orbit. It has a magnetic moment µ and angular momentum L. If the charge is positive, µ and L are parallel; if it is negative they are in opposite directions.

angular momentum, τ = dL/dt. Therefore the equation of motion is

γ(L × B) =


dL


(18.4a)


dt

or


γ(µ × B) =

(18.4b)


.


dt

Solutions to these equations are discussed in Sec. 18.4.

18.2The Source of the Magnetic Moment

Atomic electrons and the protons and neutrons in the atomic nucleus can possess both angular momentum and a magnetic moment. The magnetic moment of a particle is related to its angular momentum. We can derive this relationship for a charged particle moving in a circular orbit. We saw in Chapter 8 that the magnitude of the magnetic moment of a current loop is the product of the current i and the area of the loop S:

|µ| = µ = iS.

(18.5)

The direction of the vector is perpendicular to the plane of the loop. Its direction is defined by a right-hand rule: curl the fingers of your right hand in the direction of current flow and your thumb will point in the direction of µ (see the right-hand part of Fig. 18.1). This is the same right-hand rule that relates the circular motion of a particle to the direction of its angular momentum.

Suppose that a particle of charge q and mass m moves in a circular orbit of radius r as in Fig. 18.2. The speed is v and the magnitude of the angular momentum is L = mvr. The e ective current is the charge q multiplied by the number of times it goes past a given point on the circumference of the orbit in one second: i = qv/2πr. The magnetic moment has magnitude µ = iS = iπr2 = qvr/2. Since the angular momentum is L = mvr and µ and L are both perpendicular to the plane of the orbit, we can

write


q


µ =


L = γ L.

(18.6)

2m

TABLE 18.1. Values of the spin and gyromagnetic ratio for a free electron and various nuclei of interest.


γ = ωLarmor/B


Particle

Spin

(s1 T1)


ν/B (MHz T1)

Electron

1

1.7608 ×

10

11

2.8025 × 10

4

2


Proton

1

2.6753 ×

10

8

42.5781


2


Neutron

1

1.8326 ×

10

8

29.1667


2


23

Na

3

0.7076 ×

10

8

11.2618


2


31

P

1

1.0829 ×

10

8

17.2349


2


The quantity γ = q/2m is the gyromagnetic ratio for this system. The units γ of are T1 s1 (see Problem 2). The magnetic moment and the orbital angular momentum are parallel for a positive charge and antiparallel for a negative charge.

An electron or a proton also has an intrinsic magnetic moment quite separate from its orbital motion. It is associated with and proportional to the intrinsic or “spin” angular momentum S of the particle. We write

µ = γ S.

(18.7)

The value of γ for a spin is not equal to q/2m.

Two kinds of spin measurements have biological importance. One is associated with electron magnetic moments and the other with the magnetic moments of nuclei. Most neutral atoms in their ground state have no magnetic moment due to the electrons. Exceptions are the transition elements that exhibit paramagnetism. Free radicals, which are often of biological interest, have an unpaired electron and therefore have a magnetic moment. In most cases this magnetic moment is due almost entirely to the spin of the unpaired electron.

Magnetic resonance imaging is based on the magnetic moments of atomic nuclei in the patient. The total angular momentum and magnetic moment of an atomic nucleus are due to the spins of the protons and neutrons, as well as any orbital angular momentum they have inside the nucleus. Table 18.1 lists the spin and gyromagnetic ratio of the electron and some nuclei of biological interest.

If the nuclear angular momentum is I with quantum

number I,

the possible

values of the z component of

I are m


,

where m =

−I, (−I + 1), ..., I.

For I =

1 ,


3

2

the values are 1/2 and 1/2, while for I =

2 they are

3/2, −1/2, 1/2 and 3/2. The direction of the external magnetic field defines the z axis, and the energy of a spin is given by −µ · B = −γ I · B = −γm B. The di erence between adjacent energy levels is γB , and the angular frequency of a photon corresponding to that di erence is

ωphoton = γB.

18.3 The Magnetization

517

18.3 The Magnetization

The MR image depends on the magnetization of the tissue. The magnetization of a sample, M, is the average magnetic moment per unit volume. In the absence of an external magnetic field to align the nuclear spins, the magnetization is zero. As an external magnetic field B is applied, the spins tend to align in spite of their thermal motion, and the magnetization increases, proportional at first to the external field. If the external field is strong enough, all of the nuclear magnetic moments are aligned, and the magnetization reaches its saturation value.

We can calculate how the magnetization depends on B. Consider a collection of spins of a single nuclear species in an external magnetic field. This might be the hydrogen nuclei (protons) in a sample. The spins do not interact with each other but are in thermal equilibrium with the surroundings, which are at temperature T . We do not consider the mechanism by which they reach thermal equilibrium. Since the magnetization is the average magnetic moment per unit volume, it is the number of spins per unit volume, N , times the average magnetic moment of each spin: M = N µ .

To obtain the average value of the z component of the magnetic moment, we must consider each possible value of quantum number m. We multiply the value of µz corresponding to each value of m by the probability that m has that value. Since the spins are in thermal equilibrium with the surroundings, the probability is proportional to the Boltzmann factor of Chapter 3, e(U/kB T ) = eγm B/kB T . The denominator in Eq. 18.8 normalizes the probability:


I


γ

m eγm B/kB T


µz =


m=−I

.

(18.8)


I

eγm B/kB T m=−I

At room temperature γI B/kB T 1 (see Problem 4), and it is possible to make the approximation ex 1 + x. The sum in the numerator then has two terms:

I

γ B

I

m +

m2.

kB T

m=−I

m=−I


The first sum vanishes. The second is I(I + 1)(2I + 1)/3. The denominator is

I


γ B

I


1 +


m.

kB T

m=−I


m=−I


The first term is 2I + 1; the second vanishes. Therefore we obtain

µz =

γ2

2I(I + 1)

B.

(18.9)


3kB T

The z component of M is


Mz = N µz =

N γ2 2I(I + 1)

(18.10)


B,


3kB T


which is proportional to the applied field.

518 18. Magnetic Resonance Imaging

z

B

M = γ (M X B) ∆t M

y

x

FIGURE 18.3. The system with initial magnetization M has been given just enough additional angular momentum to precess about the direction of the static magnetic field B. The rate of change of M is perpendicular to both M and B. For short time intervals, ∆M = γ(M × B) ∆t.

18.4Behavior of the Magnetization Vector

A remarkable result of quantum mechanics is that the average or expectation value of a spin obeys the classical Equation 18.4b:

dt


×


d µ

= γ ( µ


B)

(18.11)


whether or not B is time dependent [Slichter (1978), p. 20]. Multiplying by the number of spins per unit volume we obtain

dM

= γ (M × B) .

(18.12)

dt

This equation can lead to many di erent behaviors of M, some of which are quite complicated.

The simplest motion occurs if M is parallel to B, in which case M does not change because there is no torque. Another relatively simple motion, called precession, is shown in Figure 18.3. With the proper initial conditions M (and µ ) precess about the direction of B. That is, they both rotate about the direction of B with a constant angular velocity and at a fixed angle θ with the direction of B. Since M ×B is always at right angles to M, dM/dt is at right angles to M, and the angular momentum does not change magnitude. The analytic solution can be investigated by writing Eq. 18.12 in Cartesian coordinates when B is along the z axis:

dMx = γMy Bz , dt

dMy = −γMxBz , (18.13) dt

dMz = 0. dt

FIGURE 18.4. If several spins precess in the xy plane at slightly di erent rates, the total spin amplitude decreases due to dephasing.

One possible solution to these equations is


Mz = M = const,


Mx = M cos(−ωt),

(18.14)

My = M sin(−ωt).

You can verify that these are a solution for arbitrary values of M and M as long as ω = ω0 = γBz . This is called the Larmor precession frequency. The minus sign means that for positive γ the rotation is clockwise in the xy plane. The classical Larmor frequency is equal to the frequency of photons corresponding to the energy di erence given by successive values of µ · B. For this solution the initial values of M at t = 0 are Mx(0) = M , My (0) = 0, and Mz (0) = M .

We need to modify the equation of motion, Eq. 18.12, to include changes in M that occur because of e ects other than the magnetic field. Suppose that M has somehow been changed so that it no longer points along the z axis with the equilibrium value given by Eq. 18.10. Thermal agitation will change the populations of the levels so that Mz returns to the equilibrium value, which we call M0. We postulate that the rate of exchange of energy with the reservoir is proportional to how far the value of Mz is from equilibrium:

dMz = 1 (M0 − Mz ) . dt T1

The quantity T1, which is the inverse of the proportionality constant, is called the longitudinal relaxation time or spin–lattice relaxation time.

We also postulate an exponential disappearance of the x and y components of M with a transverse relaxation time T2 (sometimes called the spin–spin relaxation time). (This assumption is often not a good one. For example, the decay of Mx and My in ice is more nearly Gaussian than exponential.) The equations are

dMx

=

Mx

,

dMy

=

My


.

dt

T2

dt

T2

The transverse relaxation time is always shorter than T1. Here is why. A change of Mz requires an exchange of energy with the reservoir. This is not necessary for changes confined to the xy plane, since the potential energy (µ · B) does not change in that case. Mx and My can change as Mz changes, but they can also change by

other mechanisms, such as when individual spins precess at slightly di erent frequencies, a process known as dephasing. The angular velocity of precession can be slightly di erent for di erent nuclear spins because of local variations in the static magnetic field; the angular velocity can also fluctuate as the field fluctuates with time. These variations and fluctuations are caused by neighboring atomic or nuclear magnetic moments or by inhomogeneities in the external magnetic field. Figure 18.4 shows how dephasing occurs if several magnetic moments precess at di erent rates.

Combining these approximate equations for relaxation in the absence of an applied magnetic field with Eq. 18.12 for the e ect of a magnetic field gives the Bloch equations:2

dMz


=


1

(M0 − Mz ) + γ (M × B)z

,

dt


T1


dMx


=

Mx

+ γ (M × B)x ,

(18.15)


dt


T2


dMy


My


=


+ γ (M × B)y .


dt


T2


While these equations are not rigorous and there is no reason for the relaxation to be strictly exponential, they have proven to be quite useful in explaining many facets of nuclear spin magnetic resonance.

One can demonstrate by direct substitution the following solution to Eqs. 18.15 for a static magnetic field B along the z axis:

Mx = M0e−t/T2 cos(−ω0t),

(18.16)

My = M0e−t/T2 sin(−ω0t),

Mz = M0(1 − e−t/T1 ),


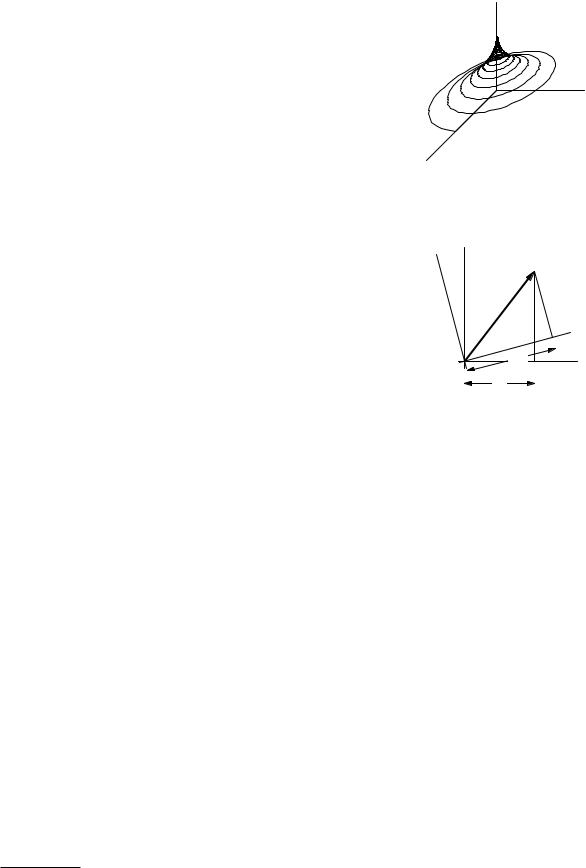
where ω0 = γB. This solution corresponds to what happens if M is somehow made to precess in the xy plane. (We will see how to accomplish this in Sec. 18.5.) The magnetization in the xy plane is initially M0, and the amplitude decays exponentially with time constant T2. The initial value of Mz is zero, and it decays back to M0 with time constant T1. A perspective plot of the trajectory of the tip of vector M is shown in Fig. 18.5.

18.5 A Rotating Coordinate System

18.5.1Transforming to the Rotating Coordinate System

It is much easier to describe the motion of M in a coordinate system that is rotating about the z axis at the Larmor frequency. Figure 18.6 shows a vector M and two

2Felix Bloch and Edward Purcell shared the 1952 Nobel Prize in Physics for their discovery of nuclear magnetic resonance.

18.5 A Rotating Coordinate System

519

z

y

x

FIGURE 18.5. The locus of the tip of the magnetization M when it relaxes according to Eqs. 18.16.

y

y'


M

θ

My'


My

x'

θ

Mx'

x

Mx

FIGURE 18.6. The vector M can be represented by components along x and y or along x and y .

coordinate systems, xy and x y . The z component of M is unchanged. By considering the other components in Fig. 18.6, we see that

Mx = Mx cos θ − My sin θ,

My = Mx sin θ + My cos θ

(18.17a)

Mz = Mz .

This can also be written in matrix form. A rotation through angle θ around the z axis gives

Mx


cos θ

sin θ

0

Mx


M = My

= sin θ

cos θ

0 My

= RM .

Mz


0

0

1

Mz


(18.17b) Rotations about the other axes are discussed in Problem 12. Note that rotating the coordinate system that describes a fixed vector is equivalent to rotating the vector in the opposite direction, so the results quoted in Problem 12 apply to both situations.

For a three-dimensional coordinate system rotating clockwise around the z axis, θ = −ωt, the z-component of M is unchanged, and the transformation equations are

Mx = Mx cos(−ωt) − My sin(−ωt),

ωt),

(18.18)

My = Mx sin( ωt) + My cos(


Mz = Mz .

520 18. Magnetic Resonance Imaging

The time derivative of M is obtained by di erentiating each component and remembering that M can also depend on t:


dMx


dMx


dMy


=


cos(−ωt)


sin(−ωt)


dt


dt


dt


+ ωMx


sin( ωt) + ωMy cos( ωt),


dMy

=


dMx

sin(−ωt) +

dMy

cos(−ωt) (18.19)

dt


dt

dt


ωMx

cos(

ωt) + ωMy

sin(

ωt),


dMz

=

dMz

.


dt

dt


We can use these expressions to write the equations of motion in the rotating frame. First consider a system without relaxation e ects and with a static field Bz along the z axis. We will show that the components of M in a system rotating at the Larmor frequency are constant. The equations of motion are given in Eqs. 18.13. In terms of variables in the rotating frame, the equation

for dMx/dt becomes


dMx

dMy


cos(−ωt)


sin(−ωt)


dt

dt

+ωMx sin(−ωt) + ωMy cos(−ωt)

=γ [Mx sin(−ωt) + My cos(−ωt)] Bz .

If the frame rotates at the Larmor frequency ω0 = γBz , the third and fourth terms on the left are equal to the right-hand side. The equation becomes

dMx

dMy


cos(−ω0t)


sin(−ω0t) = 0.

dt

dt

Under the same circumstances, the equation for dMy /dt gives

dMx

dMy


sin(−ω0t) +


cos(−ω0t) = 0.

dt

dt

Solving these simultaneously shows that dMx /dt = 0 and dMy /dt = 0. Therefore in the rotating system Mx and My are constant. Equation 18.13 showed that Mz is constant, so the components of M are constant in the frame rotating at the Larmor frequency. Using Eqs. 18.18 to transform back to the laboratory system gives the solution Eq. 18.14.3

3For those familiar with vector analysis, the general relationship between the time derivative of any vector M in the laboratory system and a system rotating with angular velocity Ω is

dM


M


=


+ Ω × M.


dt

lab

∂t


rot

This can be applied to the magnetization combined with Eq. 18.12 to give

M


= γ(M × B) × M = γM ×

B +


,


∂t

γ


rot


which vanishes if γB = Ω.

18.5.2An Additional Oscillating Field

The next problem we consider in the rotating coordinate system is the addition of an oscillating magnetic field B1 cos(ωt) along the x axis, fixed in the laboratory system. We will show that if the applied field is at the Larmor frequency, the equations of motion in the rotating system, Eqs. 18.25, are quite simple but very important. They are given below.

They are derived as follows. From the x component of Eq. 18.12,

dMx = γ(My Bz − Mz By ), dt

we obtain (remembering that the x y system is rotating at the Larmor frequency ω0)

dMx

cos(

ω0t)

dMy

sin(

ω0t) + ω0Mx sin( ω0t)

dt

dt


+ω0My cos(−ω0t)

=γBz [Mx sin(−ω0t) + My cos(−ω0t)] .

Since ω0 = γBz , the last two terms on the left cancel the terms on the right, leaving


dMx


dMy


cos(−ω0t)


sin(−ω0t) = 0. (18.20)


dt

dt

Similarly, the y-component of Eq. 18.12,


dMy

= γ(Mz Bx − MxBz ),


dt

transforms and reduces to (remembering that Mz = Mz )


dMx

sin(

ω0t) +

dMy

cos(

ω0t) = γB1Mz cos( ωt).


dt


dt


(18.21)

The z-component of Eq. 18.12 is


dMz


= γ(MxBy − My Bx),

(18.22)


dt


which transforms to

dMz

dt

= −γB1Mx cos(ωt) sin(−ω0t)

− γB1My cos(ωt) cos(−ω0t).

It is possible to eliminate Mx from Eqs. 18.20 and 18.21 by multiplying Eq. 18.20 by sin(−ω0t), multiplying Eq. 18.21 by cos(−ω0t), and adding. The result is

dMy


dt = γB1Mz cos(ωt) cos(−ω0t).

(18.23)

A similar technique can be used to eliminate My from these two equations:

dMx

= γB1Mz cos(ωt) sin(

ω0t).

(18.24)

dt


18.5.3 Nutation

Equations 18.22–18.24 are the equations of motion for the components of M in the rotating system. If ω =ω0, the motion is complicated, but averaged over many Larmor periods the right-hand side of each equation is zero. If the applied field oscillates at the Larmor frequency, ω = ω0, then the cos2(−ω0t) factors average to 12 while factors like sin(−ω0t) cos(−ω0t) average to zero.

The averaged equations are a very important result:


dMx


= 0,


(18.25a)


dt


dMy

=

γB1

Mz ,

(18.25b)


dt


2


dMz


=

γB1


My .

(18.25c)


dt

2


The first equation says that if Mx is initially zero, it remains zero. Let us define a new angular frequency

ω1 =

γB1

.

(18.26)

2


18.5 A Rotating Coordinate System

521

z'

z


Mz'


Nutation


Relaxation


y'

y

(M x'2 + M 2y' )1/ 2

x'

x

(c)

(a)

(b)

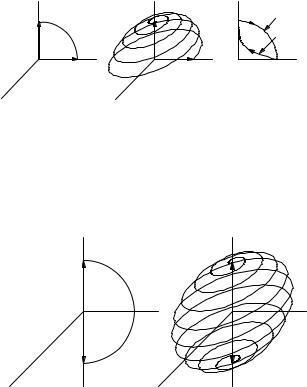
FIGURE 18.7. The locus of the tip of the magnetization M when an oscillating magnetic field B1 is applied for a time t such that ω1t = π/2. This is often called a “π/2” pulse. (a) The rotating frame. (b) The laboratory frame. (c) Plots of Mz vs (Mx2 +My2 )1/2 showing the di erence between nutation and relaxation.

z'

z

y'

y

It is the frequency of nutation or rotation caused by B1 oscillating at the Larmor frequency. It is much lower than the Larmor frequency because B1 Bz . In terms of ω1, Eqs. 18.25b and 18.25c become

dMz

dMy


= −ω1My ,


= ω1Mz .

dt

dt

These are a pair of coupled linear di erential equations with constant coe cients. Di erentiating one and substituting it in the other gives

d2Mz


dMy

2


= −ω1


= −ω1 Mz ,

(18.27)

dt2

dt

which has a solution (a and b are constants of integration)

Mz = a sin(ω1t) + b cos(ω1t).

(18.28)

From Eq. 18.25c we get


1 dMz


My =


= −a cos(ω1t) + b sin(ω1t).

(18.29)

ω1

dt

The values of a and b are determined from the initial conditions. For example, if M is initially along the z axis,

a = 0 and b = M0. Then


Mx = 0,


My = M0 sin(ω1t),

(18.30)

Mz = M0 cos(ω1t).


This kind of motion—precession about the z axis combined with a change of the projection of M on z—is called nutation.

x'

x

(a)

(b)

FIGURE 18.8. A “π pulse.” B1 is applied for a time t = π/ω1 and rotates M to point along the −z axis. (a) The rotating frame. (b) The laboratory frame.

18.5.4π and π/2 Pulses

From Eqs. 18.30 it is easy to see that turning B1 on for a quarter of a period of ω1 (a 90 pulse or π/2 pulse, t = T /4 = π/2ω1) nutates M into the x y plane, while a 180 or π pulse nutates M to point along the −z axis. M nutates about the rotating x axis. Shifting the phase of B1 changes the axis in the x y plane about which M nutates. It may seem strange that an oscillating magnetic field pointing along an axis fixed in the laboratory frame causes rotation about an axis in the rotating frame. The reason is that B1 is also oscillating at the Larmor frequency, so that its amplitude changes in just the right way to cause this behavior of M. Figures 18.7 and 18.8 show this nutation in both the rotating frame and the laboratory frame for a π/2 pulse and a π pulse.

Figure 18.7(c) emphasizes the di erence between nutation and relaxation by plotting Mz vs the projection of M in the x y plane. For nutation the components of M are given by Eqs. 18.30, the magnitude of M is unchanged, and the locus is a circle. For relaxation the components are given by Eqs. 18.16.

Another interesting solution is one for which the initial value of M is

Mx (0) = M0 cos α, My (0) = M0 sin α,

522

18. Magnetic Resonance Imaging


z'

z


Br


y'

y

θ


r

Bθ


µ


x'

x


(a)

(b)


FIGURE 18.9. A magnetic field B1 pointing along the laboratory x axis and oscillating at the Larmor frequency causes nutation of M through an angle π around the rotating x axis. In this case M was initially in the x y plane. The motion shown here is plotted from Eqs. 18.30 in (a) the rotating and (b) the laboratory frames.

Mz (0) = 0.

This corresponds to an M that has already been nutated into the x y plane. Substituting these values in Eqs. 18.28 and 18.29 shows that b = 0 and a = M0 sin α. Then the solution is

Mx (t) = M0 cos α,

My (t) = M0 sin α cos(ω1t),

(18.31)

Mz (t) = −M0 sin α sin(ω1t).

This solution is plotted in Fig. 18.9 in both the rotating frame and the laboratory frame for the case of a π pulse (a pulse of duration π/ω1). The e ect is to nutate M about the x axis in the rotating coordinate system. We will see later that this is a very useful pulse.

18.6 Relaxation Times

Since longitudinal relaxation changes the value of Mz and hence µ · B, it is associated with a change of energy of the nucleus. The principal force that can do work on the nuclear spin and change its energy arises from the fact that the nucleus is in a fluctuating magnetic field due to neighboring nuclei and the electrons in paramagnetic atoms.

One way to analyze the e ect of this magnetic field is to say that the change of spin energy E is accompanied by the emission or absorption of a photon of frequency νphoton = E/h, or ωphoton = ω0. An increase of spin energy requires the absorption of a photon at the Larmor frequency (stimulated absorption). This will have a high probability if the fluctuating magnetic field has a large Fourier component at the Larmor frequency. A decrease of spin energy is accompanied by the emission of a photon. This can happen spontaneously in a vacuum (spontaneous emission), or it can be stimulated by the presence of other photons at the Larmor frequency (stimu-

FIGURE 18.10. The magnetic field components of a dipole in spherical coordinates point in the directions shown.

lated emission). These relative probabilities can be calculated using quantum mechanics. Stimulated emission or absorption is much more probable than is spontaneous emission.

The random magnetic field at a nucleus fluctuates because of the movement of the nucleus in the magnetic field of nearby atoms and nuclei. If the field changes rapidly enough, it will have Fourier components at the Larmor frequency that can induce transitions that cause Mz to change by absorption or stimulated emission. To get an idea of the strength of the field involved, consider the field at one hydrogen nucleus in a water molecule due to the other hydrogen nucleus. The field due to a magnetic dipole is given by

Br =


µ0


2µ

cos θ,


4π r3


Bθ =


µ0


µ


sin θ,

(18.32)

4π r3


Bφ = 0,


where angle θ is defined

in

Fig. 18.10. (The

factor

µ0/4π ≡ 107 T m A1 is required in SI units.) The magnetic field at one hydrogen nucleus in a water molecule due to the other hydrogen nucleus is about (3 4) ×104 T (see Problem 14). Consider the water molecule shown in Fig. 18.11. We refer to each hydrogen nucleus as a proton. The z components of the proton magnetic moments are shown. If the water molecule is oriented as in Fig. 18.11(a), the field at one proton due to the other has a certain value. If the water molecule remains fixed in space, as in ice, the field is constant with time. If the molecule is tumbling as in liquid water, the orientation changes as in Fig. 18.11(b), and the field changes with time.

When the molecules are moving randomly, the fluctuating magnetic field components are best described by their autocorrelation functions. The simplest assumption one can make4 is that the autocorrelation function φ11

4A more complete model recognizes that di erent atoms experience fluctuating fields with di erent correlation times and that frequency components at twice the Larmor frequency also contribute.