

Intermediate Physics for Medicine and Biology - Russell K. Hobbie & Bradley J. Roth
.pdf370 14. Atoms and Light
14.6.2 Optical Coherence Tomography (OCT)
Optical range measurements using the time delay of reflected or backscattered light from pulses of a few femtosecond (10−15 s) duration can be used to produce images similar to those of ultrasound A- and B-mode scans. The spatial extent of a 30 fs pulse in water is about 7 µm. Since it is di cult to measure time intervals that short, most measurements are done using interference properties of the light. Optical coherence tomography is conceptually similar to range measurements but uses interference measurements. It was first demonstrated by Huang et al. (1991) and has been developed extensively since then [see Schmitt (1999) or Bouma and Tearney (2002)].
This is one topic for which we must use the electromagnetic wave model for light, since it depends on interference e ects. Light waves di er from sound waves because the electric field in the wave is a vector perpendicular to the direction of propagation of the wave. This gives rise to an important e ect—polarization—that we ignore.
Suppose that a wave A sin 2λπ (x−cnt) = A sin ω(x/cn − t) travels in a medium with index of refraction n. A detector responds to the energy fluence in the wave, which is proportional to the square of the amplitude averaged over
time. The signal is y A2sin2 ω(x/cn − t) = A2/2. The wave is split, travels two paths of di erent lengths, and is recombined at a detector. The signal is proportional to the power averaged over many cycles of the wave. The power is proportional to the square of the electric field:
y (A/2)2[sin ω(x1/cn − t) + sin ω(x2/cn − t)]2
= |
A2 |
1 + cos |
ω |
(x2 − x1) |
|
(14.30) |
|
|
|
|
. |
||||
4 |
|
cn |
|||||
The signal oscillates between 0 and A2/2 as the di erence in path length is changed. When the path di erence is zero, y A2/2, our original result. This dependence of the signal on path length forms the basis for interferometry, which can be used to measure changes in distance with high accuracy—counting maxima (fringes) as one path length is varied.
An important consideration is the coherence of the light beam: the number of cycles over which the phase of the wave does not change. When an atom emits light, the classical electromagnetic wave lasts for a finite time, τcoh (often around 10−8 s). When another atom emits light, the phase is unrelated to the phase of light already emitted. This means that if (x2 − x1) /cn > τcoh, the time average will go to zero.
Note that as long as light from a single source has been split and then recombined, the paths can be quite long. The interference fringes will be seen when the light is recombined and the path di erence satisfies
x2 − x1 < cnτcoh. |
(14.31) |
This provides a technique for determining the distance of a reflecting object from the light source, forming the basis
Low-coherence
Light Source
|
|
Reference |
|
|
Mirror for |
Fiber-optic |
|
Axial (z) |
|
Scanning |
|
Beam Splitter |
|
|
|
|
Oscillating Mirror for |
|
|
Transverse (xy) |
|
|
Scanning |
Detector
Signal
Processing
and Display
Sample
FIGURE 14.15. The basic apparatus for optical coherence tomography. The features are described in the text.
FIGURE 14.16. An optical coherence tomogram of the anterior eye. From J. A. Izatt, M. R. Hee, E. A. Swanson, C. P. Lin, D. Huang, J. S. Schuman, C. A. Puliafito, and J. G. Fujimoto. Micrometer-scale resolution imaging of the anterior eye with optical coherence tomography. Archives of Ophthalmology 112: 1584–1589 (1994). Copyright c 1994 American Medical Association. All rights reserved.
for optical coherence tomography. A light source with a short coherence time is used for high resolution. The basic apparatus is shown in Fig. 14.15. Various light sources are used [Bouma and Tearney (2002)]. The light pulse travels over an optical fiber to a 50/50 beam splitter. Part travels to the sample, where it is reflected back to the 50/50 coupler and then to the detector. The other half of the light goes to the reference mirror, where it is also reflected back to the detector. Changing the position of the reference mirror changes the depth of the image plane in the sample. The lateral beam position is changed to scan the sample, as in an ultrasound B-mode scan. Figure 14.16 shows an image of the anterior eye.
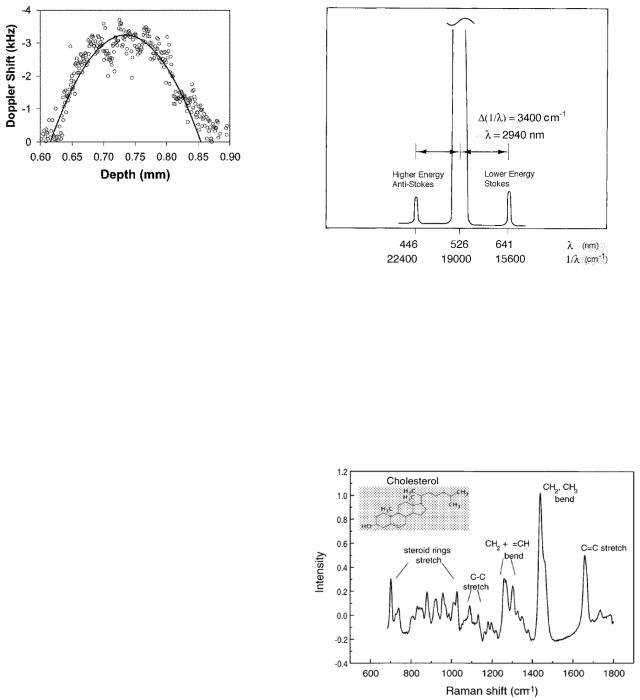
It is possible to make many kinds of images. Fig. 14.17 shows the parabolic velocity profile of blood flowing in a blood vessel in the retina of 176 µm diameter. It was obtained by measuring the Doppler shift in light scattered from moving blood cells. It is also possible to image
14.6 Biological Applications of Infrared Scattering |
371 |
FIGURE 14.17. The parabolic velocity profile of blood flowing in a single retinal vessel of diameter 176 µm. From S. Yazdanfar, A.M. Rollins, and J. A. Izatt. Imaging and velocimetry of the human retinal circulation with color Doppler optical coherence tomography. Optics Letters 25(19): 1448–1450 (2000). Used by permission.
glucose concentration, because glucose modifies the index of refraction and thereby the scattering coe cient [Esenaliev et al. (2001)]. Images are made of the surface layers of the skin, the eye, the walls of the mouth, teeth, larynx, esophagus, stomach, and intestine.
A number of tissues exhibit birefringence–the speed of light in the skin depends on the orientation of the electric field vector of the light wave with the cells in the tissue [De Boer et al. (2002)]. It is possible to make images with di erent orientations of the electric field vector to improve the resolution [Yasuno et al. (2002)].
There are a number of o shoots to OCT, such as optical coherence microscopy and full-field OCM [SaintJalmes et al. (2002)].
FIGURE 14.18. In Raman scattering, a photon gains or loses energy due to a change in the energy of the scattering molecule. An idealized example for water is shown. The very intense line has no energy change; the weak lines are Raman scattering. The abscissa is shown as wavelength λ and as reduced wave number k/2π = 1/λ. The Raman shift corresponds to ∆(1/λ) = 3, 400 cm−1. The wavelength of this infrared transition is λ = 2, 940 nm, but the measurement is made near 500 nm.
14.6.3 Raman Spectroscopy
Infrared and microwave probes are used extensively in the laboratory. Since the vibrational and rotational levels depend on the masses, separations, and forces between the various atoms bound in a molecule, it is not surprising that spectroscopy can be used to identify specific bonds. This is a useful technique in chemistry. Biological applications are di cult because the absorption coe cients are large; thin samples must be used, particularly in an aqueous environment.
One way around this is Raman scattering. Raman scattering is the scattering of light in which the scattered photon does not have its original energy, but has lost or gained energy corresponding to a rotational or vibrational transition. The e ect was discovered by C. V. Raman in 1928. Raman scattering can be done with light of any wavelength, from infrared to ultraviolet. An idealized example is shown in Fig. 14.18. If the scattering molecule was originally in the vibrational ground state and returns to a vibrational excited state, the Raman-scattered photon has less energy than the original photon. This is called
FIGURE 14.19. Vibrational Raman lines for cholesterol. A continuous background has been subtracted. The abscissa is 1/λ = E/hc. From Hanlon, E. B., R. Manoharan, T-W. Koo, K. E. Shafer, J. T. Motz, M. Fitzmaurice, J. R. Kramer, I. Itzkan, R. R. Dasari, and M. S. Feld (2000). Prospects for in vivo Raman spectroscopy. Phys. Med. Biol. 45: R1–R59. Used by permission.
Stokes–Raman scattering. If the scattering molecule was originally in a higher vibrational state and returns to the vibrational ground state, the Raman-scattered photon has higher energy than the original. The intensity of
372 14. Atoms and Light
this Anti-Stokes–Raman line will be less than the intensity of the Stokes–Raman line because populations of the original vibrational levels are governed by a Boltzmann factor. Fig. 14.19 shows the Stokes–Raman shift spectrum for cholesterol. Many discussions of Raman spectroscopy are available. A fairly theoretical one by Berne and Pecora (1976) relies heavily on autocorrelation functions and spectral analysis that we saw in Chapter 11. Diem (1993) is a detailed text on vibrational spectroscopy, including Raman spectroscopy.
Raman spectroscopy has been used extensively for laboratory studies; many groups are exploring its utility for in vivo measurements [Hanlon et al. (2000)]. Infrared light between 800 and 1000 nm is usually used.
14.6.4 Far Infrared or Terahertz Radiation
For many years, there were no good sources or sensitive detectors for radiation between microwaves and the near infrared (0.1–100 THz; 1 THz = 1012 Hz). Developments in optoelectronics have solved both problems, and many investigators are exploring possible medical uses of THz radiation (“T rays”). Classical electromagnetic wave theory is needed to describe the interactions, and polarization (the orientation of the E vector of the propagating wave) is often important. The high attenuation of water in this frequency range means that studies are restricted to the skin or surface of organs such as the esophagus that can be examined endoscopically. Reviews are provided by Smye et al. (2001), Fitzgerald et al. (2002), and Zhang (2002).
14.7 Thermal Radiation
Any atomic gas emits light if it is heated to a few thousand kelvin. The light consists of a line spectrum. The famous yellow line of sodium has
λ= 589.2 nm,
ν= c/λ = 5.092 × 10¹⁴ Hz,
E = hν = hc/λ = 3.38 × 10⁻¹⁹ J = 2.11 eV.
These photons are emitted when sodium atoms lose 2.11 eV and return to their ground state. If the sodium atoms are excited by thermal collisions, the probability that a sodium atom is in the excited state, relative to the probability that it is in the ground state, is given by the Boltzmann factor
Pexcited = e−E/kB T . Pground
At room temperature kB T = 4.14 × 10⁻²¹ J, so e−E/kB T = e−81.5 = 3.8 ×10−36. The number of atoms in the excited state is utterly negligible. If the temperature is raised to 1500 K, e−E/kB T is 8 × 10⁻⁸, and enough
TABLE 14.3. Approximate color temperatures. The range of values reflects di erences between scales established by di erent observers.
Color |
T (K) |
Red, just visible in daylight |
750–800 |
“Cherry” red |
975–1175 |
Yellow |
1200–1505 |
White |
1425-1800 |
Dazzling (bluish) white |
1900 |
|
|
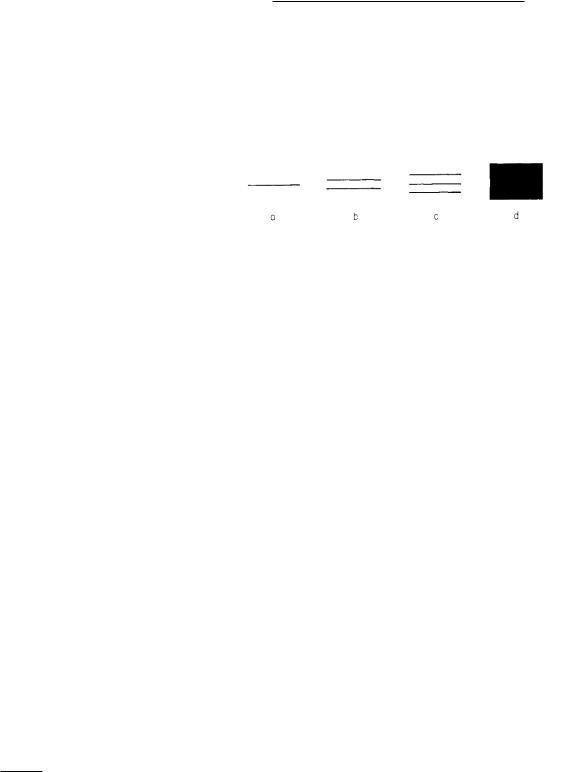
FIGURE 14.20. The splitting of energy levels as many atoms are brought together. (a) A single atom. (b) Two atoms. (c) Three atoms. (d) Many atoms.
atoms are excited to give o light as they fall back to the ground state.
If a piece of iron is heated to 1,500 K, it glows with a white–yellow color. Table 14.3 relates apparent color to temperature for a glowing metal. If the light is analyzed with a spectroscope, it is found to consist of a continuous range of colors rather than discrete lines.
The di erence between the spectra of single atoms and the spectra of solids and liquids can be understood from the following argument. If we have N isolated identical atoms, each atom has an energy level at the energy shown in Fig. 14.20(a). There are a total of N levels, one for each atom. When two of these atoms are brought close together, the levels shift slightly and split into two closely spaced levels because of interaction between the atoms. The two levels for a pair of atoms are shown in Fig. 14.20(b). If three atoms are brought close together the level splits into three levels as shown in Fig. 14.20(c). If a large number of atoms are brought close together, the N level spreads out into a band, Fig. 14.20(d). Transitions from one band to another can have many di erent energies, and photons with a continuous range of energies can be emitted or absorbed.
The relative number of photons of di erent energies that will be emitted or absorbed depends on the nature of the substance. Glass and sodium chloride crystals are nearly transparent in the visible spectrum because the spacing of the levels is such that no photons of these energies are absorbed. When such substances are heated enough to populate the higher energy levels, no photons of these energies are emitted.
A substance that has so many closely spaced levels that it can absorb every photon that strikes it appears black. It is called a blackbody. It is di cult if not impossible to
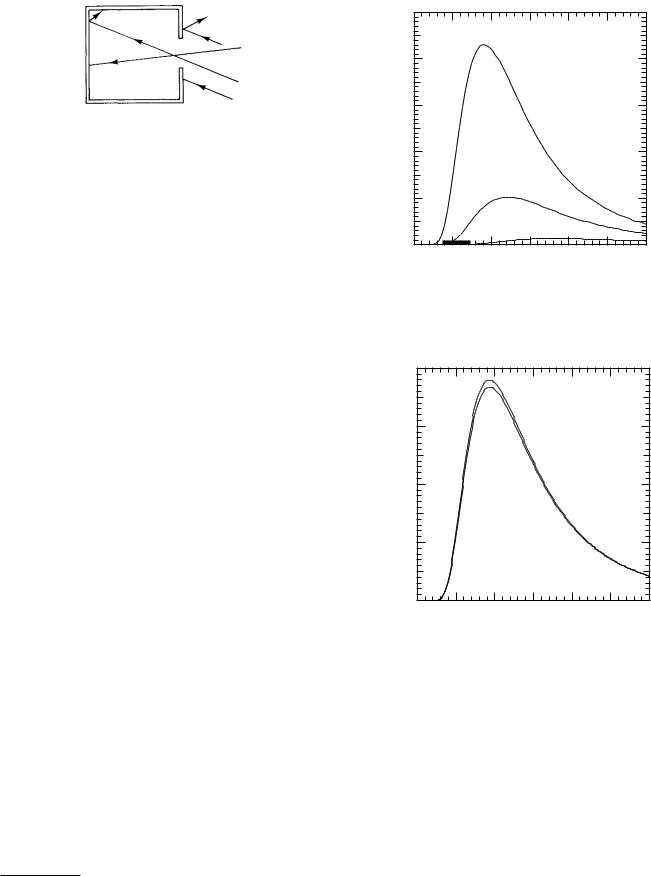
FIGURE 14.21. A small hole in the wall of a cavity is a better blackbody than the walls of the cavity are. Any light that enters the hole must be reflected several times before emerging. It can be absorbed by the wall at any reflection. If the walls appear black, the hole appears even blacker. (The walls are highly absorbing di use reflectors.)
make a surface that is completely absorbing; the absorption can be improved by making a cavity, as in Fig. 14.21. Photons entering the hole in the cavity bounce from the walls many times before chancing to pass out through the hole again, and they therefore have a greater chance of being absorbed. Such a hole in a cavity is a better approximation to a blackbody than is the absorbing material lining the cavity.
If the surface is not completely absorbing, we define the emissivity (λ), which is the fraction of light absorbed at wavelength λ. (Why emission and absorption are closely related is discussed below.) If the light all passes through some transparent material or is completely reflected, then= 0; if it is all absorbed, = 1. A blackbody has (λ) = 1 for all wavelengths. An object for which (λ) is constant but less than 1 is called a gray body.
When a blackbody is heated, the light given o has a continuous spectrum because the energy levels are so closely spaced. By imagining two di erent cavities in contact, one can argue9 that the amount of energy coming out of a blackbody cavity depends only on the temperature of the walls and not on the nature of the surfaces.
The spectrum of power per unit area emitted by a completely black surface in the wavelength interval between λ and λ + dλ is
Wλ(λ, T )dλ,
a universal function called the blackbody radiation function. It has units of W m−3, although it is often expressed as W cm−2 µm−1. The value of Wλ is plotted for several di erent temperatures in Fig. 14.22. As the black surface or cavity walls become hotter, the spectrum shifts toward shorter wavelengths, which is consistent with the observations in Table 14.3. The visible region of the spectrum is marked on the abscissa in Fig. 14.22; even at 1,600 K when the radiating surface appears white, most of the energy is radiated in the infrared.
Figure 14.23 plots Wλ(λ, T ) for two temperatures near body temperature (37 ◦C = 310 K). Compare the scales
9For a brief discussion see Halliday et al. (1992, p. 1021 ). A more detailed treatment is found in Bramson (1968, Chapter IV).
14.7 Thermal Radiation |
373 |
|
5x10¹² |
|
|
|
|
|
|
|
4 |
|
|
3200 K |
|
|
|
) |
3 |
|
|
|
|
|
|
-3 |
|
|
|
|
|
|
|
(W m |
|
|
|
|
|
|
|
λ |
|
|
|
|
|
|
|
W |
2 |
|
|
|
|
|
|
|
|
|
|
|
|
|
|
|
1 |
|
|
2400 K |
|
|
|
|
|
|
|
|
|
|
|
|
|
v |
|
1600 K |
|
|
|
|
0 |
0.5 |
1.0 |
1.5 |
2.0 |
2.5 |
3.0 |
|
0.0 |
||||||
|
|
|
|
λ (µm) |
|
|
|
FIGURE 14.22. The blackbody radiation function for several temperatures. The visible spectrum is marked by v.
|
40x106 |
|
|
|
|
|
|
|
|
|
|
T = 312 K |
|
|
|
|
30 |
|
|
|
|
|
|
) |
|
|
|
|
|
|
|
-3 |
|
|
T = 310 K |
|
|
|
|
m |
|
|
|
|
|
||
20 |
|
|
|
|
|
|
|
(W |
|
|
|
|
|
|
|
|
|
|
|
|
|
|
|
λ |
|
|
|
|
|
|
|
W |
|
|
|
|
|
|
|
|
10 |
|
|
|
|
|
|
|
0 |
5 |
10 |
15 |
20 |
25 |
30 |
|
0 |
||||||
|
|
|
|
λ (µm) |
|
|
|
FIGURE 14.23. The blackbody radiation function Wλ(λ, T ) |
|||||||
for T = 310 K and T = 312 K. |
|
|
|
|
|||
of Figs. 14.22 and 14.23, and note how much more energy is emitted by a blackbody at the higher temperature and how it is shifted to shorter wavelengths.
Much work was done on the properties of blackbody or thermal or cavity radiation in the late 1800s and early 1900s. While some properties could be explained by classical physics, others could not. The description of the function Wλ(λ, T ) by Planck is one of the foundations of quantum mechanics. We will not discuss the history of these developments, but will simply summarize the properties of the blackbody radiation function that are important to us.
374 14. Atoms and Light
2x10¹⁵ |
|
|
|
|
|
|
|
|
|
|
1.5 |
|
|
|
|
|
|
|
|
ν |
1 |
|
|
|
|
ν |
|
|
|
|
.5 |
|
|
|
|
|
|
|
|
|
0 |
5 |
10 |
15 |
20x10-9 |
|
λ |
|
|
|
0 |
|
|
||||||
|
|
W (ν,T) (W s m-2) |
|
5x10¹² |
|
|
|
||
|
|
|
ν |
|
|
|
|
|
|
|
|
|
|
|
|
4 |
|
|
|
|
|
|
|
|
) |
|
|
T = 3200 K |
|
|
|
|
|
|
-3 |
|
|
|
|
|
|
|
|
|
m |
3 |
|
|
|
|
|
|
|
|
(W |
|
|
|
|
|
|
|
|
|
|
|
|
|
|
|
|
|
|
|
(λ,T) |
2 |
|
|
|
|
|
|
|
|
λ |
|
|
|
|
|
|
|
|
|
W |
|
|
|
|
|
|
|
|
|
|
1 |
|
|
|
|
|
|
|
|
|
0 |
1.0 |
2.0 |
3.0 |
|
|
|
|
|
|
0.0 |
|||
|
|
|
|
|
|
|
|
λ (µm) |
|
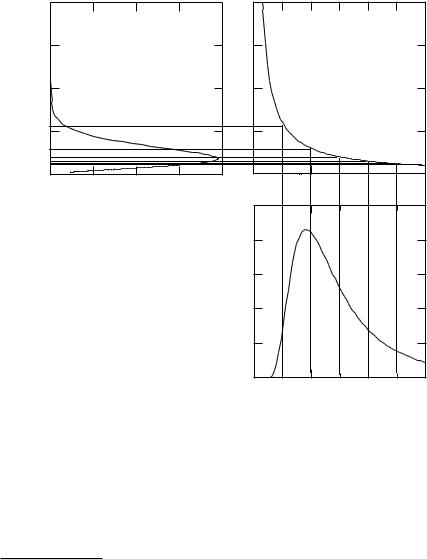
FIGURE 14.24. The transformation from Wλ(λ, T ) to Wν (ν, T ) is such that the same amount of power per unit area is emitted in wavelength interval (λ, dλ) and the corresponding frequency interval (ν, dν). The spectrum shown is for a blackbody at 5,800 K, approximately the spectrum of sunlight.
The value of Wλ(λ, T ) is given by
2πc2h
Wλ(λ, T ) = λ5 ehc/λkB T − 1 .
known empirically before Planck’s work. It has the numerical value
(14.32) |
(14.34) |
σSB = 5.67 × 10⁻⁸ W m−2 K−4. |
Consider the expression ehc/λkB T in the denominator. Since light consists of photons of energy E = hν = hc/λ, the factor in parentheses in the denominator is eE/kB T −1. For very large energies (short wavelengths) the 1 can be neglected and the e ect of the denominator on Eq. 14.32 is like a Boltzmann factor.
We can find the total amount of power emitted per unit surface area by integrating10 Eq. 14.32:
∞
Wtot(T ) = Wλ(λ, T ) dλ
0
Early measurements of the radiation function were done with equipment that made measurements vs. wavelength. It is also possible to measure vs. frequency. To rewrite the radiation function in terms of frequency, let λ1 and λ2 = λ1 +dλ be two slightly di erent wavelengths, with power Wλ(λ, T )dλ emitted per unit surface area at wavelengths between λ1 and λ2. The same power must be emitted11 between frequencies ν1 = c/λ1 and ν2 = c/λ2:
Wν (ν, T )dν = Wλ(λ, T )dλ. |
(14.35) |
|
|
2π5k4 |
|
= σSB T |
|
. |
(14.33) |
Since ν = c/λ, dν/dλ = −c/λ |
2 |
, and |
|
|||||
|
= 15c2h3 T |
4 |
4 |
|
|
|||||||||||
|
|
B |
|
|
|
|
|
|
|
|
|
|
|
|||
This is the Stefan–Boltzmann law. The Stefan– |
|
|dν| = + |
c |
|
|dλ| . |
(14.36) |
||||||||||
|
|
|||||||||||||||
λ2 |
||||||||||||||||
Boltzmann constant, which is traditionally denoted by |
|
|
|
|
|
|
|
|||||||||
σSB but which has no relationship to cross section, was |
|
|
|
|
|
|
|
|||||||||
11Wλ(λ, T ) and Wν (ν, T ) do not have the same functional form. |
||||||||||||||||
|
|
|
|
|
|
|
|
|
||||||||
|
|
|
|
|
|
|
|
|
In fact, they have di erent units. The units of Wλ(λ, T ) are W |
|||||||
|
|
|
|
|
|
|
|
|
||||||||
10This is not a simple integration. See Gasiorowicz (1974, p. 6). |
m−3, while those of Wν (ν, T ) are W s m−2. |
|
||||||||||||||
14.8 Infrared Radiation from the Body |
375 |
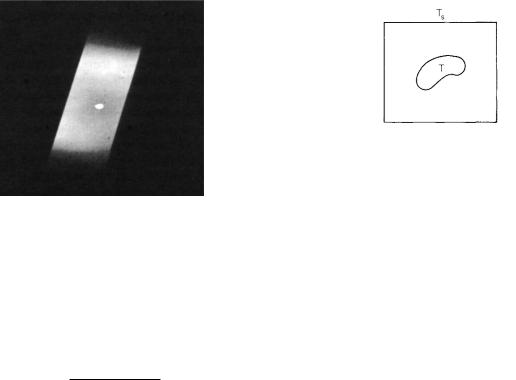
FIGURE 14.25. A photograph of an incandescent tungsten tube with a small hole drilled in it. The radiation emerging from the hole is brighter than that from the tungsten surface. From D. Halliday, R. Resnick, and K. S. Krane (1992). Fundamentals of Physics, 4th ed. extended edition. Vol. 2, p. 1022. Copyright c 1992 John Wiley & Sons. Reproduced by permission of John Wiley & Sons.
FIGURE 14.26. A blackbody at temperature T within a container with wall temperature Ts.
implies that a surface that appears blackest when it is absorbing radiation will be brightest when it is heated. Figure 14.25 shows a small hole in a piece of tungsten that has been heated. The hole forms the opening to a cavity and is therefore more absorbing than is the tungsten surface. When heated, the hole emits more light than the tungsten surface.
Equations 14.32–14.36 can be combined to give
Wν (ν, T ) = |
2πν2(hν) |
(14.37) |
c2(ehν/kB T − 1) . |
This transformation is shown in Fig. 14.24. The amount of power per unit area radiated in the 0.5 µm interval between two of the vertical lines in the graph on the lower right is the area under the curve of Wλ between these lines. The graph on the upper right transforms to the corresponding frequency interval. The radiated power, which is the area under the Wν curve between the corresponding frequency lines on the upper left, is the same. We will see this same transformation again when we deal with x rays. Note that the peaks of the two curves are at di erent frequencies or wavelengths.
We see in the figures above that at higher temperatures the peak occurs at shorter wavelengths. Eq. 14.32 can be di erentiated to show that at temperature T the peak in Wλ occurs at wavelength
λmaxT = |
|
hc |
= 2.90 × 10⁻³ m K. |
(14.38) |
|||
|
|
||||||
4.9651kB |
|||||||
Similarly, we can di erentiate Eq. 14.37 to show that |
|||||||
νmax |
= |
|
2.82144kB |
= 5.88 × 10¹⁰ K−1 s−1. |
|||
|
T |
|
h |
|
|||
The product λmaxνmax = 1.705 × 10⁸ m s−1 = 0.57c. All this is true for a blackbody. Thermodynamic argu-
ments can be made to show that if a body does not completely absorb light at some wavelength, that is, (λ) < 1,
then the power emitted at that wavelength is |
|
(λ)Wλ(λ, T ). |
(14.39) |
This is the same (λ) that was introduced earlier in this section. It is called the emissivity of the surface. This
14.8 Infrared Radiation from the Body
The body radiates energy in the infrared, and this is a significant source of energy loss. Infrared radiation has been used for over 40 years to image the body, but the value of the technique is still a matter of debate. We saw earlier how the scattering of infrared radiation by the body can be used to learn information about tissue beneath the surface.
Measurements of the emissivity of human skin have shown that for 1 µm< λ ≤ 14 µm, (λ) = 0.98 ± 0.01. This value was found for white, black, and burned skin [Steketee (1973)]. In the infrared region in which the human body radiates, the skin is very nearly a blackbody. Let us apply Eq. 14.33 to see what the blackbody radiation from the human body is. The total surface area of a typical adult male is about 1.73 m2. The surface temperature is about 33 ◦C = 306 K (this is less than the core temperature of 310 K). Therefore the total power radiated is wtot = SWtot = SσSB T 4 = 860 W. This is a large number, nearly 9 times the basal metabolic rate of 100 W. The reason it is so large is that it assumes the surroundings are at absolute zero, or that the subject is radiating in empty space with no surroundings. When there are nearby surfaces, radiation from them is received by the subject, and the net radiation is considerably less than 860 W.
The easiest arrangement for which to calculate the net heat loss is a blackbody at temperature T surrounded by a similar surface at temperature Ts (Fig. 14.26). At equilibrium the temperature of both objects is the same, T = Ts. The power emitted by the body is equal to the power absorbed. Increasing T increases the power emitted according to Wtot = σSB T 4. The body then emits more power than it absorbs. Equilibrium is restored when the body has cooled or the surroundings have warmed so that
376 14. Atoms and Light
the temperatures are again the same. Thermodynamic arguments can be made to show that the net power radiated by the body is
wtot = SσSB (T 4 − Ts4). |
(14.40) |
If the object is not a blackbody or the wall temperature is not uniform, the net power loss is more complicated. However, this model represents a considerable improvement over our previous calculation. Suppose that the surroundings are at a temperature Ts = 293 K (20 ◦C). The net loss is
wtot = (1.73)(5.67 × 10⁻⁸)(3064 − 2934) = 137 W.
This says that a nude subject surrounded by walls at 20 ◦C would have to exercise to maintain body temperature, even if the air temperature were warm enough so that heat conduction and convection losses were zero.
If you have lived in a cold climate, you have probably felt cold in a room at night when the drapes are open, even though a thermometer records air temperatures that should be comfortable. This is because of radiation from you to the cold window. The glass is transparent only in the visible range; for infrared radiation it is opaque and has a high emissivity. The radiation of the cold window back to you is much less than your radiation to it, and you feel cold.
This same problem can occur with a premature infant in an incubator. If the incubator is placed near a window, one wall of the incubator can be cooled by radiation to the window. The infant can be cooled by radiation to the wall of the incubator, even though a shiny (low-emissivity) thermometer in the incubator records a reasonable air temperature. One solution is to be careful where an incubator is placed and insulate its walls; another is to redesign incubators with a feedback loop controlling the infant’s temperature.
Infrared radiation can be used to image the body. Two types of infrared imaging are used. In infrared photography the subject is illuminated by an external source with wavelengths from 700 to 900 nm. The di erence in absorption between oxygenated and nonoxygenated hemoglobin allows one to view veins lying within 2 or 3 mm of the skin. Either infrared film or a solid-state camera can detect the reflected radiation.
Thermal imaging detects thermal radiation from the skin surface. Significant emission from human skin occurs in the range 4–30 µm, with a peak at 9 µm (Fig. 14.23). The detectors typically respond to wavelengths below 6– 12 µm. Thermography began about 1957 with a report that skin temperature over a breast cancer was slightly elevated. There was great hope that thermography would provide an inexpensive way to screen for breast cancer, but there have been too many technical problems. Normal breasts have more variability in vascular patterns than was first realized, so that di erences of temperature at corresponding points in each breast are not an
accurate diagnostic criterion. The thermal environment in which the examination is done is extremely important. The sensitivity (ability to detect breast cancer) is too low to use it as a screening device. Thermography has also been proposed to detect and to diagnose various circulatory problems. Thermography is generally not widely accepted [Cotton (1992); Blume (1993)], though it still has its proponents.
Infrared radiation from the tympanic membrane (eardrum) and ear canal is used to measure body temperature. One instrument is based on pyroelectric sensors, which were developed for use in motion detectors [Fraden (1991)]. The sensors have a permanent electric dipole moment whose magnitude changes with temperature.
14.8.1Atherosclerotic Coronary Heart Disease
Atherosclerotic coronary heart disease (ACHD) has been or is being studied with every imaging technique described in this book. All of the techniques are invasive: a catheter is inserted into the artery in question. We arbitrarily mention them all here. In ACHD a fatty plaque forms in the lumen (interior passage way) of the artery.
The standard technique is coronary artery angiography: the heart is imaged by x-ray fluoroscopy (see Chapter 16) while a dye opaque to x rays is introduced in the vessel. This allows accurate determination of the degree of stenosis (blocking) of the vessel. It has been thought that when the artery is nearly blocked, the restricted blood flow leads to a myocardial infarct (heart attack). It has recently been realized that smaller plaques may become disrupted and lead to a myocardial infarct. Current research seeks to learn what makes these particular plaques vulnerable. There is an extensive literature, reviewed by MacNeill et al. (2003) and Verheye et al. (2002).
In intravascular ultrasound (IVUS), a 20–40 MHz transducer at the end of the catheter can detect calcium (which deposits in areas of tissue injury). IVUS elastography measures how the arterial wall changes during the pressure variations of the cardiac cycle, in the hope that changes in elasticity will indicate vulnerable plaques.
Optical coherence tomography can provide highresolution (20 µm) structural details.
Coronary angioscopy attempts to directly view the arterial wall using a tiny fiber-optic endoscope. A serious problem here is blood getting between the tip of the endoscope and the arterial wall. This has been solved by temporarily occluding (blocking) the artery “upstream” with a balloon catheter or by flushing the area with saline solution.
Thermography has also been explored, first with a temperature-sensitive thermistor, and also with an infrared imaging mirror. Areas of inflammation have a somewhat higher temperature than surrounding areas.
14.9 Blue and Ultraviolet Radiation |
377 |
Both Raman spectroscopy and near infrared spectroscopy have been used.
In intravascular magnetic resonance imaging (Magnetic resonance imaging is described in Chapter 18) the detector coil is made small enough to fit at the tip of the catheter.
All of these techniques are still experimental.
14.9 Blue and Ultraviolet Radiation
14.9.1 Treatment of Neonatal Jaundice
The energy of individual photons of blue and ultraviolet light is high enough to trigger chemical reactions in the body. These can be both harmful and beneficial. A beneficial e ect is the use of blue light to treat neonatal jaundice. The most common harmful e ect is the development of sunburn, skin cancer, and premature aging of the skin.
Neonatal jaundice occurs when bilirubin builds up in the blood. Bilirubin is a toxic waste product of the decomposition of the hemoglobin that is released when red blood cells die. It is insoluble in water and cannot be excreted through either the kidney or the gut. It is excreted only after being conjugated with glucuronic acid in the liver. Bilirubin monoglucuronate and bilirubin diglucuronate are both water soluble. They are excreted in the bile and leave via the gut. Some newborns have immature livers that cannot carry out the conjugation. In other cases there is an increased rate of red blood cell death (hemolysis) and the liver cannot keep up. The serum bilirubin level can become quite high, leading to a series of neurological symptoms known as kernicterus. The abnormal yellow color of the skin called jaundice is due to bilirubin in the capillaries under the skin.
It was discovered accidentally that when the skin of a newborn with jaundice was exposed to bright light, the jaundice color went away. Photons of blue light have sufficient energy to convert the bilirubin molecule into more soluble and apparently less harmful forms [McDonagh (1985)]. Photons of longer wavelength have less energy and are completely ine ective. The standard form of phototherapy used to be to place the baby “under the lights.” Since the lights were bright and also emitted some ultraviolet, it was necessary to place patches over the baby’s eyes. Also, since the baby’s skin had to be exposed to the lights, it had to be placed in an incubator to keep it warm. A fiberoptic blanket has been developed that can be wrapped around the baby’s torso under clothing or other blankets. The optical fibers conduct the light from the source directly to the skin. Eye patches are not needed, and the baby can be fed and handled. Typical energy fluence rates are (4–6) × 10−2 W m2 nm−1 in the range 425–475 nm. Acceptance by nursing sta and parents is very high [Murphy and Oellrich (1990)]. The blanket can even be used for home treatment, though this
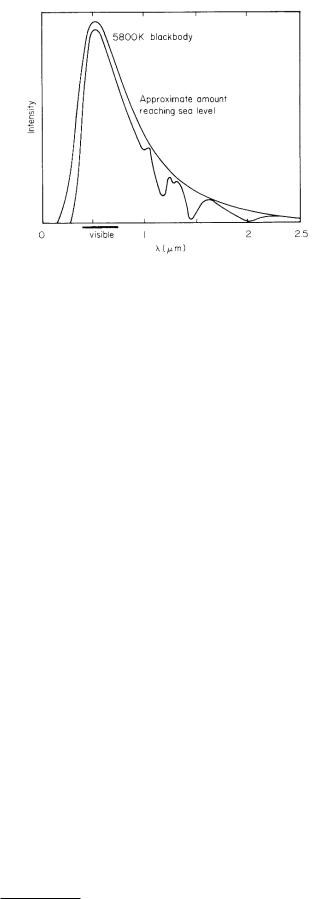
FIGURE 14.27. The solar spectrum and the approximate spectrum reaching the earth after atmospheric attenuation.
is still controversial. Volume 24, Issue 4 of Health Devices (August, 1995) is devoted to an assessment of fiberoptic phototherapy systems.
14.9.2The Ultraviolet Spectrum
Ultraviolet light can come from the sun or from lamps. The maximum intensity of solar radiation is in the green, at about 500 nm. The sun emits approximately like a thermal radiator at a temperature of 5,800 K. Figure 14.27 shows a 5,800-K thermal radiation curve. The power per unit area from the sun at all wavelengths striking the earth’s outer atmosphere, the solar constant, calculated by regarding the sun as a thermal radiator, is 1,390 W m−2 (2 cal cm−2 min−1).
Satellite measurements give 1,372 W m−2 [Madronich (1993)]. Because of reflection, scattering, atmospheric absorption, and so forth, the amount actually striking the earth’s surface is about 1,000 W m−2. Figure 14.27 also shows the e ect of absorption of sunlight in the atmosphere. The sharp cuto at 320 nm is due to atmospheric ozone (O3), which absorbs strongly from 200 to 320 nm. It absorbs more weakly at wavelengths as long as 360 nm. Molecular oxygen absorbs strongly below 180 nm.
The ultraviolet spectrum is qualitatively divided into
the following regions: |
|
UVA |
315–400 nm |
UVB |
280–315 nm12 |
UVC or middle UV |
200–280 nm |
Vacuum UV |
<240 nm |
Far UV |
120–200 nm |
Extreme UV |
10–120 nm |
Only the first three are of biological significance, because the others are strongly absorbed in the atmosphere.
12In Europe the range of UVB radiation is 290–300 nm.
378 14. Atoms and Light
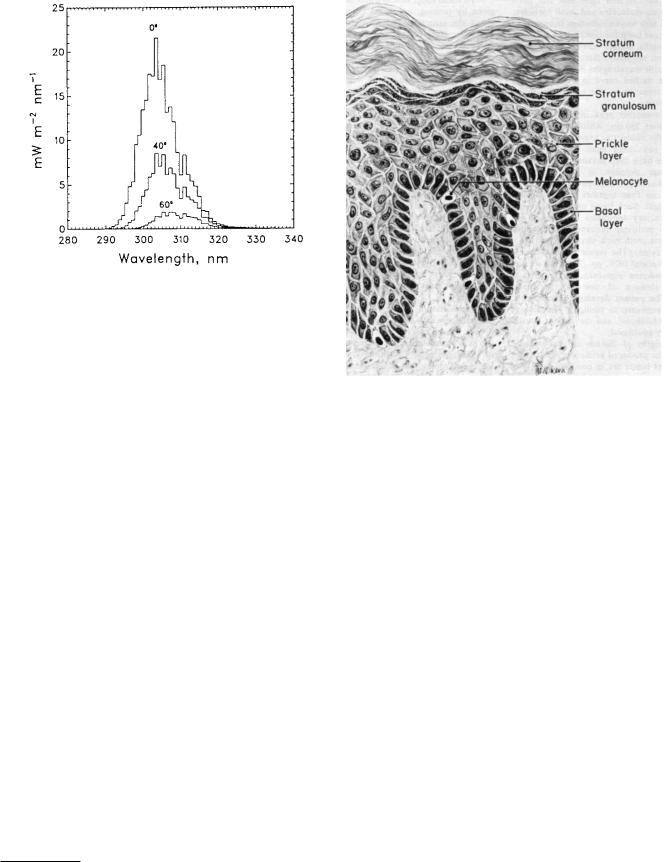
FIGURE 14.28. Spectral dose rates weighted for ability to damage DNA for three di erent angles of the sun from over-
head. The calculation assumes clear skies and an ozone layer of 300 Dobson units (1 DU = 2.69 × 10²⁰ molecule m−2).
From S. Madronich. The atmosphere and UV-B radiation at ground level. In A. R. Young et al., eds. New York, Plenum, pp. 1–39 (1993). With kind permission of Springer Science and Business Media.
Madronich (1993) gives a detailed discussion of the various factors that reduce the ultraviolet energy reaching the earth’s surface. The sensitivity of DNA decreases as the wavelength increases. Figure 14.28 shows the solar radiation reaching the ground when the sun is at di erent angles from the zenith (directly overhead), weighted for DNA sensitivity. Biological e ects of ultraviolet light are reviewed by Di ey (1991). Computer programs are available that calculate the total dose during a day at di erent latitudes and altitudes.13
14.9.3Response of the Skin to Ultraviolet Light
There are several responses of the skin to ultraviolet light. In order to understand them one must know something about the anatomy and physiology of skin. The outer layer of the skin, the epidermis, consists of three sublayers (Fig. 14.29). A single layer of basal cells is on the inside. Most of these cells produce keratin, a protein that gives the outer layers of skin its strength. About 10% of the cells are melanocytes that produce the pigment melanin. Next comes a sublayer of about seven cells, called the prickle layer. On top of this is a twoor three-cell layer called the stratum granulosum or granular layer. The surface is a layer of dead cells, primarily keratin but also cel-
13A computer program for evaluating solar UV exposure has been provided, with a listing, by Schaefer (1993). See also Di ey and Cameron (1984).
FIGURE 14.29. The epidermis. The basal layer contains the cells from which the other layers are derived. As the cells move toward the surface they become the prickle layer and the stratum granulosum (granular layer). The stratum corneum is dead cellular debris. The melanocytes, which produce melanin granules, are in the basal layer. Reprinted from D. M. Pillsbury and C. L. Heaton. A Manual of Dermatology. 2nd. ed. Philadelphia, Saunders, 1980, p. 5, with permission from Elsevier.
lular debris, called the stratum corneum or horny layer. Basal cells are constantly produced in the basal layer, migrate outward, become the stratum corneum, and are sloughed o .
In order to discuss injury to tissue, both here by ultraviolet light and in later chapters by x rays, we need to introduce some specialized terms. The body’s immediate (acute) response to an injury, whether it is an infection, a bump, a cut or a burn, is the inflammatory response described on p. 116. Prolonged (chronic) irritation may result in abnormal cell growth. The abnormalities of cell growth that result in organs or tissues that are larger than normal are hypertrophy, an enlargement of existing cells, and hyperplasia, an enlargement due to the formation of new cells. The aberrations in cell growth patterns are shown in Table 14.4. They are metaplasia, dysplasia, and anaplasia. Metaplasia is reversible and goes away if the stimulus or irritant is removed. Dysplasia is sometimes reversible and sometimes progresses to become cancerous. Anaplastic changes are present in nearly all forms of cancer. Anaplasia may result from dysplasia, or it may arise directly from normal cells.
|
|
14.9 Blue and Ultraviolet Radiation |
379 |
|
|
TABLE 14.4. Abnormal changes in tissue |
|
||
|
|
|
|
|
Metaplasia |
A reversible change in which one cell type is re- |
|
||
|
placed by another. |
|
|
|
Dysplasia |
Variation in size, shape, and organization of the |
|
||
|
cells. Literally, “deranged development.” |
|
||
Anaplasia |
A marked, irreversible, and regressive change from |
|
||
|
adult cells that are di erentiated in form to more |
|
||
|
primitive, less di erentiated cells. |
|
|
|
|
|
|
|
|
|
Di erences between benign and malignant tumors |
|
||
|
|
|
|
|
Characteristic |
Benign |
Malignant |
|
|
|
|
|
|
|
Histologic |
Often typical of the tissue of ori- |
Not well di erentiated; atypical |
|
|
di erentiation |
gin. |
cells. |
|
|
(microscopic |
|
|
|
|
appearance) |
|
|
|
|
Mode of growth |
Expands inside a capsule. |
Expansive; also infiltrative, with |
|
|
|
|
no capsule. |
|
|
Rate of growth |
Progressive; usually slow; few |
May be rapid, with many cells un- |
|
|
|
cells undergoing mitosis |
dergoing mitosis. |
|
|
|
(division) at any one time. |
|
|
|
Metastasis |
Absent. |
Frequently present. |
|
|
(distant spread) |
|
|
|
|
|
|
|
|
|
|
1 |
|
|
|
|
0.1 |
|
|
|
(λ) |
0.01 |
|
|
|
ε |
|
|
|
|
|
0.001 |
|
|
|
0.0001 |
300 λ, nm |
|
|
|
|
250 |
350 |
400 |
|
|
UV-C |
UV-B |
UV-A |
|
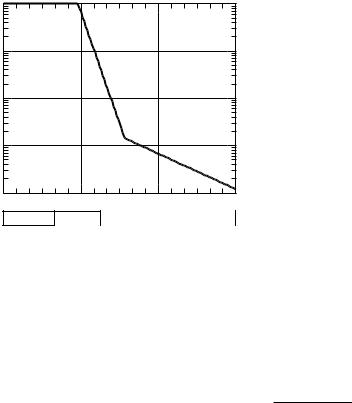
FIGURE 14.30. The erythema action spectrum (λ) for ultraviolet light, as adopted by the CIE in 1987.
The acute e ect of ultraviolet radiation is reddening of the skin or erythema due to increased blood flow in the dermis, the layer beneath the epidermis. This is part of the inflammatory reaction. The amount of energy that just produces detectable erythema is called the minimum erythemal dose. It is di cult to measure in an objective manner. New instrumentation allows quantitative measurements [Di ey and Farr (1991)]. The 1987 reference
action spectrum adopted by the CIE14 shows the relative sensitivity of the skin versus wavelength for the production of erythema. It is
|
1.0, |
|
|
250 |
≤ |
λ |
≤ |
298 nm |
|
|
100.094(298−λ), |
298 |
λ |
328 nm |
(14.41) |
||||
(λ) = |
≤ |
≤ |
|||||||
|
100.015(139 |
− |
λ), |
328 |
|
400 nm |
|
||
≤ |
|
≤ |
|
||||||
|
|
|
λ |
|
|
||||
This is plotted in Fig. 14.30. The minimum erythemal dose at 254 nm is about 6 × 10⁷ J m−2 [Di ey and Farr (1991, Table 2)]. There is considerable scatter from one experiment to another. When the degree of erythema is plotted vs energy per unit area, the slope of the curve depends on the wavelength. Early e ects on skin include sunburn, tanning (now thought to be an injury response), and thickening. Daily exposure for 2 to 7 weeks causes a threeto fivefold thickening of the stratum corneum.
Some patients have an abnormally high sensitivity to ultraviolet exposure. They may exhibit abnormal photosensitivity because of various diseases or from taking drugs such as phenothiazines (one of the classes of major tranquilizers), sulfa drugs, dimethylchlortetracycline, the antidiabetic sulfonureas, and thiazide diuretics and even from drinking quinine water. Photocontact dermatitis is
14Commission International de l’Eclairage or International Commission on Illumination.