

Kluwer - Handbook of Biomedical Image Analysis Vol
.2.pdfA Knowledge-Based Scheme for Digital Mammography |
613 |
Table 11.4: Mean percentage improvement in segmentation performance by using the target-enhancement method compared to the segmentation of the unenhanced image for each mammogram grouped by breast type
Type |
TPT |
SUBTPT |
Total |
|
|
|
|
1 |
0.76 |
1.25 |
0.83 |
2 |
1.28 |
0.64 |
1.03 |
3 |
0.80 |
4.00 |
1.43 |
4 |
1.47 |
6.50 |
2.25 |
Mean |
1.07 |
3.09 |
1.38 |
|
|
|
|
methods for fatty breasts but is noticeably less effective in the segmentation of dense breasts (types 3 and 4).
11.3.2.2.5Mean Percentage of Target Mass Detected as TPT or SUBTPT . Using the target contrast enhancement expert, Table 11.4 tabulates the mean percentage improvement in segmentation performance compared with the segmentation of the unenhanced image for lesion ground-truth detected with outcomes TPT and SUBTPT for all mammograms, grouped by breast type. The greatest improvement can be seen in the segmentation of the densest breast type using the target contrast enhancement method, compared to the segmentation obtained from the unenhanced original (e.g., on average, for breast type 1, using target enhancement method result in 83% improvement in segmentation compared to the unenhanced original).
11.3.2.2.6A Classical Solution in Choosing a Single Optimal Contrast Enhancement Method for CAD. In analyzing the 166 selected mammograms, a common approach to identify a single optimal contrast enhancement for use in CAD is to evaluate a selection of enhancement methods on a range of different training mammograms from different breast types. By determining the mean value of T P T + SUBTPT for all enhancement methods across all mammograms, the CAD researcher can choose to select the single method maximizing the value of TPT + SUBTPT from the training set. Table 11.5 lists the

A Knowledge-Based Scheme for Digital Mammography |
615 |
percentage improvement in segmentation compared with the original segmentation, in the detection of ground truth defined lesions detected with outcomes TPT and SUBTPT obtained using each individual enhancement method. From the data obtained, in identifying the single best enhancement method, the FUZZY method (Table 11.5, part c) is chosen for each breast type. Notice that the segmentation performance obtained using the FUZZY method shown in Table 11.5 (part c) for all mammograms, is suboptimal compared with that of the target contrast enhancement for each mammogram shown in Table 11.4.
11.3.3 Identifying Input Mapping Features
To implement a knowledge-based contrast enhancement component to learn the target enhancement for a given mammogram, a supervised learning paradigm is employed. By utilizing pattern recognition tools, a classifier can learn from a set of example mammograms the target contrast enhancement. For an unseen testing mammogram, the trained classifier will accurately predict the actual enhancement that maximizes segmentation performance.
During training the classifier learns a mapping between a characteristic of an example training mammogram and the target enhancement method. To facilitate this mapping, features are extracted to characterize the training and testing mammograms. Two different approaches to feature extraction are described:
(1) feature extraction from a ROI and (2) feature extraction from a breast profile.
11.3.3.1 Gray-Scale Features Extracted from a Suspicious ROI
This approach to feature extraction extracts a set of F features from pixels comprising a suspicious ROI target, T , thus FROI = { f1, f2, . . . , fF }. A surrounding region labelled background, B, of the same area is constructed encircling the ROI, but comprising normal pixels. From pixels that comprise the target (T ) and background (B) region, the following gray-level statistics are extracted: mean, standard deviation, entropy, skewness, and kurtosis. These are transformed into feature values by determining the ratio of the target value to background value (T /B) for each gray-scale statistic. The features reflect the mathematical composition of the quantitative measure of contrast enhancement previously proposed.
616 |
Singh and Bovis |
11.3.3.2 Gray-Scale Features Extracted from the Breast Profile
An alternative approach to feature extraction is based on the gray scales that comprise a breast profile. A method for the construction of a segmented breast profile is described in [19]. A number of gray-scale features are extracted from the mammograms, including co-occurrence matrix based features, Fourier Transform-spectral energy based features, Law’s mask features, discrete wavelet transform features, statistical features, circularity (shape) feature and fractal dimension feature. These are described in detail in [26]. Altogether this gives a set of 316 features FBP316 = ( f1, f2, . . . , f316) that are extracted from the breast profile to characterize a mammogram. In addition, the application of principal component analysis (PCA) (a mechanism for dimensionality reduction) results in a 26-dimensional feature space FBP26 = ( f1, f2, . . . , f26). Both features sets
{FBP316 , FBP26 ) are evaluated as mapping features in the learning of the expert contrast enhancement.
11.3.4Strategies for Learning the Contrast Enhancement Experts
To train a knowledge-based contrast enhancement component, the mapping between the input gray-scale feature vectors discussed in the previous section and the target method indicated by the quantitative measure of segmentation from Table 11.2 is learnt. This section gives an overview of two strategies to learn the target enhancement mapping:
Double network mapping (DNM): This strategy adopts a divide-and- conqueror paradigm. It attempts to decompose a single mapping into two simpler mappings. The first mapping to be learnt between the features from ROI and the three quantitative measure of enhancement performance proposed in section 11.3.1. A second process learns the mapping of the quantitative measure of enhancement with quantitative measure of segmentation. On testing this strategy will predict a measure of segmentation for each contrast enhancement method, and the actual contrast enhancement method is identified as the one maximizing the segmentation performance.
Breast profile mapping (BPM): This strategy differs in that the solution adopts a classification-based approach and aims to learn the mapping of feature set FBP extracted from the complete breast image with a label of the target
A Knowledge-Based Scheme for Digital Mammography |
617 |
enhancement. On test, a single contrast enhancement method is predicted. Each strategy is described in detail in the following sections.
11.3.4.1 Double Network Mapping Overview
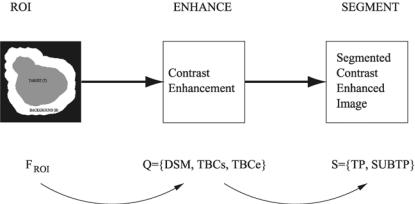
The double network mapping (DNM) method is used to predict the target contrast enhancement using two ANNs for each enhancement method. The aim is to learn a mapping based on a set of gray-scale features FROI from a given mammogram, with a quantitative measure of segmentation performance, S. The segmentation performance is quantified following contrast enhancement, for each enhancement method m, where 1 ≤ m ≤ M from a set of M enhancement methods. The two submappings are detailed below:
1.ANNmDNMenh: For a mammogram I, enhanced using enhancement method m, this ANN learns the mapping between the set of F gray-scale input features
FROI = ( f1, f2, . . . , fF ) extracted from a suspicious ROI, and a set of P quantitative measures Q = (q1, q2, . . . , qP ) of enhancement performance as described previously in section 11.3.1.
2.ANNmDNMseg: For a mammogram I, enhanced using enhancement method m, the ANN learns the mapping between the set of quantitative measure
Q = (q1, q2, . . . , qP ) of enhancement performance and a set of R measures quantifying the performance of lesion segmentation S = (S1, S2, . . . , SP ) identified in Table 11.2.
A diagrammatic overview of the mappings learnt is given in Fig. 11.6 and the training and testing phases are described in more detail below. To evaluate the strategy, a firefold cross-validation approach is used to reduce bias and ensure that a test result is produced for each mammogram image.
11.3.4.1.1 Training the DNM Approach. Using this strategy, ANNmDNMenh and ANNmDNMseg are trained independently for each enhancement method, Em where m {1, . . . , M}. For a training image, a border comprising normal pixels of the same areas as the target ROI is constructed around it. The set of grayscale input features FROI are extracted from the target ROI and background regions as described in section 11.3.3.1. Each training mammogram is contrast enhanced with each method and a set of quantitative measures of enhancement
618 |
Singh and Bovis |
Figure 11.6: Diagrammatic overview of the DNM strategy.
Q are calculated from the target ROI and border. Thus ANNmDNMenh learns the mappings:
ANNDNMenhm |
(11.11) |
|
FRO I −→ |
Q m = {1, . . . , M} |
|
Similarly for enhancement method Em to train ANNmDNMseg, the set of quantitative measures of enhancement Q are used as input features in learning the mapping with the set of quantitative measures of segmentation, S. Thus ANNmDNMseg learns the mappings:
ANNDNMsegm |
(11.12) |
|
Q −→ |
S m = {1, . . . , M} |
|
11.3.4.1.2 Testing the DNM Approach. The first step in determining the optimal contrast enhancement method for a test mammogram I is to locate a suspicious ROI. To do this, the HMRFU segmentation algorithm is used to segment the test image and it results in several candidate regions. Regions with a
Euler number > 1 (i.e, enclose a smaller region totally) are removed and from the remaining regions, the most likely suspicious regions are selected on the basis of area and morphological tests using a previously trained ANN. For the single suspicious ROI identified, a surrounding border is constructed of equal area, and the set of input gray-scale features FROI are extracted. These are used as inputs to ANNmDNMenh for each enhancement method Em where m {1, . . . , M}. The output of these networks is then supplied as input to ANNmDNMseg for each enhancement

A Knowledge-Based Scheme for Digital Mammography |
619 |
Table 11.6: Results from using optimized strategy DNM showing the mean percentage improvement in segmentation performance compared with the segmentation of the unenhanced original mammogram
Type |
TPA |
SUBTPA |
Total |
|
µ |
µ |
|
|
|
|
|
1 |
−0.16 |
1.75 |
0.10 |
2 |
0.28 |
−0.09 |
0.14 |
3 |
0.20 |
1.00 |
0.39 |
4 |
0.00 |
2.00 |
0.31 |
Mean |
0.08 |
1.16 |
0.24 |
|
|
|
|
method m {1, . . . , M}. The mth AN NDNMsegm maximising the value for the sum of T P and SU BT P outcomes is predicted as the optimal enhancement method for a test mammogram I, thus
assign Em → m if AN NDNMsegm |
= argmaxmM=1 AN NDNMsegm for m = {1, . . . , M} |
|
(11.13) |
11.3.4.1.3 Model Order Selection. Optimization of the model order for
AN NDNMsegm and AN NDNMsegm for each enhancement method Em, where m {1, . . . , M}, is performed independently by varying the number of hidden nodes between 2 and 30. The mean squared error (MSE) resulting for each model on test using fivefold cross validation is minimized. The optimal number of hidden nodes selected is the one which minimizes the MSE over all configurations of hidden nodes.
11.3.4.1.4 DNM Framework Results. Table 11.6 shows the mean percentage improvement in segmentation performance compared with the segmentation of the unenhanced original image, using the predicted expert enhancement for each breast type. The DNM strategy results are significantly poorer than those obtained using the target expert contrast enhancement methods reported in Table 11.4. They are also inferior to the use of the FUZZY method on all breasts as shown in Table 11.5 (part c).
620 |
Singh and Bovis |
11.3.4.2 Breast Profile Mapping—Overview
The second strategy used for learning the expert contrast enhancement for a mammogram is the breast profile mapping (BPM) strategy. For a mammogram
I, enhanced using enhancement method Em, where m {1, . . . , M}, the BPM strategy learns the mapping between the set of N gray-scale input features FBPN detailed in section 11.3.3.1, and a l = {1., . . . , L} indicates the target contrast enhancement for a training mammogram. Both feature sets {FBP316 , {FBP26 ) are evaluated separately in their utility for learning the expert contrast enhancement. The expert l is based on a set of R measures quantifying the performance of lesion segmentation S = {s1, s2, . . . , sR} described in Table 11.2. The expert l is identified as the one maximising the sum of TPT and SUBTPT outcomes for each enhancement method Em where m {1, . . . , M} as defined previously in Eq. (11.10).
Unlike the DNM strategy, this method utilizes a single classifier to predict the target contrast enhancement method. The k-nearest neighbor (k- NN) classifier has been show to be effective at learning nonparametric mappings with a small sample size [27] and for this reason it is employed in the knowledge-based contrast enhancement expert. To evaluate the strategy a fivefold cross validation is used to reduce bias and provide a test decision for each mammogram.
11.3.4.2.1 Training the BPM Approach. To train the BPM strategy, the set of gray-scale input features FBPN = ( f1, f2, . . . , fN ), where N identifies the original and PCA feature sets (N = {316, 26}), are extracted from the segmented breast profile. Each training mammogram is contrast enhanced with each enhancement method. The quantitative measures of segmentation are calculated for the target ROI. For each enhancement method, the winning predicted enhancement method identified by the label l is used to learn the mapping between
F and l with the k-NN classifier.
11.3.4.2.2 Testing the BPM Approach. To determine the predicted target enhancement method El for a test mammogram I, the set of gray-scale input features FBPN are extracted from the segmented breast profile. Using the trained k-NN classifier, the predicted actual expert contrast enhancement is determined.

A Knowledge-Based Scheme for Digital Mammography |
621 |
Table 11.7: Percentage improvement in segmenting an unenhanced mammogram compared to that obtained when segmenting the image enhanced using the predicted enhancement method from the optimized BPM strategy based on feature set FBP316
Type |
TPA |
SUBTPA |
Total |
|
µ |
µ |
|
|
|
|
|
1 |
−0.16 |
1.50 |
0.07 |
2 |
0.11 |
0.91 |
0.41 |
3 |
0.10 |
4.75 |
0.96 |
4 |
0.47 |
7.50 |
1.44 |
Mean |
0.13 |
3.66 |
0.72 |
|
|
|
|
11.3.4.2.3Model Order Selection. In order that the BPM strategy is to perform optimally, the number of nearest neighbors k must be correctly set. For each input feature set FBP316 and FBP26 for different values of k the validation set error is plotted and the value of k corresponding to the least error is chosen.
11.3.4.2.4BPM Framework Results
1.Feature set FBP316 : Using an optimized value of k = 23, Table 11.7 shows the percentage improvement in segmentation performance when using the predicated actual enhancement method, compared with that obtained with the unenhanced original from the FBP316 set. These results show that the segmentation improvement obtained over the unenhanced image, when segmenting an image enhanced using a enhancement method predicted by the BPM strategy, is greater than that obtained using the DNM strategy predicted enhancement method. However, segmenting the BPM strategy’s predicted enhanced image results in inferior performance to that using the target enhancement method identified in Table 11.4. The result for breast type 4, the densest breast type, shows a small improvement over using the FUZZY method, shown in Table 5 (part c), for all mammograms of that type.
2.Feature set FBP26 : Using an optimized value of k = 19, Table 11.8 shows the percentage improvement in segmenting the unenhanced image compared
