

Kluwer - Handbook of Biomedical Image Analysis Vol
.2.pdfz
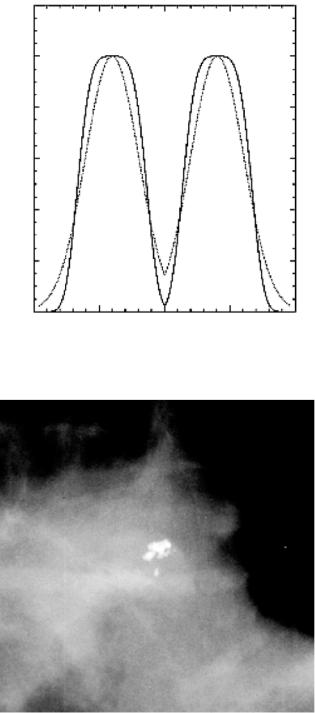
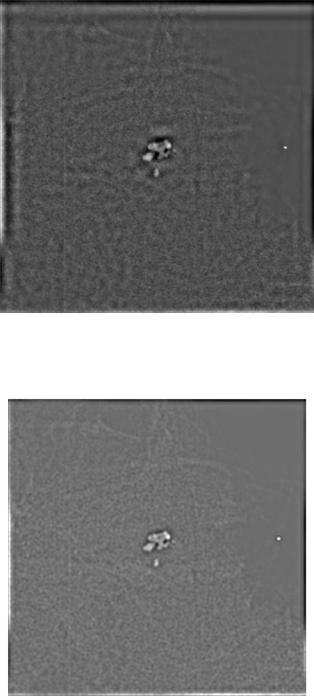
Figure 13.6: First three wavelet expansion images (d1, d2, and d3 from top to bottom) corresponding to the raw image of Fig. 13.5. The probability modeling and empirical histograms are displayed on the right after taking the absolute value of the data. The theoretical curves are represented by solid lines and the empirical data by dashed lines. For viewing purposes, the images are 256 × 256 pixel sections cut form the original image of Fig. 13.5 but the probability modeling is derived form the entire image.

Computer-Aided Diagnosis of Mammographic Calcification Clusters |
725 |
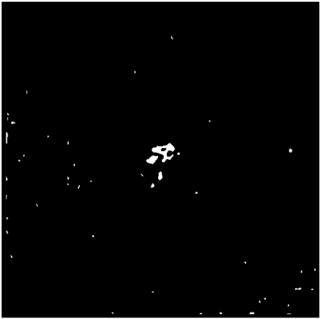
Figure 13.7: Detection output from the dual wavelet expansion image approach of Fig. 13.5. The binary mask has been projected into the sum of the first five dj images, a process that gives better detail for further processing.
there were two thresholds associated with each detection stage that were varied independently. Figure 13.7 shows the output of this process for the cluster shown in Fig. 13.5.
As we shall see below, the classification algorithm we developed requires the analysis of calcification attributes that were not fully present in the binary detection representation of Fig. 13.7. Two options could lead to the desired representation: (a) The binary detection output may be used as a mask that points back to the calcification location in the raw image, or, more generally, to any other data representation. For example, classification analysis could be done on any combination of the d images in Eq. (13.1). (b) Perform an additional segmentation operation on the binary detection output that would extract the shape and distribution of the detected cluster(s) and allow their shape analysis necessary for the classification step. The second option was selected in this application and calcifications were segmented in the detection
726 |
Kallergi, Heine, and Tembey |
image of Fig. 13.7 by applying an adaptive threshold process that is described in section 13.3.4.
It should be noted that the original symmlet wavelet method was developed and optimized for 35 m and 12 bits/pixel image resolution. The algorithm was modified to be applicable to images of 60 m and 16 bits/pixel, a resolution that was identified in separate experiments as optimum for morphology-based classification [28, 29]. Specifically, image resolutions of 60–90 m/pixel were found to maintain the calcification shape and size characteristics on which to base feature selection for classification. Higher spatial resolutions, i.e. 30 or 35 m, did not improve classification results but significantly increased computational intensity and image manipulation. Lower spatial resolutions, i.e., equal to or greater than 90 m/pixel, degraded classification performance because of the losses in morphology and distribution of the detected calcifications. So, in the following section, we will discuss the limitations of the symmlet wavelet method for applications other than 35 m and what led us to the design of a new filter for calcification detection independent of image resolution that significantly improved classification performance and robustness of the results.
13.3.3 The “Donut” Filter
For the moment, lets assume that the octave sectioning described previously divided the information in the best possible manner for detecting calcifications at a 35 m image resolution. But what happens if we change resolution? It may be safe to say that, if the resolution is doubled or halved, we could pick different expansion images and our technique would still be “the best” within this hypothetical situation; that is, if the images were scaled to down 70 m (lower resolution or halved), the d1 and d2 images would most likely be the most relevant choices. However, if the scaling was not applied by a factor of two (or half) we might end up with a less then optimal representation for detection purposes.
With this in mind and the outcome of the resolution studies mentioned earlier, we developed another band pass filter that we will refer to as the “donut” filter [51]. This filter has three infinitely adjustable parameters that control: (1) the central band location, (2) the band pass width, and (3) the sharpness of the
cut-off. This filter is easily expressed in radial frequency coordinates as |
|
||||||
exp |
|
|
( f − m) |
l |
(13.2) |
||
− |
< |
√ |
|
σ |
= |
||
|
2 |
|
|||||
Computer-Aided Diagnosis of Mammographic Calcification Clusters |
727 |
where f is a radial frequency variable, m locates the central band, σ controls the bandwidth, and l alters the cut-off. This filter has more adjustment leeway or freedom compared with the symmlet wavelet but at the cost of orthogonality. Certainly m and σ may be varied and a series of band pass filtered images may be generated the sum of which will not generate the raw image back. However, orthogonality is not always important.
In order to apply the new donut filter for calcification processing at an arbitrary image resolution, its operating parameters must be selected. There may be theoretical methods to approach this problem. However, an empirical method was used here based on signal-to-noise ratio analysis. For this, known calcification areas were hand-marked using a wide range of specimens from many images. Likewise, several normal image regions were labeled on the same images. The area markings for both normal and abnormal (calcification containing) tissue types were of the same size that changed depending on the particular image resolution. The calcifications were considered as “the signal” and the normal background tissue was considered as “the noise.” These images were processed repeatedly while varying m and σ of Eq. (13.2) and calculating the power for the respective image regions. By averaging the power from the signal and noise regions across all images and forming the average signal-to-noise ratio provided the means for finding the best average or overall operating parameters. The parameter l was determined prior to this by a similar rationale and was set to 4; if l = 2, the profile was Gaussian. Figure 13.8 shows slices through the donut filter for l = 2 and l = 4. Note the difference in the cut-off properties.
Figure 13.9 presents a section of a mammogram digitized at 60 m and 16 bits/pixel containing a calcification cluster associated with cancer. Figure 13.10 presents the symmlet wavelet output and Fig. 13.11 shows the donut filter output for the section of Fig. 13.9. The comparison of the two images in Figs. 13.10 and 13.11 indicates that more information was maintained with the donut filter than the symmlet wavelet approach something that impacted shape analysis and classification results as we shall see in the following sections.
In addition to the improved results obtained from the digitized mammograms, the donut filter could also be applied to full field digital mammography (FFDM) images with calcifications acquired with the new General Electric Senographe 2000D FFDM system. The result of the donut filter for a 100 m FFDM image with calcifications is shown in the insert of Fig. 13.12. A prewhitening technique was applied first to the data before the application of the donut filter. The
730 |
Kallergi, Heine, and Tembey |
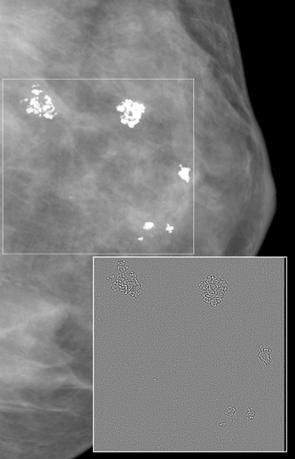
Figure 13.12: Main section of an FFDM image of the left breast of a patient with benign clustered calcifications enclosed in a white box. Image was acquired with GE’s Senographe 2000D digital system at a resolution of 100 m and 16 bits/pixel. The insert shows the region with the calcifications after filtering with the new donut filter in combination with a prewhitening approach. Note that the background is subdued (gray value information is removed) and calcifications remain as outlines that can be easily extracted.
prewhitening process amounts to removing the influence of the mammogram’s natural spectral form before applying the filter. Preliminary results suggest that this preprocessing step could increase overall detection performance.
The edge artifacts present in both the wavelet-filtered and the donut-filtered image are due to the wrap around effect in the convolution process or the
Computer-Aided Diagnosis of Mammographic Calcification Clusters |
731 |
periodic wrap around present in the discrete Fourier Transform. Basically, the filter kernel slides off one side of the image and appears on the other. Thus, for all practical purposes, the kernel slides over what appears as a discontinuity. The artifact appears more pronounced in the wavelet-filtered than the donutfiltered image, which may be due to the iterative convolution inherent to its application.
In all fairness, we have not discussed the characteristics of the actual mammograms, digitized or direct digital. Following, we will give a short description that will assist the reader in understanding the difficulties in processing mammograms either automatically (computer vision) or manually (human vision).
Evidence indicates that mammograms, regardless of resolution, obey an inverse power law with respect to their power spectral density [51–53]. Specifically, the power spectrum of a particular image drops off a 1/ f γ , with γ on the order of three. This indicates that the images are predominately low-frequency fields with long-range, although not well defined, spatial correlation. Power laws are inherently termed self-similar and often the term fractal is used. This implies that there are no preferred scales as with the human voice for example. There are debates as to whether an anatomical structure like the breast could be truly fractal. But, it is reasonable to say that the image statistics will quite often vary widely across the image from region-to-region due to this spectral characteristic. As an aside, wavelet expansion images may be considered as multiresolution derivatives (derivatives with respect to scale) in a loose sense. Effectively, the differencing produces images (the expansion image) that are not as irregular as the raw images. The reader interested in this line of reasoning could consult Heine et al. [52, 54] and the references therein.
13.3.4 Adaptive Thresholding
Following the filtering approaches described in sections 13.3.3 and 13.3.4, calcifications were segmented by either an adaptive thresholding approach or a Canny edge detector. The former method yielded better classification results so far with either the symmlet wavelet or the donut filter and this will be discussed here in more detail. Figures 13.13 and 13.14 show the results of the thresholding process applied on the filter outputs of Figs. 13.10 and 13.11.
To reduce FP signals in either output, a criterion was set on the minimum size of the segmented objects based on empirical observations of calcifications

Computer-Aided Diagnosis of Mammographic Calcification Clusters |
733 |
Figure 13.14: Adaptive thresholding of the donut filter output of Fig. 13.11. As in Fig. 13.13, both true and false calcifications were isolated and outlined. No edge effects were generated in this case. Furthermore, more calcifications were preserved in the segmentation stage at the expense of a slightly higher number of false signals.
objects and selection of the feature set to be used as input to the classifier. For this stage, we took advantage of prior art in the field of classification and our experience in mammographic features [56]. Our starting point was the implementation of the four shape features developed by Shen et al. [57] for individual calcifications and their modification to apply to calcification clusters. We expanded this initial set with two more shape descriptors of individual calcifications [20]. To represent the clusters, we added the standard deviations of the six shape descriptors and a distribution feature. To represent the patient and link the demographic data to the images, we added a demographic feature [58]. The final results was a set of fourteen features for cluster classification in mammography. Table 13.2 lists the selected feature set and the physical interpretation of each feature [59]. Specific definitions and details may be found in the listed references.