

Kluwer - Handbook of Biomedical Image Analysis Vol
.2.pdfSimultaneous Fuzzy Segmentation of Medical Images |
703 |
segmentation, Graph. Models Image Proc., Vol. 58, pp. 246–261,
1996.
[12]Carvalho, B. M., Gau, C. J., Herman, G. T., and Kong, T. Y., Algorithms for fuzzy segmentation, Pattern Anal. Appl., Vol. 2, pp. 73–81, 1999.
[13]Johnson, S. C., Hierarchical clustering schemes, Psychometrika, Vol. 32, pp. 241–254, 1967.
[14]Moghaddam, H. A. and Lerallut, J. F., Volume visualization of the heart using MRI 4D cardiac images, J. Comput. Inform. Tech., Vol. 6, pp. 215– 228, 1998.
[15]Rice, B. L. and Udupa, J. K., Clutter-free volume rendering for magnetic resonance angiography using fuzzy connectedness, Int. J. Imag. Syst. Tech., Vol. 11, pp. 62–70, 2000.
[16]Saha, P. K., Udupa, J. K., and Odhner, D., Scale-based fuzzy connected image segmentation: Theory, algorithms and validation, Comput. Vision Image Understanding, Vol. 77, pp. 145–174, 2000.
[17]Udupa, J. K., Wei, L., Samarasekera, S., Miki, Y., van Buchem, M. A., and Grossman, R.I., Multiple sclerosis lesion quantification using fuzzyconnectedness principles, IEEE Trans. Med. Imag., Vol. 16, pp. 598–609, 1997.
[18]Rosenfeld, A., Fuzzy digital topology, Inform. Control, Vol. 40, pp. 76–87, 1979.
[19]Herman, G. T., Geometry of Digital Spaces, Birkhauser,¨ Boston, MA, 1998.
[20]Dellepiane, S. G., Fontana, F., and Vernazza, G. L., Nonlinear image labeling for multivalued segmentation, IEEE Trans. Image Process., Vol. 5, pp. 429–446, 1996.
[21]Ahuja, N., Dot pattern processing using Voronoi neighborhoods. IEEE Trans. Pattern Anal. Mach. Intell., Vol. 3, pp. 336–343, 1982.
[22]Zahn, C. T., Graph-theoretic methods for detecting and describing Gestalt clusters, IEEE Trans. Comp., Vol. 1, pp. 68–86, 1971.
704 |
Herman and Carvalho |
[23]Jain, A. K., Murty, M. N., and Flynn, P. J., Data clustering: A review, ACM Comput. Surveys, Vol. 31, pp. 264–323, 1999.
[24]Gower, J. C. and Ross, G. J. S., Minimum spanning trees and single linkage cluster analysis, Appl. Statist., Vol. 18, pp. 54–64, 1969.
[25]Pal, S. K. and Majumder, D. K. D., Fuzzy Mathematical Approach to Pattern Recognition, Wiley Eastern, L., New Delhi, India, 1986.
[26]Cormen, T. H., Leiserson, C. E., and Rivest, R. L., Introduction to Algorithms, MIT Press, Cambridge, MA, 1990.
[27]Udupa, J. K., Saha, P. K., Udupa, J. K., and Lotufo, R. A., Fuzzy connected object definition in images with respect to co-objects, In: Proc. SPIE, Bellingham, WA, Vol. 3661: Image Processing, Hanson, K. M., ed.,
pp.236–245, 1999.
[28]Carvalho, B. M., Herman, G. T., and Kong, T. Y., Simultaneous fuzzy segmentation of multiple objects, In: Electronic Notes in Discrete Mathematics, Vol. 12, Del Lungo, A., Di Gesu,` V., and Kuba, A., eds., Elsevier, Amsterdam, 2003. http://www.elsevier.com/gejng/31/29/24/71/23/59/endm12002.pdf.
[29]Herman, G. T. and Carvalho, B. M., Multiseeded segmentation using fuzzy conectedness, IEEE Trans. Pattern Anal. Mach. Intell., Vol. 23,
pp.460–474, 2001.
[30]Garduno,˜ E., Vizualization and Extraction of Structural Components from Reconstructed Volumes, Ph.D. Thesis, Bioengineering Program, University of Pennsylvania, 2002.
[31]Pollak, I., Willsky, A. S., and Krim, H., Image segmentation and edge enhancement with stabilized inverse diffusion equations, IEEE Trans. Image Proc., Vol. 9, pp. 256–266, 2000.
[32]Koepfler, G., Lopez, C., and Morel, J.-M., A multiscale algorithm for image segmentation by variational method, SIAM J. Numer. Anal., Vol. 31, pp. 282–299, 1994.
Simultaneous Fuzzy Segmentation of Medical Images |
705 |
[33]Petersen, D. P. and Middleton, D., Sampling and reconstruction of wave- number-limited functions in N-dimensional Euclidean spaces, Inform. and Control, Vol. 5, pp. 279–323, 1962.
[34]Carvalho, B. M., Garduno,˜ E., and Herman, G. T., Multiseeded fuzzy segmentation on the face centered cubic grid, In: Advances in Pattern Recognition: Second International Conference, ICAPR 2001, Rio de Janeiro, Brazil, 2001. LNCS Vol. 2013, Singh, S., Murshed, N., and Kropatsch, W., eds., Springer-Verlag, pp. 339–348, 2001.
[35]Carvalho, B. M., Cone-Beam Helical CT Virtual Endoscopy: Reconstruction, Segmentation and Automatic Navigation, Ph.D. Thesis, Computer and Information Science Program, University of Pennsylvania, 2003.
[36]IBM, Visualization Data Explorer User’s Guide, Version 3 Release 1 Modification 4. http://www.opendx.org/support.html.

708 |
Kallergi, Heine, and Tembey |
arguments that support an opposite view [3]. It should be noted that breast cancer was the second major cause of death for women in 2003 and mammography has been responsibly for a mortality reduction of 20–40% [4, 5]. Despite its success, mammography still has a false negative rate of 10–30% and great variability [6].
Calcifications are one of the main and earliest indicators of cancer in mammograms. They are present in 50–80% of all mammographically detected cancers but pathologic examinations reveal an even greater percentage [7]. Most of the minimal cancers and in-situ carcinomas are detected by the presence of calcifications [7]. A review of the literature on missed breast cancers indicates that calcifications are not commonly found among the missed lesions [8]. Although perception errors are not excluded, particularly in the case of microcalcifications (size < 1 mm), the technique of screen/film mammography (SFM) has been significantly improved over the years offering high-contrast and high-resolution mammograms that make calcification perception relatively easy. A greater and continuing problem for radiologists, with a major impact on the specificity of the diagnosis, is the mammographic differentiation between benign and malignant clustered calcifications. Almost all cases with calcifications are recommended for biopsy but only about 15–34% of these prove to be malignant [9]. The biopsies necessary to make the determination between benign and malignant disease represent the largest category of induced costs of mammography screening and a major source of concern for radiologists, surgeons, and patients. The advent of full field direct digital mammography will probably amplify this problem by providing more details and revealing breast abnormalities at very early stages [10].
In the last 20 years, researchers have developed various computer schemes for analyzing mammograms with calcifications, masses, and other breast abnormalities in an effort to improve mammography and breast cancer detection and diagnosis [11]. Computer algorithms can be divided in three groups depending on their final goal: detection, diagnosis, and prognosis methodologies [12]. The majority of the effort to-date has been focused on the development of detection tools, namely tools that point out to the primary reader suspicious areas associated with calcification clusters or masses that may warranty further review. The outcome of the intensive research on detection has led to three commercial, FDA approved systems for computer-aided detection (CADetection) of calcifications and masses; two more manufacturers were in the process of applying
Computer-Aided Diagnosis of Mammographic Calcification Clusters |
709 |
for FDA approval as of this writing [2]. The commercial CADetection systems play the role of a virtual “second reader” by highlighting suspicious areas for further review and evaluation by the human observer [2].
Research on computer tools for diagnosis has been lacking behind but is now gaining momentum. The goal of a CADiagnosis system is to aid in the differentiation between benign and malignant lesions identified previously by a human observer [13] or a CADetection technique [14]. Such systems are not fully tested yet for clinical efficacy but are very promising and may provide significant aid to the mammographer in the form of a “second opinion.”
Finally, computer-aided prognosis (CAP) tools appear in the horizon and are beginning to be explored as the next step in computer applications for breast imaging. Certainly, the variety of problems encountered in the detection, management, treatment, and follow-up of breast cancer patients leave several unexplored areas where computer applications could be clinically useful with major benefits to health care delivery and patient management.
Although the goals of automated detection and diagnosis are different, the actual detection and classification tasks are not always separate [15]. Almost all modern detection algorithms contain modules that discriminate true from false signals, calcification-like or mass-like artifacts from true calcifications or masses, isolated or single calcifications from clustered ones, even benign from malignant lesions in order to point only to malignant ones [16]. Most of the computer-based diagnosis techniques rely on the human observer to provide the detection step and/or the classification features [13, 17]. Few, however, incorporate segmentation and detection with pattern recognition processes in order to provide an automated, seamless approach that yields detection as well as likelihood of malignancy [18].
CADiagnosis methodologies that aim at the automatic differentiation of benign from malignant calcifications use a variety of mathematical descriptors that represent or correlate with one or more clinical findings, demographic information, or purely technical image characteristics. Reported algorithms usually employ combinations of morphological, texture, and intensity features as well as patient-related, demographic information [13, 14, 17, 19]. A valuable, comprehensive summary of reported techniques is given by Chan et al. [18]. Most of these methods are successful particularly when compared to the diagnostic performance of the human readers and their positive predictive value that is relatively low. Jiang et al. [14] have reported one of the first ROC
710 |
Kallergi, Heine, and Tembey |
studies with a fully automatic classification method showing positive results. Despite advances in the field, several questions remain regarding the robustness of the current classification techniques, while their clinical benefits remain largely under-investigated.
This chapter looks into the types of CADiagnosis algorithms where segmentation, detection, and classification are combined in a seamless methodology that yields an outline of detected clustered calcifications and a likelihood of their malignancy. Furthermore, we look into algorithm designs where segmentation may play a critical role on the classification performance and we try to address issues related to the segmentation process and its validation. CADiagnosis methodologies that include a segmentation component and rely heavily on features that are extracted from the segmentation output could be very robust but entail a significant risk of being dependent on digitization conditions, i.e., laser vs. charge-coupled device (CCD)-based film scanners that vary in dynamic resolution characteristics, and on the source of digital data, i.e., digitized film vs. direct digital images. In addition, performance may depend on the nature of the segmented signals, i.e., false vs. true segmentations, artifacts vs. true objects, and even the criteria applied for the estimation of performance parameters including the type of gold standard available. This chapter reviews the work done by these investigators on CADiagnosis for mammography and breast microcalcification clusters, emphasizes segmentation issues, and reviews their impact on classification.
13.2 CADiagnosis Algorithm Design
The diagram in Fig. 13.1 shows the major components of a CADiagnosis algorithm aiming at the differentiation between benign and malignant lesions. Based on this diagram, one may distinguish two major pathways to algorithm development:
1.In one approach, a fully automated scheme is developed. Namely, the algorithm includes automated detection, feature selection, and classification modules. In this case, the diagnosis component of the algorithm may be considered as preceded by a CADetection component for an overall automated process.
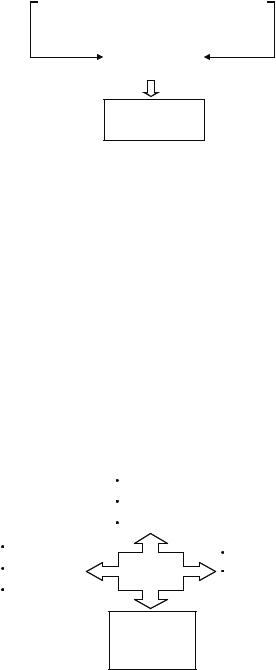
 2-D Image
 3-D Image
712 |
Kallergi, Heine, and Tembey |
In the literature, automated detection and diagnosis appear to be separated processes. However, as we discover when reviewing the elements of the various CADetection algorithms, more often than not, CADetection includes classification modules that allow the differentiation of true from false detected signals or benign from malignant signals in an effort to eliminate or reduce false positive signals and only point out to truly suspicious or cancerous-like areas. So, there is an inherent classification process in CADetection methods that is designed to remove signals not likely to be related to cancer. This process, however, is not very successful and has insufficient discriminatory power as indicated by the relatively large number of false positive (FP) signals appearing in the CADetection output (in both commercial and research systems) that are often related to benign conditions, e.g., benign calcifications and normal lymph nodes, and not only normal tissues. Another indication for the unsuccessful discrimination is the expressed frustration and concern among users of the CADetection systems for the large number of FP markers for either calcifications or masses that may confuse interpretation. Hence, the classification process included in CADetection algorithms for FP reduction may be considered as partial classification or not fully optimized as it does not provide accurate discrimination between benign and malignant lesions. In a CADiagnosis algorithm that follows the first approach above, CADetection is usually designed without a benign/cancer classification step, it aims at detecting all potential and true signals in an image (benign or malignant), and classification is performed at the final stage of the methodology with a dedicated component.
This chapter presents a CADiagnosis scheme that follows the first approach for the diagnosis of mammographic microcalcification clusters. The scheme was designed to reproduce a clinical visual analysis system that has shown significant success in the evaluation and diagnosis of calcifications clusters based on their morphology and distribution [20–22]. Hence, characterization and feature selection was confined to the morphological and distributional characteristics of calcifications excluding intensity or texture properties [18]. Another motivation for limiting feature selection to certain domains was the need to establish a validation tool for algorithms applied for the segmentation of calcifications and calcification clusters in mammograms that would avoid the path of “ground truth” comparisons. It is well known that there is significant ambiguity in the ground truth information provided by human observers. As a result, segmentation validation becomes highly uncertain. Our hypothesis was that calcification
Computer-Aided Diagnosis of Mammographic Calcification Clusters |
713 |
segmentation methods are better evaluated indirectly based on a classifier’s performance, if the classifier uses features defined only by the segmented objects.
13.2.1Calcification Characteristics and Clinical Visual Analysis System
The clinical visual analysis system that formed the basis for the design of our algorithm and guided our feature selection is described in detail elsewhere [20– 22]. It is based on several descriptors of the morphology and distribution of individual and clustered calcifications on mammograms. The number of calcifications in a cluster is not considered by itself a clear indicator of benign or malignant disease but when combined with other characteristics can increase or decrease suspiciousness [23–25]. The combination of all these properties by the human observer was shown to yield a sensitivity of 97.6% (correct identification of cancers associated with calcifications) and a specificity of 73.3% (correct identification of benign cases associated with calcifications) [20, 22].
The Breast Imaging Reporting and Data System (BIRADS) Lexicon of the American College of Radiology (ACR) was established in 1993 in an effort to standardize and improve mammographic interpretation. BIRADS was based on the clinical visual system of analysis. The recommended BIRADS descriptors for calcifications and calcification clusters are summarized in Table 13.1 [26]. Overall, there is strong evidence that morphology and distribution are two of the most important clinical aids in making the diagnosis of mammographic calcifications.
In clinical practice, a radiologist makes the final diagnosis of the detected calcifications based on the BIRADS characteristics, demographic information, and associated mammographic findings. However, interand intraobserver variability in the assignment of morphological features to the identified calcifications and ambiguity in the interpretation significantly degrades diagnostic performance. Hence, successful differentiation is limited among radiologists and can be as low as 20% leading to numerous unnecessary biopsies of cases with calcifications clusters [27].
Computer algorithms could translate and automate the clinical experience and thus assist the radiologist in this diagnostic task. An algorithm that provides information on the morphology, e.g., segments calcifications while preserving size and shape, and gives a likelihood of malignancy for a detected calcification cluster could be extremely valuable in mammogram interpretation and patient