

Kluwer - Handbook of Biomedical Image Analysis Vol
.2.pdf
644 |
Singh and Bovis |
Table 11.15: Sensitivity and average number of false-positive regions per
image over all 50 abnormal mammograms
|
|
|
|
|
After segmentation |
After false-positive |
||||
|
|
After segmentation |
|
prefiltering |
|
reduction |
|
|||
|
|
|
|
|
|
|
|
|
|
|
Breast type |
Sensitivity |
FP/i |
|
Sensitivity |
FP/i |
Sensitivity |
FP/i |
|||
|
|
|
|
|
|
|
|
|||
1 |
0.57 |
163.31 |
0.51 |
9.31 |
|
0.40 |
3.26 |
|||
2 |
0.58 |
132.09 |
0.56 |
8.26 |
|
0.48 |
4.40 |
|||
3 |
0.72 |
132.55 |
0.70 |
6.90 |
|
0.66 |
4.14 |
|||
4 |
0.66 |
158.79 |
0.64 |
10.27 |
0.60 |
3.56 |
||||
Mean |
0.63 |
146.69 |
0.60 |
8.68 |
|
0.54 |
3.84 |
|||
|
|
|
|
|
|
|
|
|
|
|
After expert segmentation with WGMMMRFS combined using AWM; after region prefiltering using Tarea = 122; after false-positive (FP) reduction using classifier operating point, by breast type.
a lower one. Using the unbiased PCA strategy described above only eigenvalues
≥ 1.0 are considered, resulting in a 37-dimensional feature vector.
11.5.2.2 Optimization of Networks
To optimize the number of hidden nodes, using 10-fold cross validation, different ANN models are evaluated. For the evaluated ANN model, performance in discriminating between abnormal and normal regions is determined using receiver operating characteristic (ROC) analysis [40]. By calculating the area under the ROC curve ( AZ ), a quantitative measure of performance can be determined.
11.5.2.3 Results from False-Positive Reduction
Table 11.15 summarizes the results from applying the false-positive reduction strategy to 200 abnormal segmented DDSM mammograms. Three sets of results are shown for each stage in the false-positive approach described for each breast type grouping.
The first column shows the sensitivity and average number of false positives per image following mammogram segmentation. The segmentation was obtained by combining 10 segmentation expert outcomes using the AWM described earlier. Each expert was constructed using the WGMM constrained with a MRF utilizing a supervised learning approach WGMMMRFS .
A Knowledge-Based Scheme for Digital Mammography |
645 |
The second column shows the sensitivity and average number of falsepositives regions per image obtained after applying the region prefiltering. These results demonstrate the utility of the region prefiltering stage. The average number of false-positive regions per image has dropped from approximately 147 to just 9 when testing on the complete dataset of 200 abnormal mammograms. This result has been obtained at a reduction in the sensitivity to the detection of breast lesions, from 0.63 to 0.60, for all breast types.
The final column shows the results obtained after classifying each region passing the prefiltering using an optimized ANN based on the 37-dimensional PCA feature vector for each sample. Using ROC analysis, the threshold for the detection of positive cases is set using the operating point of each ANN [40]. From these results it can be seen that the sensitivity is reduced still further to just 0.54 for all 200 abnormal mammograms, with a reduced average number of false-positive regions per image of 3.84. The results indicate that the biggest drop in sensitivity is obtained for the fatty breasts, breast types 1 and 2. This may be attributed to the increased variability of breast lesions in these breast types compared with that of the denser breasts.
11.5.3 Key Observations
The above discussion has described an approach to the reduction of falsepositive region from segmented images containing suspicious ROI. The following key observations can be drawn:
1.Region prefiltering: prefiltering regions based on their area is a quick and simple method to reducing false-positive regions while maintaining similar levels of sensitivity prior to filtering. The area threshold Tarea is defined for a circular region with a diameter of 5 mm. This is a similar value to that used in other studies and is stricter than that used by expert radiologists when interpreting film screen mammograms.
2.Feature extraction: By surveying previous studies, a subset of features for use in the reduction of false-positives regions has been evaluated. These features capture, morphological, gray scale, and texture information about each region. Using an unbiased implementation of PCA, the 316-dimensional feature space is reduced to a 37-dimensional feature space.
646 |
Singh and Bovis |
3.Sensitivity in the detection of breast lesions: Following evaluation of the FP reduction strategy on 200 abnormal segmented abnormal DDSM mammograms, sensitivity levels dropped by over 8% but the average number of false-positive regions per image drops by approximately 98%. Varying the threshold on the ANN classifier using ROC analysis, the expert radiologist can select a threshold that varies the available sensitivity at the expense of an acceptable number of false-positive regions.
11.6Evaluation of the Knowledge-Based Model
This section evaluates the performance of a given configuration of the adaptive knowledge-based model in predicting the optimal pipeline of image processing operators used for the CAD of breast cancer. This performance is compared to that obtained by keeping the pipeline fixed. Contrast enhancement and image segmentation are the key components in a mammographic CAD system. For these key components, sections 11.3 and 11.4, respectively, have demonstrated that a knowledge-based framework is superior to the single best method in each case. Parameterized versions of these components have been engineered for individual mammogram groupings. These groupings are based on the mammographic breast density and a mechanism for its prediction. Evaluation of the performance of each parameterized version of the knowledge-based component presented in the previous sections has been performed using the target mammogram breast grouping. In this section, the complete adaptive knowledge-based model is evaluated using the predicted breast group.
Section 11.6.1 evaluates the knowledge-based contrast enhancement and segmentation components using the predicted breast type grouping using 200 abnormal mammograms from the DDSM. Following this, section 11.6.2 evaluates the complete adaptive knowledge-based model using a dataset of 400 mammograms. This dataset comprises 200 normal and 200 abnormal mammograms comprising 50 images of each type from each of the four breast types. Results for segmentation and following false-positive reduction are presented. Finally section 11.6.3 presents key observations.
A Knowledge-Based Scheme for Digital Mammography |
647 |
11.6.1Expert Contrast Enhancement and Segmentation of Abnormal Images with Adaptive Knowledge-Based Model
11.6.1.1Dataset and Adaptive Knowledge-Based Model Configuration
This section presents the results from evaluating the optimal contrast enhancement and segmentation knowledge-based components of the adaptive knowledge-based model on a dataset of 200 DDSM mammograms containing abnormalities. The 200 mammograms comprise 50 images from each of four different breast types. To obtain a testing result for each mammogram, knowledgebased components utilize separate training and testing folds such that no image from a test fold exists in a corresponding training fold. Training data for the abnormal mammograms is based on redefined DDSM ground truth boundaries.
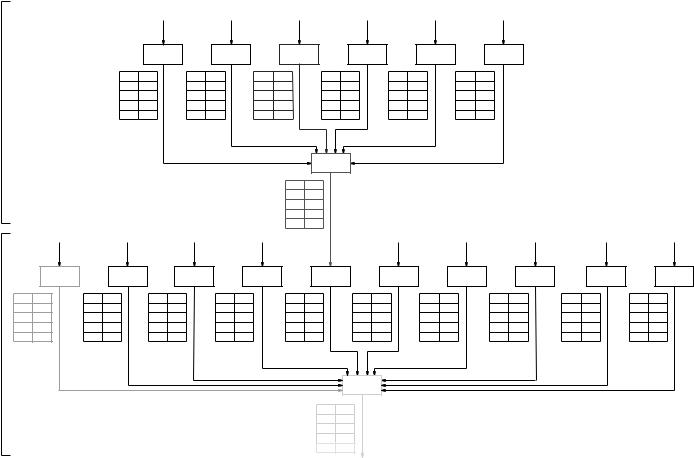
Figure 11.8 shows the configuration of the adaptive knowledge-based model for contrast enhancement and mammogram segmentation used for performance evaluation. Enhancement and segmentation experts are identified in the black boxes. Knowledge-based components, providing optimal enhancement and optimal segmentation, are identified in dotted boxes. Associated with each expert and knowledge-based component in Fig. 11.8 is a table with four rows, one for each breast type. The right-hand column of the table identifies the performance of the associated expert or knowledge-based component for all mammograms of the predicted breast type. This performance measure is computed differently for contrast enhancement and segmentation components as follows:
(a)Enhancement component: Performance is measured by the mean percentage improvement in the segmentation of the contrast-enhanced image compared to that of the unenhanced original for all mammograms of a given breast type.
(b)Segmentation component: Performance is measured by the mean area ( AZ ) under the ROC curve, for all mammograms of a given breast type. Use of this measure in evaluating the adaptive knowledge-based model reflects the underlying sensitivity and false-positive count across all ROC thresholds and has been used in other studies [41] to compare classification tasks.
A Knowledge-Based Scheme for Digital Mammography |
649 |
The following paragraphs briefly review the contrast enhancement and segmentation of digitized mammograms described in previous sections.
Contrast enhancement: The trained contrast enhancement knowledgebased component selects the optimal contrast enhancement method for a test mammogram, as one from a subset of six selected enhancement methods. Each of the enhancement methods has been described in section 11.3.2.1.1. The BPM strategy is used to implement the knowledge-based contrast enhancement component, and following training predicts the optimal enhancement method for a testing mammogram on the basis of an extracted feature vector. A different feature vector is used depending on the predicted breast type. A feature vector comprising a selected number of principal components FBP26 is used for mammograms of breast types 1–3. For breast type 4, the complete feature vector
FBP316 is used.
Segmentation: To segment a mammogram, the semisupervised WGMM constrained with a WGMMMRFS strategy is used. Ten different segmentation experts are trained and each one gives a segmentation decision for the test mammogram. The 10 experts have been trained to operate on specific groupings of input feature spaces. The experts for this configuration of the adaptive knowledge-based model are described in section 11.4.4. The decision of each expert is combined using a knowledge-based segmentation component implemented using the AWM described earlier. The AWM will predict the optimal blend of expert decisions to maximize the segmentation performance.
11.6.1.2 Results
This section presents the results from contrast enhancement and segmentation using 200 abnormal images, such that the image processing pipeline is constructed on the basis of the predicted breast type.
Knowledge-based contrast enhancement: From the results presented in Fig. 11.8, it can be seen the best performing expert is the FUZZY contrast enhancement method over all breast types. The average improvement in segmentation performance is 54% for all 200 abnormal images. Using the predicted optimal enhancement method from the knowledge-based contrast enhancement component, the average improvement in segmentation performance increases to 60%. The knowledge-based contrast enhancement component is determining the optimal enhancement based on component knowledge learnt during supervised
650 |
Singh and Bovis |
training. By utilizing this hidden knowledge, the resultant performance is improved compared with that obtained by simply using the single best contrast enhancement method, the FUZZY contrast enhancement method.
Knowledge-based mammogram segmentation: From the results presented in Fig. 11.8, it can be seen that the single best performing expert is the grayscale contrast enhancement method for all predicted breast types. The mean
AZ value is 0.65 for all 200 abnormal images. Using predicted optimal enhancement method from the knowledge-based segmentation component, the mean
AZ value rises to 0.72. Clearly in combining the decisions of each expert, the knowledge-based segmentation component is performing better than that obtained by selecting the single best performing expert. The outcome of each segmentation expert is considered when forming the optimal segmentation. The statistically motivated AWM component, determines optimal weights for each segmentation expert that are most likely to have given rise to a resultant combined single segmentation. By doing this, the resulting performance is improved over all other segmentation experts.
11.6.1.3 Overlap Analysis of Segmentation Results
The results in the previous section show that the performance obtained following ROC analysis of the knowledge-based segmentation component is greater than that obtained from the best performing segmentation expert. By thresholding each probability image using a ROC operating point following optimal expert combination, region boundaries can be identified. In general, the ROC operating point [40] can be selected for each individual mammogram by associating a cost for a false positive, CFP, and a false negative, CFN. In this chapter, the operating point cannot be determined using this method. This is because the ground truth knowledge cannot be used during testing.
To determine an estimate of the operating point, the mean operating point is calculated from all mammograms contained within a training fold. Only mammograms that following segmentation, give lesion detection with an operating point greater than 0.95 are considered. The mean operating point is calculated from each training fold, for each breast type. To compute each operating point, the relative cost of a false positive is chosen as CFP = 1 and for a false negative
CFN = 20. In addition, the probability of a positive outcome, P(D+) = 0.03, computed as the mean percentage of abnormal pixels in all training mammograms.


652 |
Singh and Bovis |
Table 11.17: Frequency of normal
and abnormal images
Type |
Abnormal |
Normal |
|
|
|
1 |
53 |
54 |
2 |
20 |
20 |
3 |
28 |
36 |
4 |
99 |
90 |
Total |
200 |
200 |
|
|
|
training set. The dataset is extended to include 200 normal images from four different breast types, 50 normal images drawn from each. The use of normal mammograms will demonstrate the specificity levels of the adaptive knowledgebased model. Table 11.17 shows the frequency of predicted breast groupings for normal and abnormal classes following breast type classification. The adaptive knowledge-based model is evaluated in its ability to provide an optimal segmentation for all the normal and abnormal mammograms.
11.6.2.2 Overlap Analysis of Segmentation Results
Using overlap analysis, both sensitivity and the average number of false-positives per image can be determined for each predicted breast group. The results from overlap analysis are shown in Table 11.18. From this table, it can be seen that the average number of false positives over all breast types has risen slightly with
Table 11.18: Sensitivity and average number of false positives per image after segmentation of 200 abnormal and 200 normal mammograms using the adaptive knowledge-based model
Type |
Sensitivity |
FP/i |
|
|
|
1 |
0.79 |
207.26 |
2 |
0.80 |
162.68 |
3 |
0.96 |
161.86 |
4 |
0.80 |
136.45 |
Mean |
0.84 |
167.01 |
|
|
|