

Kluwer - Handbook of Biomedical Image Analysis Vol
.2.pdfA Knowledge-Based Scheme for Digital Mammography |
603 |
an independent measure of contrast called “difference in average separation” that has been popularly used in other work.
11.3.1 Measures of Contrast Enhancement
11.3.1.1 Distribution Separation Measure
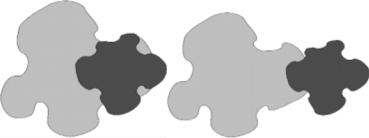
Using the method for labeling the Target (T ) and Background (B) regions, it is possible to plot the overlap of the density functions for the gray scales comprising these two regions. In mammography, this is representative of the overlap found between a breast cancer lesion and its background border. A good enhancement technique should ideally reduce the overlap. In particular, it is anticipated that the enhancement technique should help reduce the spread of the target distribution and shift its mean gray-scale level to a higher value thus separating the two distributions and reducing their overlap. The best decision boundary for the original image between the two classes, assuming both classes have a multivariate normal distribution with equal covariances, is given using [21] as
D |
1 |
= |
µOB · σTO + µOT · σBO |
(11.1) |
|
σTO · σTO |
|||||
|
|
Similarly, the best decision boundary for the original image after enhancement is given as
D |
2 |
= |
µEB · σTE + µET · σBE |
(11.2) |
|
σTE · σBE |
|||||
|
|
where µOB, σBO, µOT , and σTO are the mean and standard deviation of the gray scales comprising the background and target area, respectively, of the original image before enhancement. Similarly µEB, σBE, µET , and σTE correspond to the mean and standard deviation of the gray scales after the enhancement. An alternative approximation to D1 and D2 can be found using the cutting score [22]. If the groups are assumed to be representative of the population, a weighted average of the group centroids will provide an optimal cutting score where Eq. (11.1) is rewritten as
D |
1 |
= |
|
µOB · NTO + µOT · NBO |
(11.3) |
|
NTO · NBO |
||||||
|
|
|
604 |
|
|
|
|
Singh and Bovis |
|
and Eq. (11.2) is rewritten as |
|
|
|
|
|
|
D |
2 |
= |
|
µEB · NTE + µET · NBE |
(11.4) |
|
NTE · NBE |
||||||
|
|
|
where NBO and NTO are the number of samples in the background and target prior to enhancement, and NBE and NTE the respective sample numbers after the enhancement. Again this approximation assumes that the two distributions are normal and that the group dispersion structures are known. By combining the above two equations it is possible to compute a distance measure between the decision boundaries and the means of the targets and background, before and after segmentation. This measure is termed as the distribution separation measure (DSM), and it is a measure of the quality of enhancement. It is defined as
DSM = {|(D2 − µEB| + |(D2 − µET )|} − {|(D1 − µOB| + |(D1 − µOT )|} |
(11.5) |
Ideally the measurement should be greater than zero; the greater the DSM value, the better the quality of enhancement. For comparing any two enhancement techniques, choose the technique that gives a higher value on the DSM measure.
11.3.1.2Target to Background Contrast Enhancement Measurement Based on Standard Deviation
A key objective of a contrast enhancement is to maximize the difference between background and target mean gray level and ensure that the homogeneity of the mass is increased aiding the visualization of its boundaries and location. Using the ratio of the standard deviation of the gray-scales within the target before and after the enhancement, the improvement using the target to background contrast enhancement using standard deviation (TBCs) is given as
|
= |
9 |
σTE/σTO |
|
: |
TBCs |
|
|
(µET /µEB) − (µOT |
/µOB) |
(11.6) |
|
|
|
|
where the mean and standard deviation of the gray scales comprise the target and background before and after the enhancement. Assuming that the target has a smaller mean before and after enhancement compared to the background, it is expected that as a result of enhancement, this measure should give a value greater than zero.

A Knowledge-Based Scheme for Digital Mammography |
605 |
11.3.1.3Target to Background Contrast Enhancement Measurement Based on Entropy
It is possible to extend the concept of TBCs further by replacing the standard deviation with the entropy of the target in the original and enhanced images, εTO and εTE , respectively, to quantify the homogeneity ratio. Similar to Eq. (11.6) the target to background contrast enhancement using entropy (TBCε ) is defined as
9 :
TBCs = (11.7)
Assuming that the target has a smaller mean before and after enhancement compared to the background, it is expected that as a result of enhancement, this measure should give a value greater than zero.
11.3.1.4 The Combined Enhancement Measure
It is possible to combine the three novel measures into a single quantitative value. Using this combined measure, a researcher is able to quantitatively rank enhancements for a particular image. To combine DSM, TBCs, and TBCε for a particular enhancement, each enhancement value is represented within a 3-D Euclidean space by min–max scaling each within the range [0,1]. A high performance contrast enhancement method will have points close to coordinates (1, 1, 1). The combined measure D is computed by calculating the Euclidean distance between the point in the 3-D coordinate space representing the enhancement and (1, 1, 1). This point in the enhancement measurement space represents the location of an enhancement method that results in the maximal increase in contrast between a target and its background. The combined measure D is computed as
D = (1 − DSM)2 + (1 − TBCs)2 + (1 − TBCε )2 (11.8)
The enhancement method giving the smallest value of D is selected as the best enhancement method for this image.
11.3.1.5 Difference in Average Separation Measure
This measure is defined as the difference in average separation (AVS) [23] between the original and corresponding enhanced image. The average
606 |
Singh and Bovis |
separation is a measure of intergroup dissimilarity and is defined as the average Euclidean distance d between “confused pixels,” that is, pixels with the same gray scales found in both target and background regions. The AVS measure is defined as
1 |
n1 |
n2 |
|
|
|
|
|
|
|||
AVS(ω1, ω2) = |
|
i=1 |
j=1 d(xi, yj ) |
xi ω1 xj ω2 |
(11.9) |
n1n2 |
|||||
for all pairs of points such that a single point is drawn from each region, target
ω1 and background ω2 with n1 and n2 pixels in total respectively. A large value of AVSdiff will result if the enhanced image has a greater intergroup dissimilarity for gray scales in the target and background region compared with that of the original. This increased value of AVSenhanced indicates that the enhancement has maximized the Euclidean distance of the confused pixels thereby resulting in an improved contrast enhancement.
11.3.2Contrast Enhancement Mixture of Experts Framework
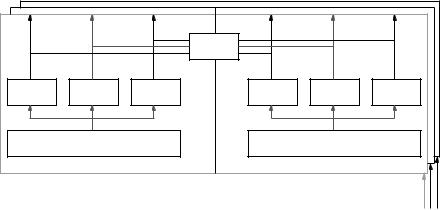
In CAD of breast lesions, one aim of contrast enhancement is to improve the performance in image segmentation. Therefore, the optimal contrast enhancement method for a mammogram is the one maximizing the sensitivity of the detection of a breast lesion following image segmentation. The proposed knowledgebased enhancement component will predict the optimal contrast enhancement method, or expert, for a test mammogram using knowledge learnt from a set of training mammograms. Figure 11.3 summarizes the enhancement component framework. Individual enhancement experts (1, . . . , n) are used in training and testing, shown on the left and right of Fig. 11.3, respectively. Experts are grouped together in training and testing for particular mammogram types. During training, an optimal enhancement expert is identified (say for example expert 2) and the mapping between a global characteristic of the training mammogram and the enhancement expert is captured as component knowledge. For the testing mammogram, the optimal expert can be predicted (which was expert 2) based on an image feature vector. Where possible, the a priori knowledge of the mammogram breast type will be used. Different parameterized versions of the knowledge-based contrast enhancement component are constructed for each breast type grouping.
A Knowledge-Based Scheme for Digital Mammography |
607 |
|
TRAINING |
|
|
TESTING |
|
|
|
|
Component |
|
|
|
|
|
knowledge |
|
|
Enhance. |
Enhance. |
Enhance. |
Enhance. |
Enhance. |
Enhance. |
expert 1 |
expert 2 |
expert n |
expert 1 |
expert 2 |
expert n |
Independent image training set |
|
Testing image |
|
||
Breast grouping knowledge
Figure 11.3:
This section describes the mixture of experts framework and it is laid out as follows. Section 11.3.2.1 reviews the contrast enhancement experts used to build the framework. Then the segmentation algorithm used to evaluate the enhanced images is briefly described together with quantitative measures of segmentation performance. In section 11.3.2.2 results are presented when applying the different image enhancement on DDSM images and the resulting segmentation from them. Section 11.3.2.3 discusses the features that can be extracted from the mammograms to be fed into a mapping scheme (e.g., neural networks) that maps features to optimal enhancement methods. Finally, section 11.3.2.4 discusses a machine learning system for this mapping. A neural network is used in two different modes: double network mapping and a single direct mapping scheme.
11.3.2.1Segmentation of Contrast-Enhanced Digitized Mammograms
The aim of the knowledge-based contrast enhancement component is to predict the optimal contrast enhancement for a given mammogram. The optimal contrast enhancement is the one maximizing the segmentation of the enhanced image. Segmentation performance is measured by the sensitivity in the detection of true-positive regions within the segmentation image. Section 11.3.2.1.1 identifies
608 |
Singh and Bovis |
the contrast enhancement methods used in this configuration of the adaptive knowledge-based model. Following this, sections 11.3.2.1.2 and 11.3.2.1.3 describe the segmentation method used to evaluate the performance of the contrast-enhanced image and quantitative evaluation of segmentation quality. Finally, section 11.3.2.1.4 identifies the optimal contrast enhancement that exists for each mammogram, providing evidence for the construction of a knowledgebased enhancement component to predict the optimal enhancement method.
11.3.2.1.1Contrast Enhancement Experts. The utility of six contrast enhancement methods are evaluated: histogram equalization (HISTOEQ), fuzzy enhancement (FUZZY), density weighted contrast enhancement (DWCE), adaptive contrast enhancement (ACE), adaptive contrast enhancement with local entropy (ACELE), and adaptive contrast enhancement with local fractal dimension (ACELFD). Each of these methods will be used as enhancement experts within this configuration of the knowledge-based framework. Full details on the their algorithms is available in [18].
11.3.2.1.2Segmentation Methods. The aim of image segmentation is to label a pixel in an image as belonging to one of the known corresponding real world objects. In the detection of breast lesions in digitized mammograms, image segmentation results in contiguous areas or regions of pixels, labeled as normal or suspicious. For the purpose of evaluating image enhancement, we use an unsupervised Gaussian mixture model (GMM) and hidden Markov random field (HMRFU) model of image segmentation proposed by Zhang et al. [24]. For ease of referencing, this shall be referred to as HMRFU in the rest of this chapter. The HMRFU segmentation method is used to segment contrast-enhanced images so that the performance of the contrast enhancement can be determined. The HMRFU segmentation algorithm operates in an unsupervised manner. The only
a priori knowledge required for the segmentation is the maximum number of classes, L, from which a pixel is labelled. By setting L = 2, HMRFU will label pixels as either normal or suspicious. The HMRFU method models each class using a single Gaussian whose parameters are defined using a maximum likelihood estimate. Followoing convergence, a maximum a posteriori (MAP) segmentation is performed by labeling each pixel with the class maximising the a posteriori probability estimates.

A Knowledge-Based Scheme for Digital Mammography |
611 |
||||
|
Table 11.3: Segmentation results from using |
||||
|
the original mammogram |
|
|
|
|
|
|
|
|
|
|
|
Type |
TPT |
SUBTPT |
Total |
|
|
|
|
|
|
|
1 |
0.25 |
0.04 |
0.29 |
|
|
2 |
0.18 |
0.11 |
0.29 |
|
|
3 |
0.20 |
0.04 |
0.23 |
|
|
4 |
0.15 |
0.02 |
0.16 |
|
|
|
Mean |
0.20 |
0.05 |
0.24 |
|
|
|
|
|
|
|
Values given are mean percentage of mass detected with TP and
SUBTP outcome together with their sum.
The target contrast enhancement Em is found for every mammogram from all
M enhancement methods, m {1, . . . , M), keeping the segmentation method and associated initialization parameters constant. Having identified each of the target enhancement experts, the following important observations can be made (see sections 11.3.3.2.1–11.3.2.2.6).
11.3.2.2.1Original vs. Contrast-Enhanced Mammograms. Each original unenhanced image is segmented and out of the 200 mammograms used, 80 (40%) images give no sensitivity in the detection of target regions, that is, for these images the value of (TPT + SUBTPT )≤ 0. Of these 80 unenhanced images, 34 still give no sensitivity in detection after application of each evaluated contrast enhancement method. Only the remaining 166 abnormal mammograms are considered in the evaluation of the optimal strategies described in the following sections. Table 11.3 presents the results from segmenting the original unenhanced mammograms grouped by breast type. The table shows the mean percentage of target region detected with each outcome, grouped by breast type. We observe that the segmentation performance decreases as the breast density increases.
11.3.2.2.2Improved Segmentation in Contrast-Enhanced Mammograms. Of the 200 mammograms used in this evaluation, 150 (75%) give a greater sensitivity after the target, contrast enhancement method, compared with the sensitivity obtained from the original images.
612 |
Singh and Bovis |
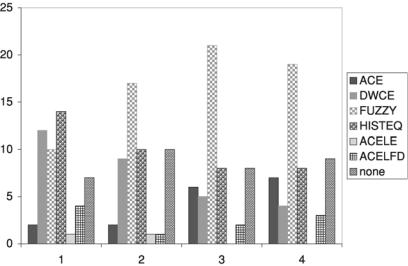
Figure 11.5: Frequency of each contrast enhancement method being selected as the target method for each mammogram grouped by breast type.
11.3.2.2.3Reduced Sensitivity in Enhanced Images. Of the 166 enhanced mammograms that give a positive sensitivity result, 12 (7%) reported an inferior (reduced) sensitivity on application of the target contrast enhancement method compared with the original mammogram. No attempt is made to learn that “no contrast enhancement” is best suited for these images because of the small sample number.
11.3.2.2.4Frequency of Optimal Contrast Enhancement Methods.
The target contrast enhancement for a given mammogram is defined above using Eq. (11.10). Figure 11.5 presents the frequency that each of the six enhancement method are identified as the target contrast enhancement for a mammogram, grouped according to its breast type. From this figure, it can be seen that each enhancement methods is a target optimum for at least one mammogram. The variability in choice of target method is greater in the fatty breast (breast types 1 and 2) cases compared to the dense types (types 3 and 4). Note that the proposed novel extension to the ACE combining fractal dimension, method ACELFD, outperforms the classic ACE method more frequently for the fatty breast types. Additionally, it should be noted that the HISTOEQ method outperforms all other