

evrop_integratsiya_09
.pdfThe average EU-25 share of R&D expenditure funded by the business enterprise sector is much lower than in Japan and the US. The contribution of the private sector to R&D financing has even decreased over recent years in the EU, whereas, on the other hand, it has been increasing in Japan. The overall trend to stagnation of R&D business funding has been determined by the economic downturn. However a clear distinction can be made between several groups of EU countries in terms of their affect upon the achieving the 2/3ds of business R&D financing objective (See Figure 4).
The R&D intensive countries Sweden, Finland, Denmark, Germany, Belgium and Slovenia are improving the share of R&D funded by the business sector. On the contrary France, Spain, the Netherlands and the Czech Republic experienced the trend to stagnation or even fall back of the business share. Greece, Portugal, Estonia and Austria are strongly catching-up with the rest of the EU. The fourth group (Latvia, Hungary, Lithuania, Slovakia, Poland and the UK) is falling behind the EU average.
Taking into consideration these data, EU and international studies, the European Commission proposed a fundamental revision of the original Lisbon strategy1, which found its further development in the Lisbon Action Plan2, were the Member States’ effort is proposed to focus on priority actions under three policy areas:
1) Making Europe a more attractive place to invest and work:
• Extend and deepen the internal market;
• Ensure open and competitive markets inside and outside Europe;
• Improve European and national regulation;
• Expand and improve European infrastructure; 2) Knowledge and innovation for growth:
• Increase and improve investment in Research and Development;
• Facilitate innovation, the uptake of ICT and the sustainable use of resources;
• Contribute to a strong European industrial base; 3) Creating more and better jobs:
•Attract more people into employment and modernise social protection systems;
•Improve the adaptability of workers and enterprises and the flexibility of labour markets;
•Invest more in human capital through better education and skills.
1 European Commission INTEGRATED GUIDELINES FOR GROWTH AND JOBS (20052008) including a COMMISSION RECOMMENDATION on the broad guidelines for the economic policies of the Member States and the Community (under Article 99 of the EC Treaty) and a Proposal for a COUNCIL DECISION on guidelines for the employment policies of the Member States (under Article 128 of the EC Treaty). Brussels, 19 April 2005. COM(2005) 141 final.
2. Companion document to the Communication to the Spring European Council: «Lisbon Action Plan incorporating EU Lisbon programme and recommendations for actions to member states for inclusion in their national Lisbon programmes», Brussels, 2 February 2005, SEC (2005) 192.
181

182
Figure 4. R&D intensity and annual growth rate 2000-20031
1 European Commission, Annex to Annual Report on Research and Technological Development Activities of the European Union in 2004, Luxembourg: Office for Official Publications of the European Communities, 2005 — PP. 26—29
182
Based on Commission Action Plan, European Council on March 2005 defined the three vital strands for the re-launch of the Lisbon Strategy: (1) gearing knowledge and innovation as the engines of sustainable growth,
(2) turning EU into an attractive area in which to invest and work, (3) fostering growth and employment making for social cohesion1. At the same time the Council proclaimed, that «the financial perspective for 2007—2013 will have to provide the Union with adequate funds to carry through the Union’s policies … including the policies that contribute to the achievement of the Lisbon priorities»2. The Council of Europe recognized innovation, R&D and improving the enterprise environment as the key areas for priority action. More in detail, in the Council Presidency Conclusions of the Spring 2006 summit3 it underlined the importance of investing more in knowledge creation and innovation, and placed the accent on developing the business environment conducive for the uptake of smalland medium-sized companies.
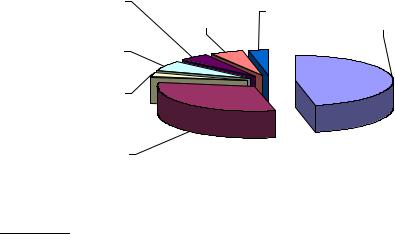
All the abovementioned priority areas found their reflection in the Financial Perspectives, approved by the European Council in December 20054. The new structure of appropriations in general resembles the one approved for the 2000-2006 period with several exceptions (See Figures 5 and 6).
4. External |
|
6. Compensations |
|
Action |
5. Administration |
for New Member |
1. Agriculture |
5,0% |
5,2% |
States |
46,7% |
3. Internal |
|
3,3% |
|
|
|
|
|
Policies |
|
|
|
6,6% |
|
|
|
2b Cohesion |
|
|
|
Fund |
|
|
|
2,8% |
|
|
|
2a Structural
Funds 30,3%
Figure 5. Structure of total appropriations
of the EU budget over the period 2000—2006, %5
1Presidency Conclusions, Brussels European Council. 22 and 23 March 2005. — PP. 3—11.
2Ibid — P. 2.
3Presidency Conclusions, Brussels European Council. 23 and 24 March 2006
4Financial Perspective 2007—2013, Brussels European Council. 19 December 2005.
5Author’s calculations on the base of Laffan B., Shackleton M., The Budget. Who Gets What, When and How. / Policy-Making in the European Union, H Wallace and W. Wallace (eds.), Oxford University Press, Oxford 2003, p.231.
183

4. EU as a global |
5. Administration |
6. Compensations |
||
|
player |
5,8% |
0,1% |
1a |
3b Citizenship |
5,8% |
|
|
Competitiveness |
|
|
|
||
0,4% |
|
|
|
for growth and |
3a Freedom, |
|
|
|
employment |
security and |
|
|
|
8,4% |
Justice |
|
|
|
|
0,8% |
|
|
|
|
|
|
1b Cohesion for |
|
|
|
2. Preservation and |
growth and |
|
|
|
management of |
employment |
|
|
|
natural resources |
35,7% |
|
|
|
43,0% |
|
|
|
Figure 6. Structure of total appropriations
of the EU budget over the period 2007—2013, %1
A new sub-heading «Competitiveness for growth and employment» was introduced in support of the action by the Member States to contribute to the goals of the Lisbon Strategy. It acquired 8,4% of the total appropriations for the period 2007—2013. This objective includes five broad spheres: research and technological development; connecting Europe through EU networks; education and training; promoting competitiveness in a fully integrated single market and the social policy agenda2.
Cohesion policy (under sub-heading 1b) — one of the most significant beneficiaries from the EU budget in 2007-2013) acquired some new priorities, among which «Regional competitiveness and employment» is most important for our further conclusions3. It accounts for 15,8% (or 48,789 million euros over 2007—2013) of «Cohesion for growth and employment» objective.
These changes, enforced by the international competitiveness challenges, indicate a shift of the EU social-and-economic developmental model towards a more liberal one, wherein entrepreneurship and innovations play the central part in the economic development. The idea is that, a wide range of current problems (high unemployment, low investment activity, insufficiency of R&D intensity etc. all resulting in low labor productivity and per capita GDP growth rates)
1 Author’s calculations on the base of Financial Perspective 2007—2013, Brussels European Council. 19 December 2005.
2Financial Perspective 2007—2013, Brussels European Council. 19 December 2005. — P. 5.
3Ibid — P. 8.
184

bear a high strategic risk of loosing by Europe its competitive status in the global arena. That is why social justice and cohesion in the EU has no other alternative, but to be based, in ever-growing progression, on the strong entrepreneurial base fueled by investment in innovations and human capital, building the knowledge-based economy and a knowledge value society.
As for the prospects of EU accession for candidate countries (Turkey, for instance) and other potential applicants (among which we point out Ukraine) they remain quite uncertain for the coming sevenyear period in the light of the abovementioned arguments. On the one hand, the accession is hardly possible in view of high economic cost of their absorption for the EU budget and in the context of the convergence criteria. On the other hand, as European economists suggest, Ukraine and Turkey together with Bulgaria and Romania could create a low-wage buffer zone and a strong link in the European supply chains as mighty tools for competition against low-cost Asian imports1.
In any case, the accession of new potential candidate-countries will not be an easy decision to make. The ratio between economic efficiency and social cohesion will be the mile-stone for making that kind of decisions both on the side of the EU and the potential New Member States (being a more complicated issue for the latter rather than for the EU).
1 Emerson, Michael et al., The Prospect of Deep Free Trade between the European Union and Ukraine, Centre for European Policy Studies Brussels, Institut fur Weltwirtschaft Kiel, International Centre for Policy Studies Kyiv, Centre for European Policy Studies, Brussels, 2006.
185
Questions to the case-study
1.What are the most significant reasons for the downturn in international competitiveness of the EU? Which Community policies might help to resolve the competitiveness problems that EU’s facing today?
2.How do you evaluate the Lisbon competitive strategy? Is it real to meet the Lisbon objectives? Is it worth implementing notwithstanding all or should Member States decline the strategy? Does the new Lisbon Action Plan, focused on three (instead of original eight Lisbon objectives) priority actions, mean the official refusal from the original Lisbon Strategy?
3.In what areas do the EU’s main competitors (the US and East Asian countries) outperform the Union by quite a wide margin? Does entrepreneurship and R&D play an important role in these processes? In what groups may the Member States be divided accounting for their R&D intensity?
4.Do You agree with the conclusions: «The changes, enforced by the international competitiveness challenges, indicate a shift of the EU social-and-economic developmental model towards a more liberal one, wherein entrepreneurship and innovations play the central part in the economic development … and social justice and cohesion in the EU has no other alternative but to be based, in ever-growing progression, on the strong entrepreneurial base fueled by investment in innovations and human capital, building the knowledge-based economy and a knowledge value society»? What counter-arguments to this conclusion could you suggest, and how could you support the existing high-class social protection systems dominating in the EU Member States?
5.What interconnections between social policy, on the one hand, and the research and industrial policies, on the other, are revealed in the case-study? Suggest your own scheme for resolving the problems, which Europe is facing nowadays.
186
BIBLIOGRAPHY
1.Communication from the Commission to the Council and the European Parliament «Building our common Future: Policy challenges and Budgetary means of the Enlarged Union 2007-2013», Brussels, 26.2.2004, COM(2004) 101 final/2. — P. 3
2.Companion document to the Communication to the Spring European Council: «Lisbon Action Plan incorporating EU Lisbon programme and recommendations for actions to member states for inclusion in their national Lisbon programmes», Brussels, 2 February 2005, SEC (2005) 192.
3.Emerson, Michael et al., The Prospect of Deep Free Trade between the European Union and Ukraine, Centre for European Policy Studies Brussels, Institut fur Weltwirtschaft Kiel, International Centre for Policy Studies Kyiv, Centre for European Policy Studies, Brussels, 2006.
4.European Commission «Five-Year Assessment of the European Union Research Framework Programs 1999—2003», Luxembourg: Office for Official Publications of the European Communities, 2005 — 36 pp.
5.European Commission INTEGRATED GUIDELINES FOR GROWTH AND JOBS (2005-2008) including a COMMISSION RECOMMENDATION on the broad guidelines for the economic policies of the Member States and the Community (under Article 99 of the EC Treaty) and a Proposal for a COUNCIL DECISION on guidelines for the employment policies of the Member States (under Article 128 of the EC Treaty). Brussels, 19 April 2005. COM(2005) 141 final.
6.European Commission, Annex to Annual Report on Research and Technological Development Activities of the European Union in 2004, Luxembourg: Office for Official Publications of the European Communities, 2005 — PP. 26—29
7.European Commission, Key Figures 2005. — Luxembourg: Office for Official Publications of the European Communities, 2005 — P. 7
8.Financial Perspective 2007—2013, Brussels European Council. 19 December 2005.
9.Kok W.(2004), Facing the Challenge: The Lisbon strategy for growth and employment, the High Level Group chaired by Wim Kok, November 2004.
10.Laffan B., Shackleton M., The Budget. Who Gets What, When and How. / Policy-Making in the European Union, H Wallace and W. Wallace (eds.), Oxford University Press, Oxford 2003, p.231
11.Presidency Conclusions, Brussels European Council. 22 and 23 March 2005. — PP. 3—11.
12.Presidency Conclusions, Brussels European Council. 23 and 24 March 2006.
13.Science and Engineering Indicators 2002 / National Science Board. — Arlington, VA: National Science Foundation, 2002 (NSB-02-1). — P.6-7
14.Stagnation of R&D intensity a major threat to the European knowledge-based economy, Brussels, 19 July 2005.
15.The Lisbon Review 2006: Measuring Europe’s Progress in Reform. Geneva: World Economic Forum, 2006. — P 5.
16.The new Integrated economic and employment guidelines, MEMO/05/123. Brussels, 12 April 2005.
187

КЕЙС «МОНЕТАРНА ПОЛІТИКА: ДОСВІД РЕФОРМ ПОЛЬЩІ ТА УГОРЩИНИ»
Д. О. Ільницький
Вступ
Актуальність вивчення досвіду проведення монетарної складової системної трансформації економіки сусідніх країн викликана як необхідністю вдосконалення національної грошовокредитної політики, так і потребою у підготовці до подальшого зближення економік України та ЄС, у процесі якого вітчизняна економіка повинна протистоятиме конкурентному тиску, одним з фронтів якого є валюта та монетарна політика.
На основі опрацювання запропонованого матеріалу та самостійної роботи, у тому числі у малих групах, студенти повинні отримати певний набір знань щодо особливостей розвитку економік сусідніх країн, зокрема їх монетарних політик, та поглибити свої практичні навички аналітичної роботи у сфері аналізу грошово-кредитної складової економічної системи та розробки пропозицій щодо вдосконалення монетарної політики України.
Практичне застосування матеріалів кейсу викладачем та студентами може бути побудоване за сценаріями, вибір яких передусім залежатиме від розміру групи студентів та ліміту часу, що може бути відведений на опанування цієї теми. По-перше, кожен
зстудентів може повністю ознайомитися з матеріалами кейсу та самостійно підготуватися до групової дискусії, в ході якої будуть дані відповіді на питання кейсу. По-друге, група може бути поділена на дві малі групи, кожна з яких опрацьовує загальний розділ та один з розділів, присвячений одній з країн. Після роботи над підготовкою відповідей до кейсу у малих групах має відбутися засідання всієї групи, на якому студенти, обмінюючись отриманими результатами, поглиблюють свої компетенції. По-третє, викладач може на власний розсуд сформувати міні-групи, кожна
зяких працюватиме над вузькою проблемою, а наприкінці — обмін думками на традиційному спільному засіданні повної групи.
Працюючи з матеріалами кейсу, студенти повинні звертати увагу як на самі зміни в монетарних політиках країн, так і на результати проведених реформ. Необхідно усвідомлювати й те, що монетарна політика, особливо в економіках країн, де ринкові пе-
188
ретворення перебувають в активній стадії, нерозривно взаємопов’язана з іншими складовими економічної політики урядів країн. Саме тому в процесі оцінки результатів монетарних реформ виникає потреба в поглибленому вивчені обраних країн та розвитку їх економік, що мало б спонукати студентів до самостійної роботи в цьому напрямі.
І. Загальні зміни
Польща й Угорщина — дві країни Центральної Європи, що динамічно розвиваються, — приєдналися до ЄС у травні 2004 року, хоча системна трансформація в них була здійснена за допомогою різних стратегій: «шокової терапії» та градуалістської. Ще у 1980-х роках у країнах були несприятливі економічні та політичні умови. В обох державах вирувала гіперінфляція, доволі високим був рівень зовнішньої заборгованості, ефективність роботи інституцій була низькою. У 1990-і роки країни почали ринкові перетворення в своїх економіках і першим таким заходом був перехід од фіксованого до вільного курсу валют [9], при цьому широко застосовувалися монетарні інструменти боротьби з інфляцією. Вважається, що Польща була успішнішою в приборканні інфляції, яка впродовж десяти років значно скоротилася — з 35 % у 1993-му до 1,9 % у 2002 році. Ці успіхи поєднувалися з ефективною політикою процентних ставок. Угорщина, незважаючи на значні економічні зусилля (контрольований валютний курс, який називали «повзаючим», та періодичну ревальвацію національної валюти — форинта) довго змагалася з високими рівнями інфляції.
В обох країнах відбувалися широкі дебати щодо економічної політики Бальцеровича — Голови Центрального банку Польщі, і Жарая — Голови Центрального банку Угорщини, та її результатів. Бальцеровича прозвали «батьком реформ» за ті зусилля, яких він доклав на шляху перетворення соціалістичної економіки у вільну ринкову економіку. Свої епітети щодо градуалізму угорці адресували Яношу Корнаї.
Аналітики погоджувалися, що Бальцерович досяг успіху з двох цілей монетарної політики — контрольованої процентної ставки та інфляції. На противагу йому Жарая, який ініціював реформи у тому ж напрямі, жорстко критикували за високі процентні ставки. Економіки цих країн були під постійним тиском з боку ЄС, чиновники з євроструктур докоряли невідповідністю
189

Маастрихтським критеріям, оскільки лідери цих держав не один раз заявляли про своє бажання приєднатися до Європейського монетарного союзу (ЄМС).
Маастрихтські критерії1 участі в ЄМС, вимагали досягнення: 1) рівня інфляції, який має бути близьким до того рівня, який де-
монструють три найкращі країни-члени; 2) державного бюджету, який має бути без надмірного дефіциту;
він не повинен перевищувати 3 % ВВП, а державний борг не повинен перевищувати 60 % ВВП;
3) збереження та розвитку інтеґрації, досягнутої країнами-члена- ми, що характеризується довгостроковими процентними ставками;
4) фіксованих рівнів коливання в межах механізмів обмінного курсу європейської валютної системи
Чимало західних фахівців вважало, що системна трансформація постсоціалістичних країн повинна складатися із чотирьох блоків [13, c. 168—170].
Перший з них стосувався макроекономічної стабілізації та контролю.
Другим блоком економічної модернізації була трансформація цін та ринку. Вона торкнулася реформи внутрішніх цін, лібералізації зовнішньої торгівлі, системи постачання (транспорт і маркетинґ) і житлового фонду. Обов’язковою умовою успішних реформ була лібералізація ринку робочої сили та значні зміни у структурі заробітної плати.
Третій блок стосувався розвитку приватного сектора, проведення комплексної приватизації майна та реформування виробничої структури. Уцихпостсоціалістичнихкраїнахз’явиласяприватнавласність, закони про банкрутство, про монополізацію, зокрема про державну. Утім, ці дві країни по-різному вирішували проблему власності на землю, промисловийкапітал, житловийфондінерухомість.
Четвертий блок стосувався перегляду ролі держави. Насамперед змінювалося законодавство, що стосувалося Конституції, майна, конкуренції тощо. У соціальній сфері запроваджувалося страхування від безробіття, нове пенсійне законодавство. Також здійснювалися реформи у системі охорони здоров’я та освіти.
У науковій літературі відзначається існування двох реалізаційних моделей трансформації постсоціалістичної економіки. Перша з них дістала назву «шокова терапія» Лєшика Бальцеро-
1 «Treaty on European Union». — Official Journal C 191, 29 July 1992, article 104, 109.
190