

evrop_integratsiya_09
.pdfLITERATURE
1.Волков А. Европейский экономический и валютный союз: предварительные итоги и перспективы развития // мировая экономика и международные отношения. — 2005. — № 5. — С. 3-15.
2.Європейський Союз. Консолідовані договори (1999). — К.: PortRoyal. — С. 98.
3.Мельянцев В. Информационная революция — феномен «новой экономики» // МЭиМО. — 2001. — №2, с.3-10.
4.Мусис Н. (2005). Усе про спільні політики Європейського Союзу.
—К.: КІС. — с. 110—111.
5.Рожков К.Л. Страновая и территориальная логистика. — М.: Научная книга, 2000. — 114 с.
6.Славнова А.О. Информационная экономика: становление и сущ-
ность: Дис…д-ра эк. наук: 08.00.01. — СПб.,1996. — с.64
7.Чужиков В., Божидарнік Н. Європейська модель ідентифікації реґіональних асиметрій // Україна: аспекти праці. — 2005. — № 6. —
С. 33—38.
8.«Digital divide forum report: broadband access and public support in under-served areas» // Commission of the European Communities, Brussels, 15.07.2005
9.A. Moravscik (1998). The Choice for Europe: Social Purpose and State Power from Messina to Maastricht. — NY: Cornell University Press.
—355 p.
10.Bridging the Broadband Gap // Communication from the Commission to the Council, the European Parliament, the European Economic and Social Committee and the Committee of the Regions, Brussels, 20.3.2006, р. 5.
11.Chuzhykov V., Ilnitsky D., Fedirko A. «Dualism of Monetary, Technological and Information Determinants in Social Development of EU».
—Rzeszow, Poland: «Nierownosci spoteczne a Wzrost Gospodarozy», № 11, 2007.
12.Cohen S., Zysman J. Manufacturing Matters: «The Myth of the PostIndustrial Economy». — New York: Basic books, 1987. — 268p.
13.Commission of the European Communities, Annex to the «Annual Report on Research and Technological Development Activities of the European Union in 2004», Brussels, 24.10.2005, SEC (2005) 1326.
14.Council Resolution on the implementation of the Europe 2005 Action Plan, Brussels, 28 January 2003
15.European Commission (2004),EU Economy Review 2004, Brussels.
16.European Commission (2004),The European Competitiveness Report 2004, Brussels.
17.European Commission, DG Research, «Key Figures 2005. Towards a European Research Area. Science, Technology and Innovation», Luxembourg: Office for Official Publications of the European Communities, 2005.
18.European Commission, Integrated Guidelines for Growth and Jobs (2005—2008), COM(2005)141.
171
19.European Innovation Scoreboard 2003 // European Commission Staff Working Paper SEC(2003) 1255. — Brussels, 2003. — 34p.
20.Furman J.L., Porter E., Stern S. The determinants of national innovative capacity // Research Policy. — 2002. — № 31. — P. 899—933.
21.G.Falkner (1998). Social Policy in the 1990s. Toward a Corporatist Police Community. — London: Routledge. — 443 p.
22.Garelli S. Competitiveness of Nations: The Fundamentals // World Competitiveness Yearbook. — Lausanne: IMD, 2005. — http://www01.imd.ch/wcy/fundamentals
23.Hart J.A. Rival Capitalists: International Competitiveness in the United States, Japan and Western Europe. — Ithaca: Cornell University Press, 1993. — 305 p.
24.http://epp.eurostat.ec.europa.eu
25.Information Society Benchmarking Report // EUROPEAN COMMISSION: Information society and media
26.Jarboe K.P., Atkinson R.D. The Case for Technology in the Knowledge Economy: R&D, Economic Growth, and the Role of Government. — Washington, D.C.: Progressive Policy Institute, 1998. — 12 p.
27.K.Dyson (1994). Elusive Union: The Process of Economic and Monetary Union in Europe. — London: Longman. — 370 p.
28.K.-J.Bieback (1991). Harmonization of Social Policy in the European Community // Les Cahies de Droit. — N 32/14. — P. 913-935.
29.L.Tsoukalis (1997). The New European Economy Revisited. — Oxford: Oxford University Press. — 425 p.
30.M.Rhodes, Y.Meny (eds) (1998). The Future of European Welfare. A New Social Contract. — London: Macmillan. — 421 p.
31.P.Ludlow (1982). The Making of the European Monetary System. — London: Butterworth. — 560 p.
32.Prokopenko J. Globalization, Competitiveness and Productivity Strategies: Enterprise and Management Development Working Paper. — EMD/22/E. Geneva: International Labor Organization, January 2000. — 22 p.
33.World Investment Report 2002: Transnational Corporations and
Export Competitiveness. UNCTAD. New-York and Geneva 2002. —
p.143—146.
34.Zagamé, P. (2004), 3 % d’effort de R&D en Europe en 2010: analyse des conséquences à l’aide du modèle Némésis, January 2004, Report to DG RTD.
172

CASE-STUDY «INNOVATION DETERMINANTS OF SOCIAL-AND-ECONOMIC COHESION
IN THE EUROPEAN UNION»
A. Fedirko
Methodical notice
The peculiarity of the case-study is connected with the complex approach focusing on a policy-mix rather than on separate specific policies. It is reflected in the following issues:
•The Lisbon strategy (2000—2010) and problems of preserving high international competitiveness for the EU Member States constitute the framework of the case-study;
•case-study helps students to understand complicated interconnections among the key European policies: social, industrial, research etc.;
•understanding of differences between the liberal and keynesian economic models is higtly required.
The aim of case-study is to develop complex analytical abilities and underslanding the role of supra-national EU policies in the process of building competitive advantages for the European economy.
Today the European Union faces the necessity to reconcile the main drivers of its social-and-economic development. This is mainly caused by the fact that Europe is loosing momentum in the international competition under the pressure of the USA (the main competitor), Japan and Asian «tigers» (Hong Kong, Taiwan, South Korea, Singapore etc.) as well as late industrializing economies such as China, India, Brazil etc.
Europe’s economic performance has been poor in relative terms. Since 1995, the growth rate for the EU-15 has averaged 2,2%, compared to a global average of 3,6% and 3,2% for the United States1. One of the main indicators of countries’ competitiveness is GDP per capita. During the last 30 years the EU GDP per capita constituted only 70% of the US level. Specific studies suggest that this constant gap in GDP per capita is mainly due to a slowdown in the growth of labour input and increased unemployment2.
1Communication from the Commission to the Council and the European Parliament «Building our common Future: Policy challenges and Budgetary means of the Enlarged Union 2007-2013», Brussels, 26.2.2004, COM(2004) 101 final/2. — P. 3.
2European Commission, Key Figures 2005. — Luxembourg: Office for Official Publications of the European Communities, 2005 — P. 7
173
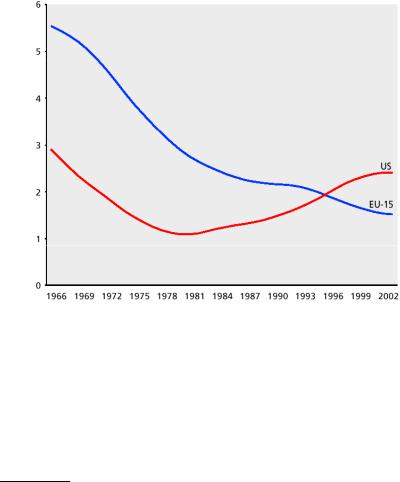
While the average growth of labour productivity per hour in Europe amounted to around 2,5% per year in the first half of the 1990s, well above the US growth rate, it then declined to 1,5% over 1996—2003 compared with an increase of an approximately similar amount in the US to 2,4% (See Figure 1). So, labour productivity in the US is now growing twice as fast as in Europe, and as a result thereof the relative levels of wealth in the EU also started slipping.
Figure 1. Labour productivity per hour growth trends (percentage change from previous year)1
Over the two last decades of the past century the world technology leaders were the United States and Japan, accounting together for more than 50% of the global high-tech market. As for the EU technology leaders in terms of absolute level of R&D expenditures (namely, UK, Germany, France and Italy) they experienced a significant decrease of their high-tech world market-shares. In the period of 1980—1998 the world exports hightech market share fell from 8% to 5,4% in Germany, from 6,7 to 5,4% in the UK, from 6,1 to 3,9% in France and from 2,7 to 1,6% in Italy2.
1 European Commission, Key Figures 2005. — Luxembourg: Office for Official Publications of the European Communities, 2005 — P. 16
2 Science and Engineering Indicators 2002 / National Science Board. — Arlington, VA: National Science Foundation, 2002 (NSB-02-1). — P.6-7
174

This was mainly due to the increase of competitive pressure from the East-Asian «tigers». Korea’s share in the same period almost tripled — growing from 1.1 to 3.1%, the same is true for Taiwan (a change from 1,3 to 3,3%), Singapore (a change from 0,7 to 2,6%) and China (a change from 0,6 to 2,9%)1.
In 2002, US high-tech industries accounted for more exports at world level than the EU or Japan, i.e. nearly 20 % in comparison to 16,7% and 10,6%, respectively (See Figure 2). However, the trend of market-share dynamics changed for the opposite one: world export share of EU hightech industries increased by 1,8% annually from 1997 to 2002, whereas the shares of Japan and the US decreased at average by 5,3% and 3,5%.
Figure 2. High-tech manufacturing industries — world market shares of exports2
The positive trend in Europe, however, is basically due to the development of high-tech production in the new Member States, a positive effect of enlargement, which also has positive spillovers for
1Science and Engineering Indicators 2002 / National Science Board. — Arlington, VA: National Science Foundation, 2002 (NSB-02-1). — P.6-7
2European Commission, Key Figures 2005. — Luxembourg: Office for Official Publications of the European Communities, 2005 — P. 67
175

older Member States, which are all out-performing the US with the exception of Sweden in terms of world high-tech exports share growth1.
In 2003, manufacturing exports were less technology intensive in the EU than in the US and Japan. High-tech industries accounted for 19,7% of total EU manufacturing exports, at the same time they constituted well above 25% of total manufacturing exports in Japan and the US.
The highest high-tech manufacturing exports share within the EU is characteristic for small-scale economies such as Malta, Ireland, Luxembourg and Hungary, where high-tech industries accounted for more than 30% of total manufacturing exports. These high scores are mostly due to the presence of large, export-oriented high-tech companies. At the same time, high-tech industries accounted for less than 13% of total manufacturing exports in the most of the other new Member States and southern European countries2. The more so, the US and Japan have a structural trade surplus in high-tech branches, and the EU is suffering (with a small exception) a structural trade deficit in these industries3.
Other reasons indicating the downturn in the EU international competitiveness are as follows4:
—the average growth rate for investment constituted a mere 1,7% per year compared with 5,4% per year in the USA;
—the EU under-invests in R&D, as the USA are spending about €100 billion more on R&D than Europe;
—the EU has only 25% of the number of patents per capita found in the USA;
—while in the USA 32% of population has university or similar degree, this percentage stands at only 19% in Europe;
—the USA invests about twice the amount per student as most European countries;
—in 2004 the average growth of the Euro area was only 2,2%, while the US economy grew by 4,3%, Japan by 4,4%, India by 6,4% and China by 9%.
Accounting for these and other arguments in March, 2000, the Lisbon European Council of the Heads of State and Government set a strategic objective for the European Union «to become the most competitive and
1Ibid — P. 66.
2European Commission, Key Figures 2005. — Luxembourg: Office for Official Publications of the European Communities, 2005 — P. 67.
3Ibid — P. 68.
4The new Integrated economic and employment guidelines, MEMO/05/123. Brussels, 12 April 2005.
176

dynamic knowledge-based economy in the world capable of sustainable economic growth with more and better jobs and greater social cohesion» over the next ten years1. Innovation policy acquired a central role in the process of building a knowledge-based economy. Later on, in March, 2002, the Barcelona European Council of Heads of State and Government determined that R&D investment in the European Union should be increased to approximately 3% of GDP by 2010 (that is one percentage point higher than the 2000 year level). Business investment in R&D are supposed to contribute two-thirds of the gross EU indicator.
However an analysis conducted by the High Level Group headed by Wim Kok in 2004 showed that there were significant shortcomings and obvious delays in meeting Lisbon objectives2. Other important indicator of the EU progress towards the Lisbon targets is the Lisbon Review, published by the World Economic Forum biannually.
Based on the results of the WEF Lisbon Review three top-ranked countries — Denmark, Finland and Sweden — retain their places as the countries best meeting the Lisbon goals to date. The overall list of the top ten performers remains almost the same compared to the previous 2004 review3 (See Table 1). Notably the results of the EU-15 members remain quite stable, with the exception of Portugal’s four-places-improvement, and a drastic downfall of Italy (moving 10 places down to be ranked the 24th).
As for the EU-10 accession countries (of May 2004), over the past couple of years their comparative performance has been improved. More over, a number of recent members moved even closer to meeting the Lisbon goals than many of the original EU-15 members. This may be explained by the fact, that for more than a decade the Central and East European countries have been engaged in a process of reform aimed at adopting the institutions and mechanisms of market economy, which has been reinforced within the context of EU accession negotiations4.
However, comparing the EU performance against its main competitors (the US and East Asian countries) uncovers significant gaps in the development of an information society, innovation and R&D and enterprise environment, all areas in which both East Asia and the US outperform the EU by a wide margin5. That is why the above-mentioned
1 European Commission «Five-Year Assessment of the European Union Research Framework Programs 1999—2003», Luxembourg: Office for Official Publications of the European Communities, 2005.
2Kok W.(2004), Facing the Challenge: The Lisbon strategy for growth and employment, the High Level Group chaired by Wim Kok, November 2004.
3The Lisbon Review 2006: Measuring Europe’s Progress in Reform. Geneva: World Economic Forum, 2006. — P 5.
4Ibid
5Ibid — P. 8.
177
areas require urgent attention from EU member-countries in the strive of turning into the most competitive economy in the world.
Table 1
LISBON REVIEW RANKING AND SCORES
OF EU COUNTRIES — 2006 AND 2004
Country (EU-25) |
2006 |
2004 |
|
|
|
||
Rank |
Rank |
||
|
|||
|
|
|
|
Denmark |
1 |
2 |
|
Finland |
2 |
1 |
|
Sweden |
3 |
3 |
|
Netherlands |
4 |
5 |
|
Germany |
5 |
6 |
|
United Kingdom |
6 |
4 |
|
Austria |
7 |
9 |
|
Luxemburg |
8 |
7 |
|
France |
9 |
8 |
|
Belgium |
10 |
10 |
|
Ireland |
11 |
11 |
|
Estonia |
12 |
12 |
|
Portugal |
13 |
17 |
|
Czech Republic |
14 |
19 |
|
Spain |
15 |
13 |
|
Slovenia |
16 |
15 |
|
Hungary |
17 |
20 |
|
Slovak Republic |
18 |
23 |
|
Malta |
19 |
18 |
|
Lithuania |
20 |
21 |
|
Cyprus |
21 |
- |
|
Latvia |
22 |
16 |
|
Greece |
23 |
22 |
|
Italy |
24 |
14 |
|
Poland |
25 |
24 |
|
|
|
|
Let us take a closer look at the innovation policy component and the reasons of poor performance of most of the EU-members on the way to meeting the Lisbon targets. At EU-25 level, the average annual
178

growth rate in R&D intensity between 2000 and 2003 (0,7%) was higher than that of the US. As a result, the EU-25 has been catching up with the US since 20001. However, China’s R&D intensity grew at about 10% per year between 1997 and 2002. If the trends for the EU and China continue, the latter will be spending the same amount of GDP on R&D as the EU in 2010 — about 2,2%2.
The analysis of R&D intensity evolution in the EU in the period of 2000-2003 allows to divide Member States into four groups, each of which impacts the progress towards the 3% objective in its own way (See Figure 3). The overall trend towards stagnation in the EU R&D intensity is defined by the three biggest investors — France, the UK and to a lesser extent Germany3. The second group consists of innovation and R&D top-performing countries (Sweden, Denmark, Austria and Belgium) which altogether are pulling ahead of the EU average. Their total weight, however, is far less than that of the first group. As for Finland — traditional R&D leader — it has seen its R&D intensity stagnating since 2000. A third group with Cyprus, Estonia, Hungary, Lithuania, Spain, Italy and Slovenia are rapidly catching up with the rest of the EU. Their impact on the overall R&D-intensity is also small4. A fourth group consisting of Latvia, Poland, Slovakia, Greece, Portugal and Ireland is falling behind the EU average.
In 2002, business financed only 55,6% of domestic R&D expenditure in the EU, compared to 63,1% in the US and 73,9% in Japan. And this share shows a downfall trend for the European Union. The most worrying conclusion of the latest European Commission R&D statistics, however, is that the European Union is becoming a less attractive place to invest and carry out research. Between 1997 and 2002, R&D expenditure by EU companies in the US increased much faster than R&D expenditure by US firms in the EU (54% compared to 38%), as the result the net imbalance in favor of the US increased five-fold from about €300m in 1997 to almost €2b in 20025.
1 European Commission, Annex to Annual Report on Research and Technological Development Activities of the European Union in 2004, Luxembourg: Office for Official Publications of the European Communities, 2005 — PP. 26—29
2Stagnation of R&D intensity a major threat to the European knowledge-based economy, Brussels, 19 July 2005.
3European Commission, Annex to Annual Report on Research and Technological Development Activities of the European Union in 2004, Luxembourg: Office for Official Publications of the European Communities, 2005 — PP. 26—29
4Ibid.
5Stagnation of R&D intensity a major threat to the European knowledge-based economy, Brussels, 19 July 2005.
179

180
Figure 3. R&D intensity and annual growth rate 2000—20031
1 European Commission, Annex to Annual Report on Research and Technological Development Activities of the European Union in 2004, Luxembourg: Office for Official Publications of the European Communities, 2005 — PP. 26—29
180