

s90mec7
.pdfMAN B&W |
2.04 |
|
|
Line 6:
Propeller curve, clean hull and calm weather
– light running, used for propeller layout/design (i = 3).
Line 7:
Represents the maximum power for continuous operation (i = 0).
Limits for overload operation
The overload service range is limited as follows:
Line 8:
Represents the overload operation limitations.
The area between lines 4, 5, 7 and the heavy dashed line 8 is available for overload running for limited periods only (1 hour per 12 hours).
Line 9:
Speed limit at sea trial.
The area between lines 4, 5, 7 and the heavy dashed line 8 is available for overload running for limited periods only (1 hour per 12 hours).
Limits for low load running
As the fuel injection and exhaust gas valve timing are optimised automatically over the entire power range, the engine is able to operate down to around 15% of the nominal L1 speed.
Page of 11
Recommendation
Continuous operation without limitations is allowed only within the area limited by lines 4, 5, 7 and 3 of the load diagram, except for CP propeller plants mentioned in the previous section.
The area between lines 4 and 1 is available for operation in shallow waters, heavy weather and during acceleration, i.e. for non steady operation without any strict time limitation. After some time in operation, the ship’s hull and propeller will be fouled, resulting in heavier running of the propeller, i.e. the propeller curve will move to the left from line 6 towards line 2, and extra power is required for propulsion in order to keep the ship’s speed.
In calm weather conditions, the extent of heavy running of the propeller will indicate the need for cleaning the hull and possibly polishing the propeller.
Once the specified MCR (and the matching point) have been chosen, the capacities of the auxiliary equipment will be adapted to the specified MCR, and the turbocharger specification and the compression ratio will be selected.
If the specified MCR (and/or the matching point) is to be increased later on, this may involve
a change of the pump and cooler capacities, change of the fuel valve nozzles, adjusting of the cylinder liner cooling, as well as rematching of the turbocharger or even a change to a larger size of turbocharger. In some cases it can also require larger dimensions of the piping systems.
It is therefore of utmost importance to consider, already at the project stage, if the specification should be prepared for a later power increase. This is to be indicated in the Extent of Delivery.
MAN B&W ME/ME-C/ME-GI engines
MAN Diesel |
198 38 97-3.6 |
|

MAN B&W |
2.04 |
|
|
Page |
of 11 |
Extended load diagram for ships operating in extreme heavy running conditions
When a ship with fixed pitch propeller is operating in normal sea service, it will in general be operating in the hatched area around the design propeller curve 6, as shown on the standard load diagram in Fig. 2.04.02.
Sometimes, when operating in heavy weather, the fixed pitch propeller performance will be more heavy running, i.e. for equal power absorption of the propeller, the propeller speed will be lower and the propeller curve will move to the left.
As the low speed main engines are directly coupled to the propeller, the engine has to follow the propeller performance, i.e. also in heavy running propeller situations. For this type of operation, there is normally enough margin in the load area between line 6 and the normal torque/speed limitation line 4, see Fig. 2.04.02. To the left of line 4 in torque rich operation, the engine will lack air from the turbocharger to the combustion process, i.e. the heat load limits may be exceeded and bearing loads might also become too high.
For some special ships and operating conditions, it would be an advantage when occasionally needed to be able to operate the propeller/main engine as much as possible to the left of line 6, but inside the torque/speed limit, line 4.
Such cases could be for:
•ships sailing in areas with very heavy weather
•ships operating in ice
•ships with two fixed pitch propellers/two main engines, where one propeller/one engine is declutched for one or the other reason.
The increase of the operating speed range between line 6 and line 4 of the standard load diagram, see Fig. 2.04.02, may be carried out as shown for the following engine Example with an extended load diagram for speed derated engine with increased light running:
•Extended load diagram for speed derated engines with increased light running.
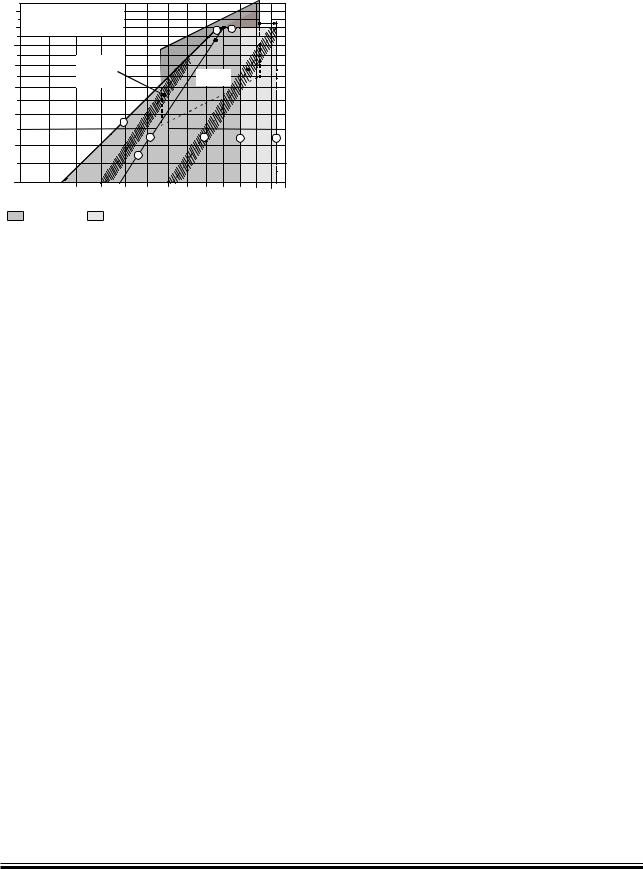
Extended load diagram for speed derated engines with increased light running
The maximum speed limit (line 3) of the engines is 105% of the SMCR (Specified Maximum Continuous Rating) speed, as shown in Fig. 2.04.02.
However, for speed and, thereby, power derated engines it is possible to extend the maximum speed limit to 105% of the engine’s nominal MCR speed, line 3’, but only provided that the torsional vibration conditions permit this. Thus, the shafting, with regard to torsional vibrations, has to be approved by the classification society in question, based on the extended maximum speed limit.
When choosing an increased light running to be used for the design of the propeller, the load diagram area may be extended from line 3 to line 3’, as shown in Fig. 2.04.03, and the propeller/main engine operating curve 6 may have a correspondingly increased heavy running margin before exceeding the torque/speed limit, line 4.
A corresponding slight reduction of the propeller efficiency may be the result, due to the higher propeller design speed used.
MAN B&W ME/ME-C/ME-GI engines
MAN Diesel |
198 38 97-3.6 |
|
MAN B&W |
2.04 |
|
|
|
%NGINEæSHAFTæPOWERæ |
æ! |
|
|
|
|
|
, |
|
||
|
!ææ |
æREFERENCEæPOINT |
|
|
|
|
|
|
|
||
|
-ææ3PECIFIEDæENGINEæ-#2 |
|
|
|
|
|
|
||||
/ææ/PTIMISING MATCHINGæPOINT |
|
|
|
|
|
|
|||||
|
|
|
|
|
|
, |
|
|
|
|
|
|
|
|
|
|
|
|
|
|
|
|
|
|
|
|
(EAVYæ |
|
|
|
|
|
|
|
|
|
|
RUNNINGæ |
|
|
|
|
|
|
|
||
|
|
|
|
|
|
|
|
, |
|
||
|
|
|
OPERATION |
|
|
|
|
|
|
||
|
|
|
|
|
|
|
|
|
|
|
|
|
|
|
|
|
|
|
|
|
|
|
|
|
|
|
|
|
|
, |
|
|
|
|
|
|
|
|
|
|
|
|
|
|
|
||
|
|
|
|
|
|
|
|
|
|
|
|
|
|
|
|
|
|
|
|
|
|
|
|
|
|
|
|
|
|
|
|
|
|
|
|
|
|
|
|
|
|
|
|
|
|
|
|
|
|
|
|
|
|
|
|
|
|
|
|
|
|
|
|
|
|
|
|
|
жжжжжжжж%NGINEжSPEED ж |
æ! |
|
|
.ORMALæLOADæ |
|
%XTENDEDæLIGHTææ |
|
|
|
|
|
|||
|
DIAGRAMæAREA |
|
RUNNINGæAREA |
|
|
|
|
|
|||
Line 1: Propeller curve through matching point (O) layout curve for engine
Line 2: Heavy propeller curve
fouled hull and heavy seas Line 3: Speed limit
Line 3’: Extended speed limit, provided torsional vibration conditions permit
Line 4: Torque/speed limit
Line 5: Mean effective pressure limit
Line 6: Increased light running propeller curve
clean hull and calm weather
layout curve for propeller
Line 7: Power limit for continuous running
178 52 25 6.0
Fig. 2.04.03: Extended load diagram for speed derated engine with increased light running
Page of 11
Examples of the use of the Load Diagram
In the following are some examples illustrating the flexibility of the layout and load diagrams and the significant influence of the choice of the matching point O.
•Example 1 shows how to place the load diagram for an engine without shaft generator coupled to a fixed pitch propeller.
•Example 2 are diagrams for the same configuration, but choosing a matching point on the left of the heavy running propeller curve (2) providing an extra engine margin for heavy running similar to the case in Fig. 2.04.03.
•Example 3 shows the same layout for an engine with fixed pitch propeller (example 1), but with a shaft generator.
•Example 4 is a special case of example 3, where the specified MCR is placed near the top of the layout diagram.
In this case the shaft generator is cut off, and the GenSets used when the engine runs at specified MCR. This makes it possible to
choose a smaller engine with a lower power output.
•Example 5 shows diagrams for an engine coupled to a controllable pitch propeller, with or without a shaft generator.
•Example 6 shows where to place the matching point for an engine coupled to a controllable pitch propeller.
For a specific project, the layout diagram for actual project shown later in this chapter may be used for construction of the actual load diagram.
MAN B&W ME/ME-C/ME-GI engines
MAN Diesel |
198 38 97-3.6 |
|
MAN B&W |
2.04 |
|
|
Page |
of 11 |
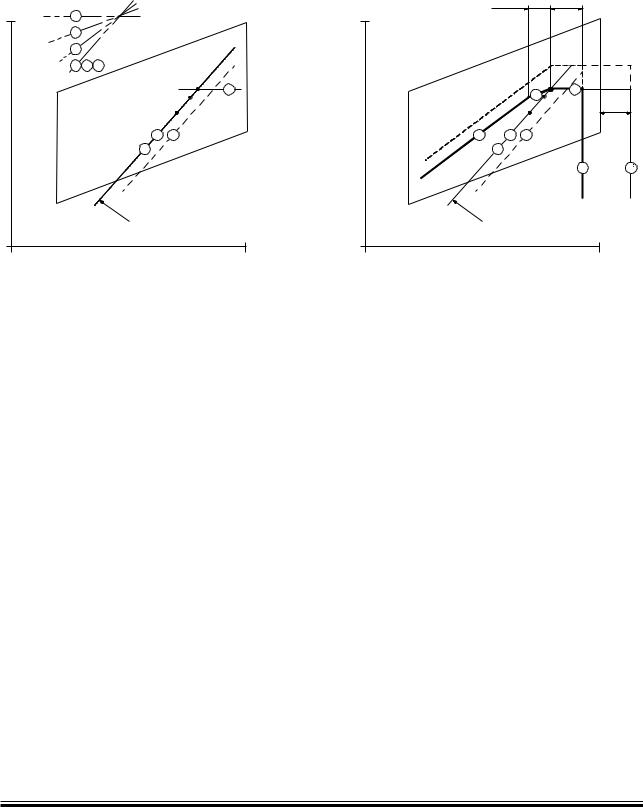
Example 1:
Normal running conditions. Engine coupled to fixed pitch propeller (FPP) and without shaft generator
0OWER æ æOFæ, |
|
|
|
|
|
|
|
|
|
|
|
|
, |
|
|
|
|
|
|
|
|
|
|
|
|
|
|
|
|
|
|
|
|
|
|
|
|
|
|
|
|
, |
|
|
|
! - -0 |
|
|
|
|
|
|
/ |
||
|
|
|
|
|
|
|
|
|
|
|
3 30 |
|
|
|
|
|
|
|
|
, |
|
|
|
|
|
|
|
|
|
|
|
|
|
|
, |
|
|
0ROPULSIONæANDæENGINE |
|
||
|
|
|
SERVICEæCURVEæFORæFOULED |
|
||
|
|
|
HULLæANDæHEAVYæWEATHER |
|
||
|
|
|
%NGINEæSPEED æ |
æOFæ, |
|
|
0OWER æ æOFæ, |
|
! |
|
|
! |
|
|
|
|
||||
|
|
|
|
|
, |
|
|
|
|
|
|
||
, |
|
|
! - |
|
|
|
|
|
|
|
|
||
|
|
|
/ |
|
, |
|
|
|
|
3 |
|
||
|
|
|
|
|
|
|
|
|
|
|
|
, |
|
|
|
|
|
|
||
|
|
|
|
|
|
|
|
|
|
|
|
|
|
, |
0ROPULSIONæANDæENGINE |
|
|
|||
|
SERVICEæCURVEæFORæFOULED |
|
|
|||
|
HULLæANDæHEAVYæWEATHER |
|
|
|||
|
%NGINEæSPEED æ |
æOFæ, |
|
|
|
|
MSpecified MCR of engine
S Continuous service rating of engine
OMatching point of engine
AReference point of load diagram
MP |
Specified MCR for propulsion |
SP |
Continuous service rating of propulsion |
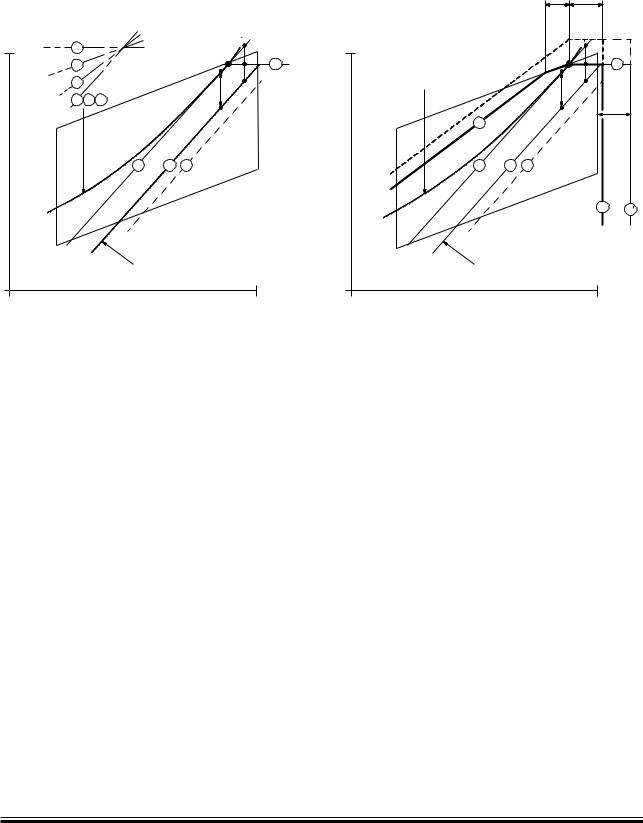
Example 1, Layout diagram for normal running conditions, engine with FPP, without shaft generator
For ME engines, the matching point O and its propeller curve 1 will normally be selected on the engine service curve 2.
Point A is then found at the intersection between propeller curve 1 (2) and the constant power curve through M, line 7. In this case point A is equal to point M.
Point A of load diagram is found:
Line 1 Propeller curve through matching point (O) is equal to line 2
Line7 ConstantpowerlinethroughspecifiedMCR(M) Point A Intersection between line 1 and 7
178 55 82-5.0
Example 1, Load diagram for normal running conditions, engine with FPP, without shaft generator
Once point A has been found in the layout diagram, the load diagram can be drawn, as shown in the figure, and hence the actual load limitation lines of the diesel engine may be found by using the inclinations from the construction lines and the % figures stated.
MAN B&W ME/ME-C/ME-GI engines
MAN Diesel |
198 38 97-3.6 |
|
MAN B&W |
2.04 |
|
|
Page |
of 11 |
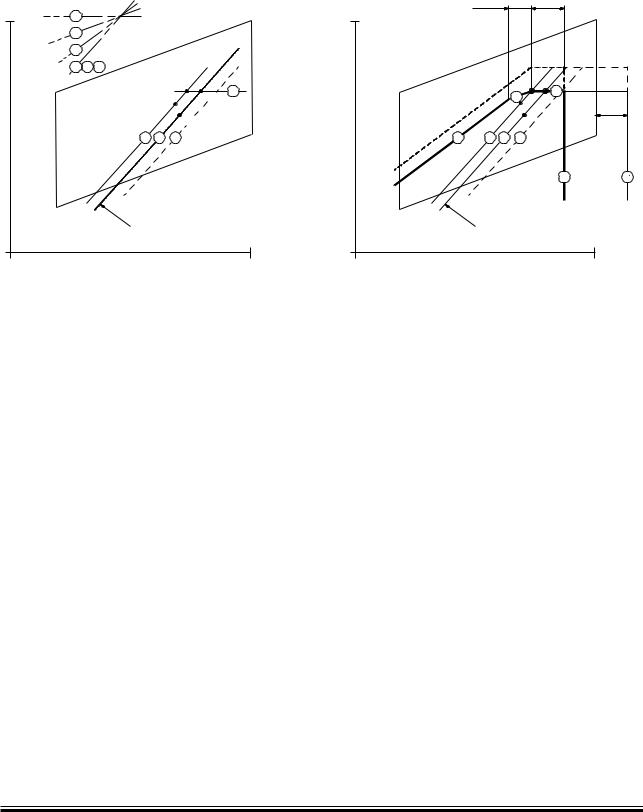
Example 2:
Special running conditions. Engine coupled to fixed pitch propeller (FPP) and without shaft generator
0OWER æ æOFæ, |
|
|
|
|
|
|
|
|
|
|
|
|
|
|
|
|
|
|
|
|
|
|
|
|
|
|
|
|
|
|
|
|
|
|
|
|
|
|
|
|
|
, |
|
|
|
|
! |
|
|
|
|
/ |
- -0 |
||
|
|
|
|
|
3 30 |
|
|
|
|
|
|
|
|
, |
|
|
0ROPULSIONæANDæENGINE |
|
||
|
|
|
SERVICEæCURVEæFORæFOULED |
|
||
|
|
|
HULLæANDæHEAVYæWEATHER |
|
||
|
|
%NGINEæSPEED æ |
æOFæ, |
|
|
|
0OWER æ æOFæ, |
|
! |
|
|
! |
|
|
|
|
||||
|
|
|
|
|
, |
|
, |
|
|
|
|
||
, |
|
|
! |
|
|
|
|
|
|
- |
|
||
|
|
|
|
|
||
|
|
|
/ |
|
|
, |
|
|
|
|
|
||
|
|
|
3 |
|
|
|
|
|
|
|
|
, |
|
, |
|
|
|
|
||
|
|
|
|
|
|
|
, |
0ROPULSIONæANDæENGINE |
|
||||
|
SERVICEæCURVEæFORæFOULED |
|
||||
|
HULLæANDæHEAVYæWEATHER |
|
||||
%NGINEæSPEED æ |
æOFæ, |
|
|
|
||
MSpecified MCR of engine
S Continuous service rating of engine
OMatching point of engine
AReference point of load diagram
MP |
Specified MCR for propulsion |
SP |
Continuous service rating of propulsion |
Example 2, Layout diagram for special running conditions, engine with FPP, without shaft generator
In this case, the matching point O has been selected more to the left than in example 1, providing an extra engine margin for heavy running operation in heavy weather conditions. In principle, the light running margin has been increased for this case.
Point A of load diagram is found:
Line 1 Propeller curve through matching point (O) is equal to line 2
Line 7 ConstantpowerlinethroughspecifiedMCR(M) Point A Intersection between line 1 and 7
178 55 83-7.0
Example 2, Load diagram for special running conditions, engine with FPP, without shaft generator
MAN B&W ME/ME-C/ME-GI engines
MAN Diesel |
198 38 97-3.6 |
|
MAN B&W |
2.04 |
|
|
Page |
of 11 |
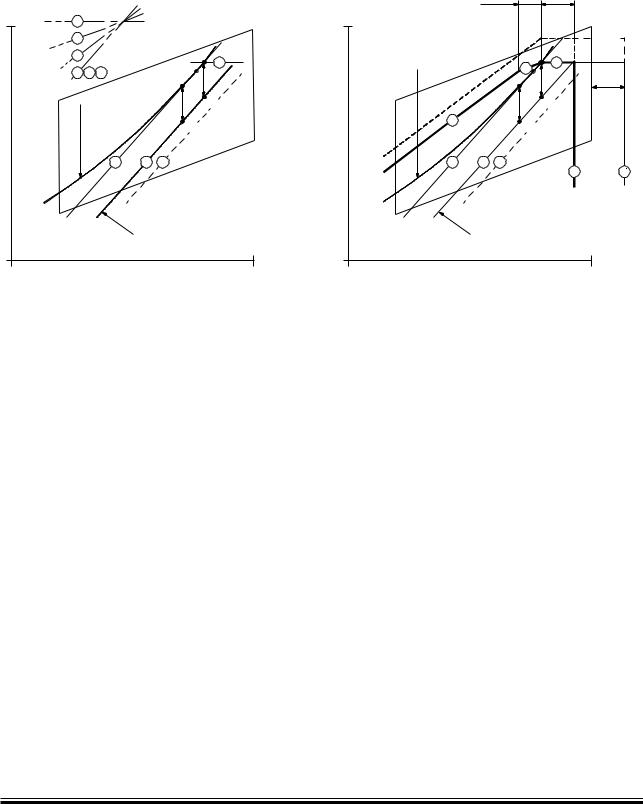
Example 3:
Normal running conditions. Engine coupled to fixed pitch propeller (FPP) and with shaft generator
0OWER æ æOFæ, |
|
|
|
|
|
|
|
|
|
|
|
|
|
|
|
|
|
|
|
|
|
! - |
|
|
|
|
|
/ |
|
|
|
|
|
|
|
|
|
|
3' |
||
, |
|
|
|
3 |
|
|
|
|
|
||
|
|
|
3' |
-0 |
|
|
|
%NGINE |
|
||
|
|
|
|
|
|
|
|
SERVICE |
|
30 |
|
|
|
CURVE |
|
|
|
|
|
|
|
|
|
, |
|
|
0ROPULSIONæCURVEæFORæFOULED |
||
|
|
|
|||
|
|
|
HULLæANDæHEAVYæWEATHER |
||
|
|
%NGINEæSPEED æ |
æOFæ, |
|
|
0OWER æ |
æOFæ, |
|
! |
|
|
! |
|
|
|
|
|
|
|
|
|
||
|
|
|
|
|
|
|
, |
|
, |
%NGINEæSERVICEæCURVEæFOR |
|
|
|
|
|
||
|
|
|
|
|
|
|
|
|
|
FOULEDæHULLæANDæHEAVY |
|
|
|
! - |
|
|
|
|
WEATHERæINCL æSHAFT |
|
|
|
|
|
|
|
|
|
|
|
|
|
|
||
|
GENERATOR |
|
|
|
|
|
|
|
|
|
|
|
/ |
|
|
|
|
|
, |
|
|
|
|
|
, |
|
|
|
|
|
3 |
|
|||
|
|
|
|
|
|
|
||
|
|
|
|
|
-0 |
|
|
|
|
|
|
|
|
|
|
|
|
|
|
|
|
|
30 |
|
|
|
|
|
|
|
|
|
|
|
|
, |
|
|
|
|
|
|
, |
|
|
|
|
|
|
|
|||
|
|
|
|
|
|
|
||
|
, |
0ROPULSIONæCURVEæFORæFOULED |
|
|||||
|
|
|
||||||
|
|
HULLæANDæHEAVYæWEATHER |
|
|
||||
|
%NGINEæSPEED æ |
æOFæ, |
|
|
|
|
||
MSpecified MCR of engine
S Continuous service rating of engine
OMatching point of engine
AReference point of load diagram
MP |
Specified MCR for propulsion |
SP |
Continuous service rating of propulsion |
SG |
Shaft generator power |
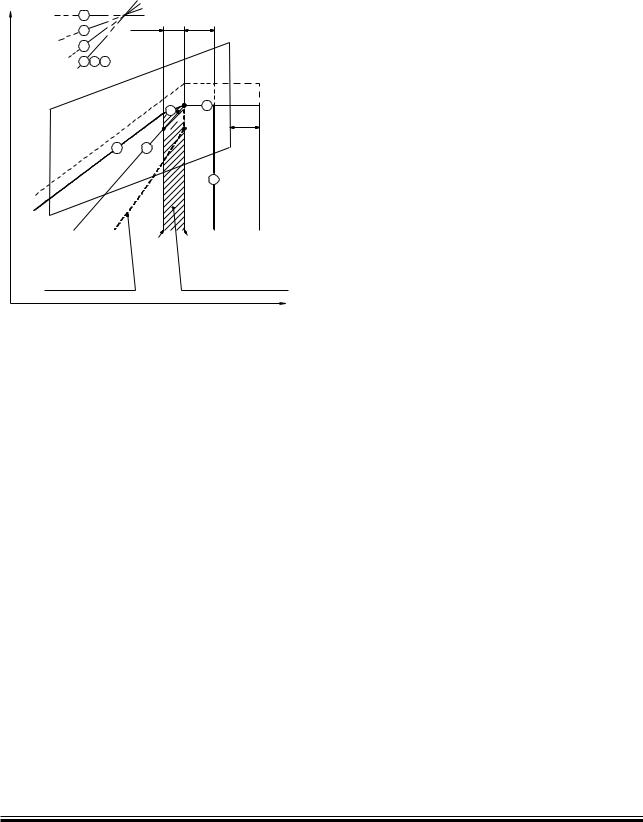
Example 3, Layout diagram for normal running conditions, engine with FPP and with shaft generator
In example 3 a shaft generator (SG) is installed, and therefore the service power of the engine also has to incorporate the extra shaft power required for the shaft generator’s electrical power production.
In the figure, the engine service curve shown for heavy running incorporates this extra power.
Point A of load diagram is found:
Line 1 Propeller curve through matching point (O) Line7 ConstantpowerlinethroughspecifiedMCR(M) Point A Intersection between line 1 and 7
178 55 84-9.0
Example 3, Load diagram for normal running conditions, engine with FPP and with shaft generator
The matching point O will normally be chosen on the propeller curve (~ the engine service curve) through point M.
Point A is then found in the same way as in example 1 and the load diagram can be drawn as shown in the figure.
MAN B&W ME/ME-C/ME-GI engines
MAN Diesel |
198 38 97-3.6 |
|
MAN B&W |
2.04 |
|
|
Page |
of 11 |
Example 4:
Special running conditions. Engine coupled to fixed pitch propeller (FPP) and with shaft generator
0OWER æ |
æOFæ, |
|
|
|
|
|
- |
, |
|
|
|
|
|
|
|
|
|
|
|
|
|
|
! |
|
||
|
|
|
|
|
|
|
|
|
|
|
|
|
|
|
- |
||
|
|
|
|
|
|
|
|
|
|
|
|
|
|
|
|
/ 3 |
|
|
|
|
|
|
|
-0 |
|
|
|
|
|
|
|
|
3' |
|
|
|
|
|
|
|
|
|
|
|
|
|
|
|
|
|
|||
|
, |
|
|
|
|
|
30 |
|
|
|
|
|
|
|
|
|
|
|
|
%NGINE |
|
|
|
|
|
|
|
|
SERVICE |
|
|
|
|
|
|
|
|
CURVE |
|
|
|
|
|
|
|
|
|
|
|
|
, |
||
|
|
|
|
|
|
|
|
|
|
, |
|
0ROPULSIONæCURVE |
|
|
|
||
|
|
|
|
|
|
|||
|
|
|
FORæFOULEDæHULL |
|
|
|
||
|
|
|
ANDæHEAVYæWEATHER |
|
|
|
||
|
|
|
%NGINEæSPEED æ |
æOFæ, |
|
|
|
|
|
|
|
|
|
! |
|
! |
|
|
0OWER æ |
æOFæ, |
|
|
|
|
- |
, |
||
|
|
|
|
|
|
|
|
|
|
|
|
|
|
|
|
|
|
|
|
|
%NGINEæSERVICEæCURVEæFORæFOULED |
|
|
! |
|
|
|
|
|
|
|
|
|
- |
|
|
|||
|
HULLæANDæHEAVYæWEATHER |
|
|
|
|
|
|
||
|
|
|
|
|
|
|
|
||
|
INCL æSHAFTæGENERATOR |
|
|
|
/ 3 |
|
|
|
|
|
|
|
|
|
-0 |
|
|
||
|
|
|
|
3' |
|
|
|
||
|
|
|
|
|
|
|
|
|
|
|
, |
|
|
|
30 |
|
|
, |
|
|
|
|
|
|
|
|
|
||
|
|
|
|
|
|
|
|
||
|
|
|
|
|
|
|
, |
|
|
|
|
|
|
|
|
|
|
|
|
|
, |
0ROPULSIONæCURVE |
|
|
|
|
|
||
|
|
FORæFOULEDæHULL |
|
|
|
|
|
||
|
|
ANDæHEAVYæWEATHER |
|
|
|
|
|
||
|
%NGINEæSPEED æ |
æOFæ, |
|
|
|
|
|
|
|
MSpecified MCR of engine
S Continuous service rating of engine
OMatching point of engine
AReference point of load diagram
MP |
Specified MCR for propulsion |
SP |
Continuous service rating of propulsion |
SG |
Shaft generator |
Example 4. Layout diagram for special running conditions, engine with FPP and with shaft generator
Also for this special case in example 4, a shaft generator is installed but, compared to example 3, this case has a specified MCR for propulsion, MP, placed at the top of the layout diagram.
This involves that the intended specified MCR of the engine M’ will be placed outside the top of the layout diagram.
One solution could be to choose a larger diesel engine with an extra cylinder, but another and cheaper solution is to reduce the electrical power production of the shaft generator when running in the upper propulsion power range.
Point A of load diagram is found:
Line 1 Propeller curve through matching point (O) or point S
Point A Intersection between line 1 and line L1 – L3 Point MLocated on constant power line 7
through point A and with MP’s speed.
178 55 85-0.1
Example 4. Load diagram for special running conditions, engine with FPP and with shaft generator
In choosing the latter solution, the required specified MCR power can be reduced from point M’ to point M as shown. Therefore, when running in the upper propulsion power range, a diesel generator has to take over all or part of the electrical power production.
However, such a situation will seldom occur, as ships are rather infrequently running in the upper propulsion power range.
Point A, having the highest possible power, is then found at the intersection of line L1– L3 with line
1 and the corresponding load diagram is drawn. Point M is found on line 7 at MP’s speed.
MAN B&W ME/ME-C/ME-GI engines
MAN Diesel |
198 38 97-3.6 |
|
MAN B&W |
2.04 |
|
|
|
Page 10 of 11 |
Example 5:
Engine coupled to controllable pitch propeller (CPP) with or without shaft generator
0OWER |
|
|
|
|
|
|
|
|
|
|
|
|
|
|
|
|
|
|
|
! |
|
! |
|
|
|
|
|
|
, |
||
|
|
|
|
|
|
||
|
|
|
|
|
|
|
|
, |
|
|
|
! - |
|
|
|
|
|
|
|
|
|
||
|
|
|
|
/ |
|
, |
|
|
|
|
|
|
|
||
|
|
|
|
3 |
|
|
|
|
|
|
|
|
|
, |
|
|
|
|
|
|
|
||
|
|
|
|
|
|
|
|
, |
|
|
|
|
|
|
|
|
|
|
-IN æSPEED -AX æSPEED |
|
|||
#OMBINATORæCURVEæFORæ |
|
|
2ECOMMENDEDæRANGEæFORæ |
||||
LOADEDæSHIPæANDæINCL æ |
|
|
SHAFTæGENERATORæOPERATIONæ |
||||
SEAæMARGIN |
|
|
|
|
WITHæCONSTANTæSPEED |
||
|
|
|
|
|
|
%NGINEæSPEED |
|
|
|
|
|
|
|
|
178 55 86-2.0 |
M Specified MCR of engine
OMatching point of engine
A Reference point of load diagram
SContinous service rating of engine
Example 5: Engine with Controllable Pitch Propeller (CPP), with or without shaft generator
Layout diagram without shaft generator
If a controllable pitch propeller (CPP) is applied, the combinator curve (of the propeller) will normally be selected for loaded ship including sea margin.
The combinator curve may for a given propeller speed have a given propeller pitch, and this may be heavy running in heavy weather like for a fixed pitch propeller.
Therefore it is recommended to use a light running combinator curve (the dotted curve) as shown in the figure to obtain an increased operation margin of the diesel engine in heavy weather to the limit indicated by curves 4 and 5.
Layout diagram with shaft generator
The hatched area shows the recommended speed range between 100% and 96.7% of the specified MCR speed for an engine with shaft generator running at constant speed.
The service point S can be located at any point within the hatched area.
The procedure shown in examples 3 and 4 for engines with FPP can also be applied here for engines with CPP running with a combinator curve.
The matching point
O may be chosen on the propeller curve through point A = M with a matching point from 85 to 100% of the specified MCR as mentioned before in the section dealing with matching point O.
Load diagram
Therefore, when the engine’s specified MCR point
(M) has been chosen including engine margin, sea margin and the power for a shaft generator, if installed, point M may be used as point A of the load diagram, which can then be drawn.
The position of the combinator curve ensures the maximum load range within the permitted speed range for engine operation, and it still leaves a reasonable margin to the limit indicated by curves 4 and 5.
Example 6 will give a more detailed description of how to run constant speed with a CP propeller.
MAN B&W ME/ME-C/ME-GI engines
MAN Diesel |
198 38 97-3.6 |
|
MAN B&W |
2.04 |
|
|
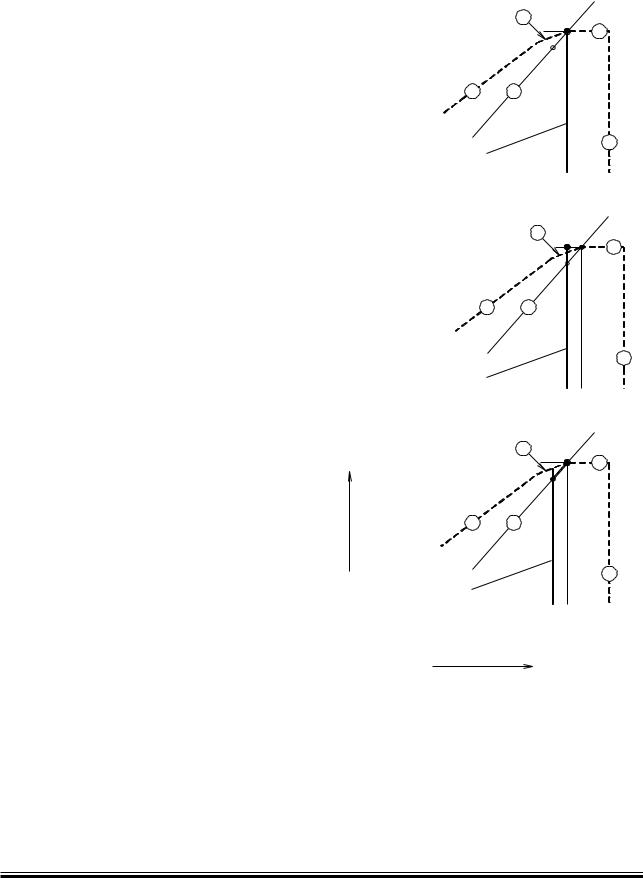
Example 6:
Engines running at constant speed with controllable pitch propeller (CPP)
Fig. A Constant speed curve through M, normal and correct location of the matching point O
Irrespective of whether the engine is operating on a propeller curve or on a constant speed curve through M, the matching point O must be located on the propeller curve through the specified MCR point M or, in special cases, to the left of point M.
The reason is that the propeller curve 1 through the matching point O is the layout curve of the engine, and the intersection between curve 1 and the maximum power line 7 through point M is equal to 100% power and 100% speed, point A of the load diagram in this case A=M.
In Fig. A the matching point O has been placed correctly, and the step up gear and the shaft generator, if installed, may be synchronised on the constant speed curve through M.
Fig. B: Constant speed curve through M, wrong position of matching point O
If the engine has been service matched at point O on a constant speed curve through point M, then the specified MCR point M would be placed outside the load diagram, and this is not permissible.
Fig. C: Recommended constant speed running curve, lower than speed M
In this case it is assumed that a shaft generator, if installed, is synchronised at a lower constant main engine speed (for example with speed equal to O or lower) at which improved CP propeller efficiency is obtained for part load running.
In this layout example where an improved CP propeller efficiency is obtained during extended periods of part load running, the step up gear and the shaft generator have to be designed for the lower constant engine speed that is applied.
Page 11 of 11
5 A=M
7
 O
O
4 1
3
Constant speed service curve through M
Fig. A: Normal procedure
5 M A
7
 O
O
4 1
3
Constant speed service curve through M
Fig. B: Wrong procedure
|
5 |
A=M |
Power |
|
|
|
7 |
|
|
|
O |
4 |
1 |
|
3
Constant speed service curve with a speed lower than M
Fig. C: Recommended procedure
Engine speed
Logarithmic scales
M: Specified MCR O: Matching point
A: 100% power and speed of load diagram (normally A=M)
178 19 69 9.0
Example 6:
Position of matching point O for engines running at constant speed.
MAN B&W ME/ME-C/ME-GI engines
MAN Diesel |
198 38 97-3.6 |
|