

s90mec7
.pdfMAN B&W
Engine Layout and Load
Diagrams, SFOC
2
MAN Diesel
MAN B&W |
2.01 |
|
|
Engine Layout and Load Diagrams
Introduction
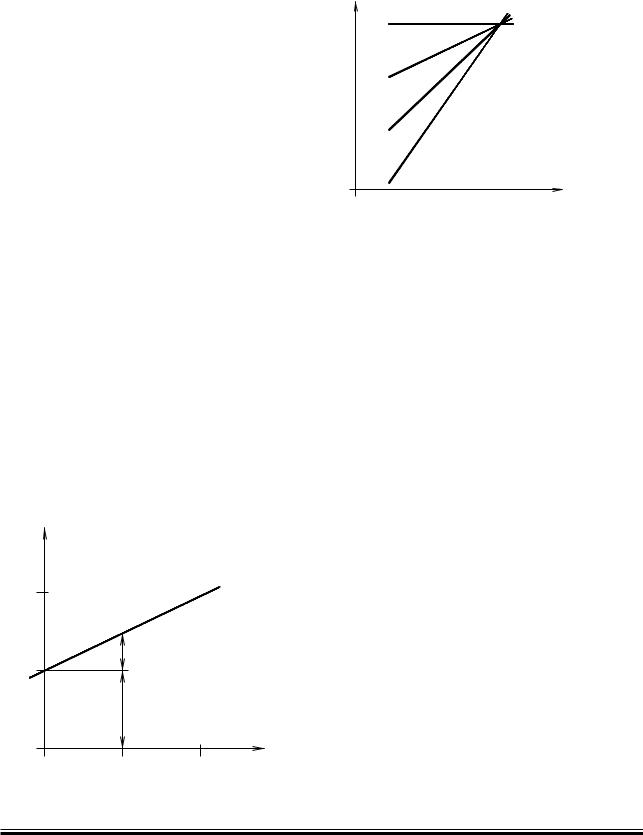
The effective power ‘P’ of a diesel engine is proportional to the mean effective pressure pe and engine speed ‘n’, i.e. when using ‘c’ as a constant:
P = c x pe x n
so, for constant mep, the power is proportional to the speed:
P = c x n1 (for constant mep)
When running with a Fixed Pitch Propeller (FPP), the power may be expressed according to the propeller law as:
P = c x n3 (propeller law)
Thus, for the above examples, the power P may be expressed as a power function of the speed ‘n’ to the power of ‘i’, i.e.:
P = c x ni
Fig. 2.01.01 shows the relationship for the linear functions, y = ax + b, using linear scales.
The power functions P = c x ni will be linear functions when using logarithmic scales:
log (P) = i x log (n) + log (c)
y
2 |
|
y=ax+b |
|
|
|
|
|
a |
|
|
|
|
|
b |
0 |
|
x |
0 |
|
2 |
178 05 40 3.0
Fig. 2.01.01: Straight lines in linear scales
Page of 2
y=log(P)
i = 0 |
P = ni x c |
|
log (P) = i x log (n) + log (c)
i =
i = 2
i = 3
x = log (n)
178 05 40 3.1
Fig. 2.01.02: Power function curves in logarithmic scales
Thus, propeller curves will be parallel to lines having the inclination i = 3, and lines with constant mep will be parallel to lines with the inclination i = 1.
Therefore, in the Layout Diagrams and Load Diagrams for diesel engines, logarithmic scales are used, giving simple diagrams with straight lines.
Propulsion and Engine Running Points
Propeller curve
The relation between power and propeller speed for a fixed pitch propeller is as mentioned above described by means of the propeller law, i.e. the third power curve:
P = c x n3, in which:
P = engine power for propulsion n = propeller speed
c = constant
Propeller design point
Normally, estimates of the necessary propeller power and speed are based on theoretical calculations for loaded ship, and often experimental tank tests, both assuming optimum operating conditions, i.e. a clean hull and good weather. The combination of speed and power obtained may be called the ship’s propeller design point (PD),
MAN B&W MC/MC C, ME-B, ME/ME GI engines
MAN Diesel |
198 38 33 8.4 |
|
MAN B&W |
2.01 |
|
|
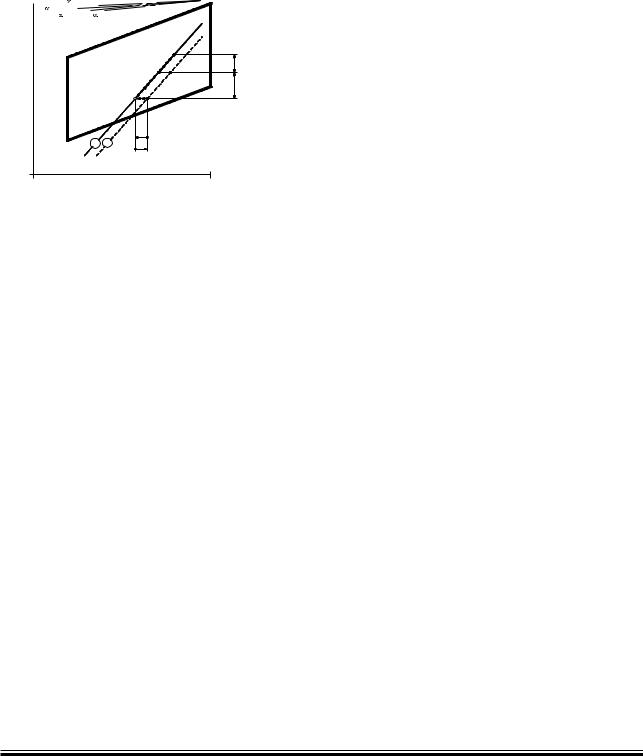
placed on the light running propeller curve 6. See below figure. On the other hand, some shipyards, and/or propeller manufacturers sometimes use a propeller design point (PD) that incorporates all or part of the so called sea margin described below.
Power, % af L |
|
|
|
L |
|
||
00% |
= 0,20= 0, 5 |
= 0,30 |
|
|
|||
|
= 0,25 |
|
|
|
|
|
|
|
L3 |
|
|
MP |
|
|
Engine margin |
|
|
|
|
|
|
|
|
|
|
|
|
SP |
|
|
(SP=90% of MP) |
|
|
|
|
PD |
L |
|
Sea margin |
|
|
|
|
|
|
||
|
|
|
|
|
|
2 |
( 5% of PD) |
|
|
|
|
PD |
|
|
|
|
L4 |
|
|
HR |
|
|
|
|
2 |
6 |
LR |
|
|
|
|
Engine speed, % of L
00%
Line 2 Propulsion curve, fouled hull and heavy weather (heavy running), recommended for engine layout
Line 6 Propulsion curve, clean hull and calm weather (light
|
running), for propeller layout |
MP |
Specified MCR for propulsion |
SP |
Continuous service rating for propulsion |
PD |
Propeller design point |
HR |
Heavy running |
LR |
Light running |
|
178 05 41 5.3 |
Fig. 2.01.03: Ship propulsion running points and engine layout
Fouled hull
When the ship has sailed for some time, the hull and propeller become fouled and the hull’s resistance will increase. Consequently, the ship’s speed will be reduced unless the engine delivers more power to the propeller, i.e. the propeller will be further loaded and will be heavy running (HR).
As modern vessels with a relatively high service speed are prepared with very smooth propeller and hull surfaces, the gradual fouling after sea trial will increase the hull’s resistance and make the propeller heavier running.
Sea margin and heavy weather
If, at the same time the weather is bad, with head winds, the ship’s resistance may increase compared to operating in calm weather conditions.
When determining the necessary engine power, it is normal practice to add an extra power margin,
Page of 2
the so called sea margin, which is traditionally about 15% of the propeller design (PD) power.
Engine layout (heavy propeller)
When determining the necessary engine layout speed that considers the influence of a heavy running propeller for operating at high extra ship resistance, it is (compared to line 6) recommended to choose a heavier propeller line 2. The propeller curve for clean hull and calm weather line 6 may then be said to represent a ‘light running’ (LR) propeller.
Compared to the heavy engine layout line 2, we recommend using a light running of 3.0 7.0% for design of the propeller.
Engine margin
Besides the sea margin, a so called ‘engine margin’ of some 10% or 15% is frequently added. The corresponding point is called the ‘specified MCR for propulsion’ (MP), and refers to the fact that the power for point SP is 10% or 15% lower than for point MP.
Point MP is identical to the engine’s specified MCR point (M) unless a main engine driven shaft generator is installed. In such a case, the extra power demand of the shaft generator must also be considered.
Constant ship speed lines
The constant ship speed lines , are shown at the very top of the figure. They indicate the power required at various propeller speeds in order to keep the same ship speed. It is assumed that, for each ship speed, the optimum propeller diameter is used, taking into consideration the total propulsion efficiency. See definition of in section 2.02.
Note:
Light/heavy running, fouling and sea margin are overlapping terms. Light/heavy running of the propeller refers to hull and propeller deterioration and heavy weather, whereas sea margin i.e. extra power to the propeller, refers to the influence of the wind and the sea. However, the degree of light running must be decided upon experience from the actual trade and hull design of the vessel.
MAN B&W MC/MC C, ME-B, ME/ME GI engines
MAN Diesel |
198 38 33 8.4 |
|
MAN B&W |
2.02 |
|
|
|
Page of 2 |
Propeller diameter and pitch, influence on the optimum propeller speed
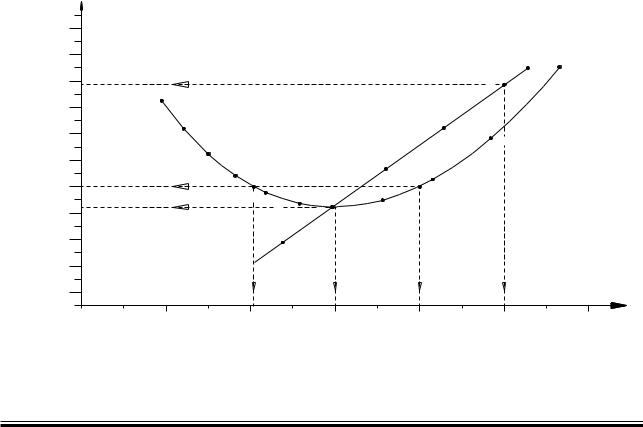
In general, the larger the propeller diameter D, the lower is the optimum propeller speed and the kW required for a certain design draught and ship speed, see curve D in the figure below.
The maximum possible propeller diameter depends on the given design draught of the ship, and the clearance needed between the propeller and the aft body hull and the keel.
The example shown in the figure is an 80,000 dwt crude oil tanker with a design draught of 12.2 m and a design speed of 14.5 knots.
When the optimum propeller diameter D is increased from 6.6 m to 7.2. m, the power demand is reduced from about 9,290 kW to 8,820 kW, and the optimum propeller speed is reduced from 120 r/min to 100 r/min, corresponding to the constant ship speed coefficient = 0.28 (see definition of in section 2.02, page 2).
Once an optimum propeller diameter of maximum 7.2 m has been chosen, the corresponding optimum pitch in this point is given for the design speed of 14.5 knots, i.e. P/D = 0.70.
However, if the optimum propeller speed of 100 r/min does not suit the preferred / selected main engine speed, a change of pitch away from optimum will only cause a relatively small extra power demand, keeping the same maximum propeller diameter:
•going from 100 to 110 r/min (P/D = 0.62) requires 8,900 kW i.e. an extra power demand of 80 kW.
•going from 100 to 91 r/min (P/D = 0.81) requires 8,900 kW i.e. an extra power demand of 80 kW.
In both cases the extra power demand is only of 0.9%, and the corresponding ‘equal speed curves’ are =+0.1 and = 0.1, respectively, so there is a certain interval of propeller speeds in which the ‘power penalty’ is very limited.
3HAFTæPOWER |
|
|
|
|
|
|
|
|
|
K7 |
|
|
|
|
|
|
|
|
|
|
|
|
|
|
|
|
|
|
|
|
|
$æ æ/PTIMUMæPROPELLERæDIAMETERS |
|
|
|
|
|
||
|
|
0$æ æ0ITCH DIAMETERæRATIO |
|
|
$ |
0$ |
|
||
|
|
|
|
|
|
|
|||
|
|
|
|
|
|
|
|
||
|
|
|
|
|
|
|
|
|
|
|
|
|
|
|
|
|
|
|
|
|
|
|
|
|
|
M |
|
|
|
|
0$ |
|
|
|
|
|
|
|
|
|
|
|
|
|
|
|
|
|
|
|
|
|
|
|
|
|
|
|
|
|
|
|
|
|
M |
|
|
|
|
|
|
|
|
|
|
|
|
||
|
|
|
|
|
|
|
|
|
|
|
|
|
|
|
|
|
|
|
|
|
|
|
|
|
|
|
|
|
|
|
|
|
M |
|
|
|
|
|
|
|
|
|
|
|
|
|
|
|
|
|
|
|
|
|
|
|
|
|
|
|
|
|
|
|
|
|
|
|
|
|
|
|
|
|
|
|
|
|
|
|
|
|
|
M |
|
|
|
|
|
|
|
|
|
|
|
|
|||
|
|
|
|
|
|
|
|
||
|
|
|
|
|
|
|
|
||
|
|
M |
|
|
|
|
|
|
|
|
|
$ |
|
|
|
|
|
|
|
|
|
|
|
|
|
|
|
|
|
|
|
|
|
|
|
|
|
0ROPELLER |
|
|
|
|
|
|
|
|
SPEED |
|
|
|
|
|
|
|
|
|
|
|
|
|
|
|
|
|
|
|
|
|
R MIN |
|
|
|
|
|
|
|
|
|
178 47 03 2.0 |
Fig. 2.02.01: Influence of diameter and pitch on propeller design
MAN B&W MC/MC C, ME-B, ME/ME C/ME GI engines
MAN Diesel |
198 38 78 2.5 |
|
MAN B&W |
2.02 |
|
|
Page |
of 2 |
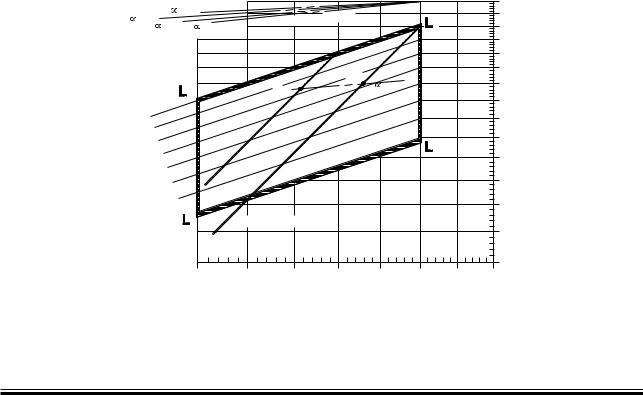
Constant ship speed lines
The constant ship speed lines , are shown at the very top of Fig. 2.02.02. These lines indicate the power required at various propeller speeds to keep the same ship speed provided that the optimum propeller diameter with an optimum pitch diameter ratio is used at any given speed, taking into consideration the total propulsion efficiency.
Normally, the following relation between necessary power and propeller speed can be assumed:
P2 = P1 x (n2/n1)
where:
P = Propulsion power
n = Propeller speed, and
= the constant ship speed coefficient.
For any combination of power and speed, each point on lines parallel to the ship speed lines gives the same ship speed.
When such a constant ship speed line is drawn into the layout diagram through a specified propulsion MCR point ‘MP1’, selected in the layout
area and parallel to one of the lines, another specified propulsion MCR point ‘MP2’ upon this line can be chosen to give the ship the same speed for the new combination of engine power and speed.
Fig. 2.02.02 shows an example of the required power speed point MP1, through which a constant ship speed curve = 0.25 is drawn, obtaining point MP2 with a lower engine power and a lower engine speed but achieving the same ship speed.
Provided the optimum pitch/diameter ratio is used for a given propeller diameter the following data applies when changing the propeller diameter:
for general cargo, bulk carriers and tankers= 0.25 0.30
and for reefers and container vessels= 0.15 0.25
When changing the propeller speed by changing the pitch diameter ratio, the constant will be different, see above.
|
|
|
|
|
|
|
|
|
|
|
|
|
|
|
|
Power |
|
|
|
|
|
|
|
=0, 5 |
|
|
|
|
|
|
|
0% |
|
|
|
|
|
|
|
|
|
|
|
eed lines |
|
|
|
|||
|
|
|
|
|
|
|
|
|
|
|
|
|
|
|
||
|
=0,20 |
|
|
|
|
|
ip sp |
|
|
|
|
|||||
|
|
|
|
|
tant sh |
|
|
|
|
|
||||||
|
|
|
|
|
|
=0,25 |
=0,30 |
|
Cons |
|
|
|
|
|
00% |
|
|
|
|
|
|
|
|
|
|
|
|
|
|||||
|
|
|
|
|
|
|
|
|
|
|
|
|
|
|
|
90% |
|
|
|
|
|
|
|
|
|
|
|
|
|
MP |
|
|
80% |
|
|
|
|
|
|
|
|
|
|
MP2 |
|
|
=0,25 |
|
||
|
|
|
|
|
|
|
|
|
|
|
|
|
|
|||
|
|
|
|
|
|
|
|
3 |
|
|
|
|
|
|
||
|
|
|
|
|
|
|
|
|
|
|
|
|
|
|
|
|
|
p |
|
|
|
|
|
|
|
|
|
|
|
|
|
|
|
e |
|
|
|
|
|
|
|
|
|
|
|
|
|
|
|
|
m |
|
|
|
|
|
|
|
|
|
|
|
|
|
|
|
70% |
|
|
% |
|
|
|
|
|
|
|
|
|
|
|
|||
|
0 |
|
|
|
|
|
|
|
|
|
|
|
|
|
|
|
0 |
|
|
|
|
|
|
|
|
|
|
|
|
|
|
|
|
|
|
|
% |
|
|
|
|
|
|
|
|
|
|
|
|
|
|
|
|
|
|
|
|
|
|
|
|
|
|
|
|
||
|
|
5 |
|
|
|
|
|
|
|
|
|
|
|
|
|
|
|
9 |
|
|
|
|
|
|
|
|
|
|
|
|
|
|
|
|
|
|
|
% |
|
|
|
|
|
|
|
|
|
|
|
|
|
|
|
0 |
|
|
|
|
|
|
|
|
|
|
|
|
|
|
|
9 |
|
|
|
|
|
|
|
|
|
|
|
2 |
|
|
|
|
|
|
5% |
|
|
|
|
|
|
|
|
60% |
|||
|
|
|
|
|
|
|
|
|
|
|
|
|
||||
|
|
|
8 |
|
|
|
|
|
|
|
|
|
|
|
|
|
|
|
|
|
|
% |
|
|
|
|
|
|
|
|
|
|
|
|
|
|
|
0 |
|
|
|
|
|
|
|
|
|
|
|
|
|
|
|
|
8 |
|
|
|
|
|
|
|
|
|
|
|
|
|
|
|
|
|
|
% |
|
|
|
|
|
|
|
|
|
|
|
|
|
|
|
5 |
|
|
|
|
|
|
|
|
|
|
|
|
|
|
|
7 |
|
|
|
|
|
|
|
|
|
|
|
|
|
|
|
|
|
|
|
% |
|
|
|
|
|
|
|
|
|
|
|
|
|
|
|
0 |
|
|
|
|
|
|
|
|
50% |
|
|
|
|
|
|
7 |
|
|
|
|
|
|
|
|
|
||
|
|
|
|
|
|
|
|
4 |
Nominal propeller curve |
|
|
|
|
|||
|
|
|
|
|
|
|
|
|
|
|
|
|
|
|
|
|
|
|
|
|
|
|
|
|
|
|
|
|
|
|
|
|
40% |
|
|
|
|
|
|
|
|
75% |
80% |
|
85% |
|
90% |
95% |
00% |
05% |
Engine speed
178 05 66 7.0
Fig. 2.02.02: Layout diagram and constant ship speed lines
MAN B&W MC/MC C, ME-B, ME/ME C/ME GI engines
MAN Diesel |
198 38 78 2.5 |
|
MAN B&W Diesel A/S |
2.03 |
|
|
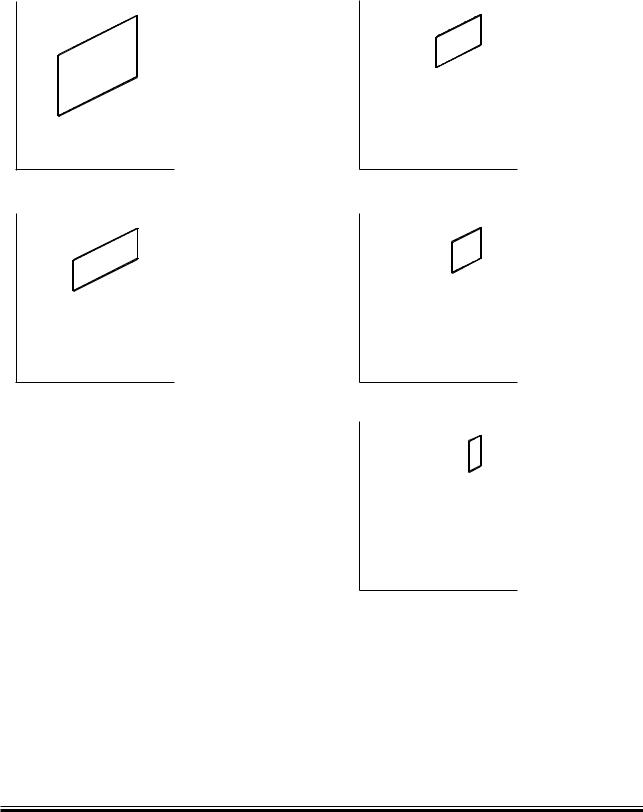
Layout diagram sizes
Power


 L1
L1
L3 


L2
L4
Speed
Power
L1
L3 L2
L4
Speed
Page 1 of 1
Power
Layout diagram of 100 - 64% power and
100 - 75% speed range valid for the types: K90ME S80ME-C S70ME-C S70ME-GI S60ME-C S50ME-C
Power
L1
L3
L2
L4
Speed
Layout diagram of 100 - 80% power and
100 - 85% speed range valid for the types: K90ME-C K80ME-C L70ME-C L60ME-C S65ME-C
Layout diagram of 100 - 80% power and
100 - 80% speed range valid for the types: S90ME-C
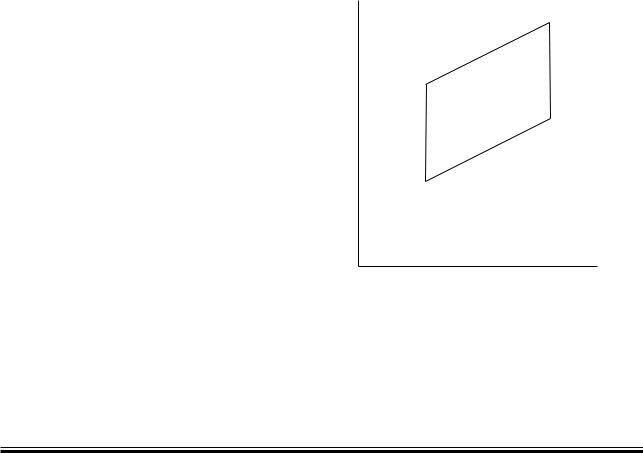
Power
L1 |
Layout diagram of |
|||
L3 |
100 |
- 80% power and |
||
L2 |
||||
100 |
- 90% speed range |
|||
L4 |
||||
valid for the types: |
||||
|
||||
|
K98ME |
K98ME-C |
||
Speed
L1 |
Layout diagram of |
||
L3 |
100 |
- 80% power and |
|
L2 |
|||
100 |
- 96% speed range |
||
L4 |
|||
valid for the types: K108ME-C
Speed
See also Section 2.05 for actual project.
178 50 06-4.0
Fig. 2.03.01
ME/ME-C/ME-GI engines |
198 38 91-2.3 |
MAN B&W |
2.04 |
|
|
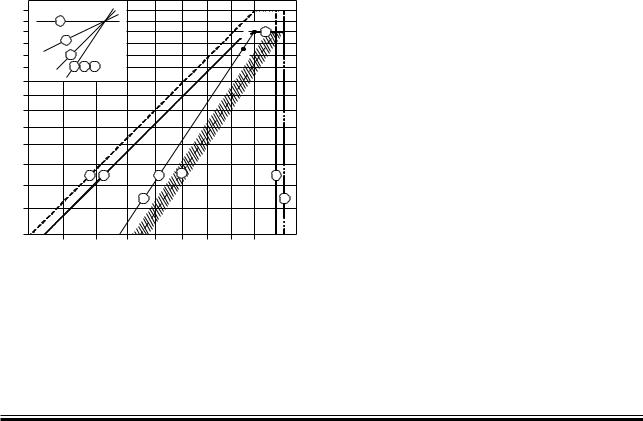
Engine Layout and Load Diagram
Engine Layout Diagram
An engine’s layout diagram is limited by two constant mean effective pressure (mep) lines L1– L3 and L2– L4, and by two constant engine speed lines L1– L2 and L3– L4. The L1 point refers to the engine’s nominal maximum continuous rating.
Within the layout area there is full freedom to select the engine’s specified MCR point M which suits the demand for propeller power and speed for the ship.
On the horizontal axis the engine speed and on the vertical axis the engine power are shown on percentage scales. The scales are logarithmic which means that, in this diagram, power function curves like propeller curves (3rd power), constant mean effective pressure curves (1st power) and constant ship speed curves (0.15 to 0.30 power) are straight lines.
Specified maximum continuous rating (M)
Based on the propulsion and engine running points, as previously found, the layout diagram of a relevant main engine may be drawn in. The specified MCR point (M) must be inside the limitation lines of the layout diagram; if it is not, the propeller speed will have to be changed or another main engine type must be chosen.
Continuous service rating (S)
The continuous service rating is the power at which the engine is normally assumed to operate, and point S is identical to the service propulsion point (SP) unless a main engine driven shaft generator is installed.
Page of 11
Matching point (O)
For practical reasons we have chosen to use the designation ‘O’ for the matching point.
The engine matching point (O) is placed on line 1 in the load diagram, Fig. 2.04.02, and can be from 85 to 100% of point M’s power, however it has to be placed inside the layout diagram.
Overload running (110% of M) will still be possible.
As the timing of the fuel injection and the exhaust valve activation are electronically optimised over a wide operating range of the engine, the selection of matching point only has a meaning in connection with the turbocharger matching and the compression ratio.
The lowest specific fuel oil consumption for ME engines is obtained at 70% of the matching point
(O).
Power
L
L3
L2
L4
Speed
178 51 39 4.0
Fig. 2.04.01: Engine layout diagram
MAN B&W ME/ME-C/ME-GI engines
MAN Diesel |
198 38 97-3.6 |
|
MAN B&W |
2.04 |
|
|
Engine Load Diagram
Definitions
The engine’s load diagram defines the power and speed limits for continuous as well as overload operation of an installed engine having a specified MCR point M that confirms the ship’s specification.
Point A is a 100% speed and power reference point of the load diagram, and is defined as the point on the propeller curve (line 1), the layout curve of the engine through the matching point O, having the specified MCR power. Normally, point M is equal to point A, but in special cases, for example if a shaft generator is installed, point M may be placed to the right of point A on line 7. However, MAN Diesel may always consider point A as the engine’s MCR for shop test.
In most cases, the points M and A are identical.
The service points of the installed engine incorporate the engine power required for ship propulsion and shaft generator, if installed.
Engine shaft power, % of A
110 |
|
|
|
|
|
|
|
|
|
|
|
105 |
7 |
|
|
|
|
|
|
|
A=M |
|
|
100 |
|
|
|
|
|
|
|
|
7 |
|
|
95 |
5 |
|
|
|
|
|
|
|
5 |
|
|
|
|
|
|
|
|
|
|
|
|
||
90 |
4 |
|
|
|
|
|
|
|
O |
|
|
85 |
1 |
2 |
6 |
|
|
|
|
|
|
|
|
80 |
|
|
|
|
|
|
|
|
|
|
|
75 |
|
|
|
|
|
|
|
|
|
|
|
70 |
|
|
|
|
|
|
|
|
|
|
|
65 |
|
|
|
|
|
|
|
|
|
|
|
60 |
|
|
|
|
|
|
|
|
|
|
|
55 |
|
|
|
|
|
6 |
|
|
|
|
|
50 |
|
8 |
4 |
|
1 |
|
|
|
3 |
|
|
|
|
|
|
|
|
|
|
|
|
|
|
|
|
|
|
|
2 |
|
|
|
|
9 |
|
45 |
|
|
|
|
|
|
|
|
|
|
|
40 |
|
|
|
|
|
|
|
|
|
|
|
60 |
65 |
70 |
75 |
80 |
85 |
90 |
95 |
100 105 |
110 |
||
Engine speed, % of A
Regarding ‘i’ in the power function P = c x ni, see page 2.01
A |
100% reference point |
MSpecified MCR
OMatching point
178 05 42 7.3
Fig. 2.04.02: Standard engine load diagram
Page of 11
Operating curves and limits for continuous operation
The continuous service range is limited by four lines:
4, 5, 7 and 3 (9), see Fig. 2.04.02. The propeller curves, line 1, 2 and 6 in the load diagram are also described below.
Line 1:
Propeller curve through specified MCR (M), engine layout curve (i = 3).
Line 2:
Propeller curve, fouled hull and heavy weather
– heavy running (i = 3).
Line 3 and line 9:
Line 3 represents the maximum acceptable speed for continuous operation, i.e. 105% of A.
During trial conditions the maximum speed may be extended to 107% of A, see line 9.
The above limits may in general be extended to 105% and during trial conditions to 107% of the nominal L1 speed of the engine, provided the torsional vibration conditions permit.
The overspeed set point is 109% of the speed in A, however, it may be moved to 109% of the nominal speed in L1, provided that torsional vibration conditions permit.
Running at low load above 100% of the nominal L1 speed of the engine is, however, to be avoided for extended periods. Only plants with controllable pitch propellers can reach this light running area.
Line 4:
Represents the limit at which an ample air supply is available for combustion and imposes a limitation on the maximum combination of torque and speed (i = 2).
Line 5:
Represents the maximum mean effective pressure level (mep), which can be accepted for continuous operation (i = 1).
MAN B&W ME/ME-C/ME-GI engines
MAN Diesel |
198 38 97-3.6 |
|