

DRAFT! © April 1, 2009 Cambridge University Press. Feedback welcome. |
151 |
8 Evaluation in information retrieval
We have seen in the preceding chapters many alternatives in designing an IR system. How do we know which of these techniques are effective in which applications? Should we use stop lists? Should we stem? Should we use inverse document frequency weighting? Information retrieval has developed as a highly empirical discipline, requiring careful and thorough evaluation to demonstrate the superior performance of novel techniques on representative document collections.
In this chapter we begin with a discussion of measuring the effectiveness of IR systems (Section 8.1) and the test collections that are most often used for this purpose (Section 8.2). We then present the straightforward notion of relevant and nonrelevant documents and the formal evaluation methodology that has been developed for evaluating unranked retrieval results (Section 8.3). This includes explaining the kinds of evaluation measures that are standardly used for document retrieval and related tasks like text classification and why they are appropriate. We then extend these notions and develop further measures for evaluating ranked retrieval results (Section 8.4) and discuss developing reliable and informative test collections (Section 8.5).
We then step back to introduce the notion of user utility, and how it is approximated by the use of document relevance (Section 8.6). The key utility measure is user happiness. Speed of response and the size of the index are factors in user happiness. It seems reasonable to assume that relevance of results is the most important factor: blindingly fast, useless answers do not make a user happy. However, user perceptions do not always coincide with system designers’ notions of quality. For example, user happiness commonly depends very strongly on user interface design issues, including the layout, clarity, and responsiveness of the user interface, which are independent of the quality of the results returned. We touch on other measures of the quality of a system, in particular the generation of high-quality result summary snippets, which strongly influence user utility, but are not measured in the basic relevance ranking paradigm (Section 8.7).
Online edition (c) 2009 Cambridge UP
152 |
8 Evaluation in information retrieval |
8.1Information retrieval system evaluation
RELEVANCE
GOLD STANDARD GROUND TRUTH
INFORMATION NEED
To measure ad hoc information retrieval effectiveness in the standard way, we need a test collection consisting of three things:
1.A document collection
2.A test suite of information needs, expressible as queries
3.A set of relevance judgments, standardly a binary assessment of either relevant or nonrelevant for each query-document pair.
The standard approach to information retrieval system evaluation revolves around the notion of relevant and nonrelevant documents. With respect to a user information need, a document in the test collection is given a binary classification as either relevant or nonrelevant. This decision is referred to as the gold standard or ground truth judgment of relevance. The test document collection and suite of information needs have to be of a reasonable size: you need to average performance over fairly large test sets, as results are highly variable over different documents and information needs. As a rule of thumb, 50 information needs has usually been found to be a sufficient minimum.
Relevance is assessed relative to an information need, not a query. For example, an information need might be:
Information on whether drinking red wine is more effective at reducing your risk of heart attacks than white wine.
This might be translated into a query such as:
wine AND red AND white AND heart AND attack AND effective
A document is relevant if it addresses the stated information need, not because it just happens to contain all the words in the query. This distinction is often misunderstood in practice, because the information need is not overt. But, nevertheless, an information need is present. If a user types python into a web search engine, they might be wanting to know where they can purchase a pet python. Or they might be wanting information on the programming language Python. From a one word query, it is very difficult for a system to know what the information need is. But, nevertheless, the user has one, and can judge the returned results on the basis of their relevance to it. To evaluate a system, we require an overt expression of an information need, which can be used for judging returned documents as relevant or nonrelevant. At this point, we make a simplification: relevance can reasonably be thought of as a scale, with some documents highly relevant and others marginally so. But for the moment, we will use just a binary decision of relevance. We
Online edition (c) 2009 Cambridge UP
DEVELOPMENT TEST COLLECTION
8.2 Standard test collections |
153 |
discuss the reasons for using binary relevance judgments and alternatives in Section 8.5.1.
Many systems contain various weights (often known as parameters) that can be adjusted to tune system performance. It is wrong to report results on a test collection which were obtained by tuning these parameters to maximize performance on that collection. That is because such tuning overstates the expected performance of the system, because the weights will be set to maximize performance on one particular set of queries rather than for a random sample of queries. In such cases, the correct procedure is to have one or more development test collections, and to tune the parameters on the development test collection. The tester then runs the system with those weights on the test collection and reports the results on that collection as an unbiased estimate of performance.
8.2Standard test collections
Here is a list of the most standard test collections and evaluation series. We focus particularly on test collections for ad hoc information retrieval system evaluation, but also mention a couple of similar test collections for text classification.
CRANFIELD The Cranfield collection. This was the pioneering test collection in allowing precise quantitative measures of information retrieval effectiveness, but is nowadays too small for anything but the most elementary pilot experiments. Collected in the United Kingdom starting in the late 1950s, it contains 1398 abstracts of aerodynamics journal articles, a set of 225 queries, and exhaustive relevance judgments of all (query, document) pairs.
TREC Text Retrieval Conference (TREC). The U.S. National Institute of Standards and Technology (NIST) has run a large IR test bed evaluation series since 1992. Within this framework, there have been many tracks over a range of different test collections, but the best known test collections are the ones used for the TREC Ad Hoc track during the first 8 TREC evaluations between 1992 and 1999. In total, these test collections comprise 6 CDs containing 1.89 million documents (mainly, but not exclusively, newswire articles) and relevance judgments for 450 information needs, which are called topics and specified in detailed text passages. Individual test collections are defined over different subsets of this data. The early TRECs each consisted of 50 information needs, evaluated over different but overlapping sets of documents. TRECs 6–8 provide 150 information needs over about 528,000 newswire and Foreign Broadcast Information Service articles. This is probably the best subcollection to use in future work, because it is the largest and the topics are more consistent. Because the test
Online edition (c) 2009 Cambridge UP
154 |
8 Evaluation in information retrieval |
document collections are so large, there are no exhaustive relevance judgments. Rather, NIST assessors’ relevance judgments are available only for the documents that were among the top k returned for some system which was entered in the TREC evaluation for which the information need was developed.
In more recent years, NIST has done evaluations on larger document col- GOV2 lections, including the 25 million page GOV2 web page collection. From the beginning, the NIST test document collections were orders of magnitude larger than anything available to researchers previously and GOV2 is now the largest Web collection easily available for research purposes. Nevertheless, the size of GOV2 is still more than 2 orders of magnitude smaller than the current size of the document collections indexed by the
large web search companies.
NTCIR
CROSS-LANGUAGE INFORMATION RETRIEVAL
CLEF
REUTERS
NII Test Collections for IR Systems (NTCIR). The NTCIR project has built various test collections of similar sizes to the TREC collections, focusing on East Asian language and cross-language information retrieval, where queries are made in one language over a document collection containing
documents in one or more other languages. See: http://research.nii.ac.jp/ntcir/data/dataen.html
Cross Language Evaluation Forum (CLEF). This evaluation series has concentrated on European languages and cross-language information retrieval. See:
Reuters-21578 and Reuters-RCV1. For text classification, the most used test collection has been the Reuters-21578 collection of 21578 newswire articles; see Chapter 13, page 279. More recently, Reuters released the much larger Reuters Corpus Volume 1 (RCV1), consisting of 806,791 documents; see Chapter 4, page 69. Its scale and rich annotation makes it a better basis for future research.
20 NEWSGROUPS 20 Newsgroups. This is another widely used text classification collection, collected by Ken Lang. It consists of 1000 articles from each of 20 Usenet newsgroups (the newsgroup name being regarded as the category). After the removal of duplicate articles, as it is usually used, it contains 18941 articles.
8.3Evaluation of unranked retrieval sets
Given these ingredients, how is system effectiveness measured? The two most frequent and basic measures for information retrieval effectiveness are precision and recall. These are first defined for the simple case where an
Online edition (c) 2009 Cambridge UP
8.3 Evaluation of unranked retrieval sets |
155 |
IR system returns a set of documents for a query. We will see later how to extend these notions to ranked retrieval situations.
PRECISION Precision (P) is the fraction of retrieved documents that are relevant
(8.1) |
Precision = |
#(relevant items retrieved) |
= P(relevant|retrieved) |
||
#(retrieved items) |
|
||||
RECALL |
Recall (R) is the fraction of relevant documents that are retrieved |
||||
(8.2) |
Recall = |
#(relevant items retrieved) |
= P(retrieved|relevant) |
||
|
|
||||
|
#(relevant items) |
||||
These notions can be made clear by examining the following contingency table:
(8.3) |
|
|
|
|
|
Relevant |
Nonrelevant |
|
Retrieved |
true positives (tp) |
false positives (fp) |
|
Not retrieved |
false negatives (fn) |
true negatives (tn) |
|
Then: |
|
|
(8.4) |
P |
= |
tp/(tp + f p) |
|
R |
= |
tp/(tp + f n) |
An obvious alternative that may occur to the reader is to judge an infor- ACCURACY mation retrieval system by its accuracy, that is, the fraction of its classifications that are correct. In terms of the contingency table above, accuracy = (tp + tn)/(tp + f p + f n + tn). This seems plausible, since there are two actual classes, relevant and nonrelevant, and an information retrieval system can be thought of as a two-class classifier which attempts to label them as such (it retrieves the subset of documents which it believes to be relevant).
This is precisely the effectiveness measure often used for evaluating machine learning classification problems.
There is a good reason why accuracy is not an appropriate measure for information retrieval problems. In almost all circumstances, the data is extremely skewed: normally over 99.9% of the documents are in the nonrelevant category. A system tuned to maximize accuracy can appear to perform well by simply deeming all documents nonrelevant to all queries. Even if the system is quite good, trying to label some documents as relevant will almost always lead to a high rate of false positives. However, labeling all documents as nonrelevant is completely unsatisfying to an information retrieval system user. Users are always going to want to see some documents, and can be
Online edition (c) 2009 Cambridge UP

156
F MEASURE
(8.5)
(8.6)
8 Evaluation in information retrieval
assumed to have a certain tolerance for seeing some false positives providing that they get some useful information. The measures of precision and recall concentrate the evaluation on the return of true positives, asking what percentage of the relevant documents have been found and how many false positives have also been returned.
The advantage of having the two numbers for precision and recall is that one is more important than the other in many circumstances. Typical web surfers would like every result on the first page to be relevant (high precision) but have not the slightest interest in knowing let alone looking at every document that is relevant. In contrast, various professional searchers such as paralegals and intelligence analysts are very concerned with trying to get as high recall as possible, and will tolerate fairly low precision results in order to get it. Individuals searching their hard disks are also often interested in high recall searches. Nevertheless, the two quantities clearly trade off against one another: you can always get a recall of 1 (but very low precision) by retrieving all documents for all queries! Recall is a non-decreasing function of the number of documents retrieved. On the other hand, in a good system, precision usually decreases as the number of documents retrieved is increased. In general we want to get some amount of recall while tolerating only a certain percentage of false positives.
A single measure that trades off precision versus recall is the F measure, which is the weighted harmonic mean of precision and recall:
F = |
|
|
1 |
|
|
|
= |
(β2 + 1)PR |
where |
β2 = |
1 − α |
|
|
1 |
+ (1 |
|
1 |
|
β2 P + R |
|
|||||
|
|
|
|
|
|
|
α |
|||||
|
α P |
− α) R |
|
|
|
|||||||
|
|
|
|
|
|
|
||||||
where α [0, 1] and thus β2 [0, ∞]. The default balanced F measure equally weights precision and recall, which means making α = 1/2 or β = 1. It is commonly written as F1, which is short for Fβ=1, even though the formulation in terms of α more transparently exhibits the F measure as a weighted harmonic mean. When using β = 1, the formula on the right simplifies to:
2PR Fβ=1 = P + R
However, using an even weighting is not the only choice. Values of β < 1 emphasize precision, while values of β > 1 emphasize recall. For example, a value of β = 3 or β = 5 might be used if recall is to be emphasized. Recall, precision, and the F measure are inherently measures between 0 and 1, but they are also very commonly written as percentages, on a scale between 0 and 100.
Why do we use a harmonic mean rather than the simpler average (arithmetic mean)? Recall that we can always get 100% recall by just returning all documents, and therefore we can always get a 50% arithmetic mean by the
Online edition (c) 2009 Cambridge UP
8.3 Evaluation of unranked retrieval sets |
|
|
|
|
|
|
157 |
|
1 0 |
0 |
|
|
|
|
|
|
|
8 |
i n i |
m |
i m |
u m |
m |
|
|
|
6 |
|
|
|
|||||
|
M a x |
|
u |
i |
c |
|||
|
|
A r i t h |
|
m |
e |
t |
||
4 |
|
G e o |
|
m |
e |
t |
r |
i c |
|
H a r m |
|
|
o n |
|
i c |
|
|
2 |
|
|
|
|
|
|
|
|
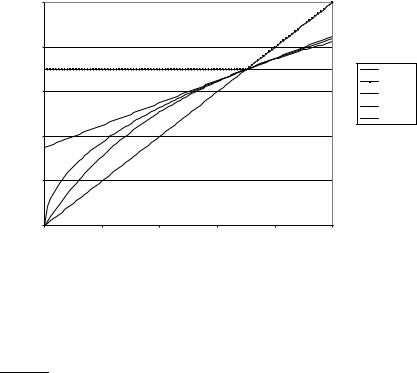
Figure 8.1 Graph comparing the harmonic mean to other means. The graph shows a slice through the calculation of various means of precision and recall for the fixed recall value of 70%. The harmonic mean is always less than either the arithmetic or geometric mean, and often quite close to the minimum of the two numbers. When the precision is also 70%, all the measures coincide.
same process. This strongly suggests that the arithmetic mean is an unsuitable measure to use. In contrast, if we assume that 1 document in 10,000 is relevant to the query, the harmonic mean score of this strategy is 0.02%. The harmonic mean is always less than or equal to the arithmetic mean and the geometric mean. When the values of two numbers differ greatly, the harmonic mean is closer to their minimum than to their arithmetic mean; see Figure 8.1.
? |
Exercise 8.1 |
[ ] |
An IR system returns 8 relevant documents, and 10 nonrelevant documents. There |
||
are a total of 20 relevant documents in the collection. What is the precision of the |
||
|
system on this search, and what is its recall? |
|
|
Exercise 8.2 |
[ ] |
The balanced F measure (a.k.a. F1) is defined as the harmonic mean of precision and recall. What is the advantage of using the harmonic mean rather than “averaging” (using the arithmetic mean)?
Online edition (c) 2009 Cambridge UP