

Biosignal and Biomedical Image Processing MATLAB based Applications - John L. Semmlow
.pdfcations, Addison-Wesley, Inc., Reading, MA, 1998. Good development of wavelet analysis including both the continuous and discreet wavelet transforms.
Shiavi, R Introduction to Applied Statistical Signal Analysis, (2nd ed), Academic Press, San Diego, CA, 1999. Emphasizes spectral analysis of signals buried in noise. Excellent coverage of Fourier analysis, and autoregressive methods. Good introduction to statistical signal processing concepts.
Sonka, M., Hlavac V., and Boyle R. Image processing, analysis, and machine vision. Chapman and Hall Computing, London, 1993. A good description of edge-based and other segmentation methods.
Strang, G and Nguyen, T. Wavelets and Filter Banks, Wellesley-Cambridge Press, Wellesley, MA, 1997. Thorough coverage of wavelet filter banks including extensive mathematical background.
Stearns, S.D. and David, R.A Signal Processing Algorithms in MATLAB, Prentice Hall, Upper Saddle River, NJ, 1996. Good treatment of the classical Fourier transform and digital filters. Also covers the LMS adaptive filter algorithm. Disk enclosed.
Wickerhauser, M.V. Adapted Wavelet Analysis from Theory to Software, A.K. Peters, Ltd. and IEEE Press, Wellesley, MA, 1994. Rigorous, extensive treatment of wavelet analysis.
Widrow, B. Adaptive noise cancelling: Principles and applications. Proc IEEE 63:1692– 1716, 1975. Classic original article on adaptive noise cancellation.
Wright S. Nuclear Magnetic Resonance and Magnetic Resonance Imaging. In: Introduction to Biomedical Engineering (Enderle, Blanchard and Bronzino, Eds.) Academic Press, San Diego, CA, 2000. Good mathematical development of the physics of MRI using classical concepts.
Copyright 2004 by Marcel Dekker, Inc. All Rights Reserved.
1
Introduction
TYPICAL MEASUREMENT SYSTEMS
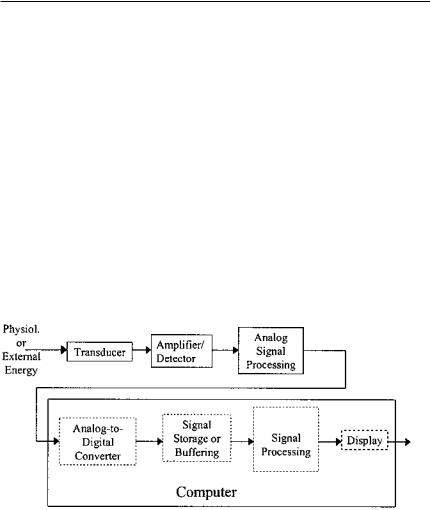
A schematic representation of a typical biomedical measurement system is shown in Figure 1.1. Here we use the term measurement in the most general sense to include image acquisition or the acquisition of other forms of diagnostic information. The physiological process of interest is converted into an electric
FIGURE 1.1 Schematic representation of typical bioengineering measurement system.
Copyright 2004 by Marcel Dekker, Inc. All Rights Reserved.

signal via the transducer (Figure 1.1). Some analog signal processing is usually required, often including amplification and lowpass (or bandpass) filtering. Since most signal processing is easier to implement using digital methods, the analog signal is converted to digital format using an analog-to-digital converter. Once converted, the signal is often stored, or buffered, in memory to facilitate subsequent signal processing. Alternatively, in some real-time* applications, the incoming data must be processed as quickly as possible with minimal buffering, and may not need to be permanently stored. Digital signal processing algorithms can then be applied to the digitized signal. These signal processing techniques can take a wide variety of forms and various levels of sophistication, and they make up the major topic area of this book. Some sort of output is necessary in any useful system. This usually takes the form of a display, as in imaging systems, but may be some type of an effector mechanism such as in an automated drug delivery system.
With the exception of this chapter, this book is limited to digital signal and image processing concerns. To the extent possible, each topic is introduced with the minimum amount of information required to use and understand the approach, and enough information to apply the methodology in an intelligent manner. Understanding of strengths and weaknesses of the various methods is also covered, particularly through discovery in the problems at the end of the chapter. Hence, the problems at the end of each chapter, most of which utilize the MATLABTM software package (Waltham, MA), constitute an integral part of the book: a few topics are introduced only in the problems.
A fundamental assumption of this text is that an in-depth mathematical treatment of signal processing methodology is not essential for effective and appropriate application of these tools. Thus, this text is designed to develop skills in the application of signal and image processing technology, but may not provide the skills necessary to develop new techniques and algorithms. References are provided for those who need to move beyond application of signal and image processing tools to the design and development of new methodology. In subsequent chapters, each major section is followed by a section on implementation using the MATLAB software package. Fluency with the MATLAB language is assumed and is essential for the use of this text. Where appropriate, a topic area may also include a more in-depth treatment including some of the underlying mathematics.
*Learning the vocabulary is an important part of mastering a discipline. In this text we highlight, using italics, terms commonly used in signal and image processing. Sometimes the highlighted term is described when it is introduced, but occasionally determination of its definition is left to responsibility of the reader. Real-time processing and buffering are described in the section on analog-to- digital conversion.
Copyright 2004 by Marcel Dekker, Inc. All Rights Reserved.
TRANSDUCERS
A transducer is a device that converts energy from one form to another. By this definition, a light bulb or a motor is a transducer. In signal processing applications, the purpose of energy conversion is to transfer information, not to transform energy as with a light bulb or a motor. In measurement systems, all transducers are so-called input transducers, they convert non-electrical energy into an electronic signal. An exception to this is the electrode, a transducer that converts electrical energy from ionic to electronic form. Usually, the output of a biomedical transducer is a voltage (or current) whose amplitude is proportional to the measured energy.
The energy that is converted by the input transducer may be generated by the physiological process itself, indirectly related to the physiological process, or produced by an external source. In the last case, the externally generated energy interacts with, and is modified by, the physiological process, and it is this alteration that produces the measurement. For example, when externally produced x-rays are transmitted through the body, they are absorbed by the intervening tissue, and a measurement of this absorption is used to construct an image. Many diagnostically useful imaging systems are based on this external energy approach.
In addition to passing external energy through the body, some images are generated using the energy of radioactive emissions of radioisotopes injected into the body. These techniques make use of the fact that selected, or tagged, molecules will collect in specific tissue. The areas where these radioisotopes collect can be mapped using a gamma camera, or with certain short-lived isotopes, better localized using positron emission tomography (PET).
Many physiological processes produce energy that can be detected directly. For example, cardiac internal pressures are usually measured using a pressure transducer placed on the tip of catheter introduced into the appropriate chamber of the heart. The measurement of electrical activity in the heart, muscles, or brain provides other examples of the direct measurement of physiological energy. For these measurements, the energy is already electrical and only needs to be converted from ionic to electronic current using an electrode. These sources are usually given the term ExG, where the ‘x’ represents the physiological process that produces the electrical energy: ECG–electrocardiogram, EEG– electroencephalogram; EMG–electromyogram; EOG–electrooculargram, ERG– electroretiniogram; and EGG–electrogastrogram. An exception to this terminology is the electrical activity generated by this skin which is termed the galvanic skin response, GSR. Typical physiological energies and the applications that use these energy forms are shown in Table 1.1
The biotransducer is often the most critical element in the system since it constitutes the interface between the subject or life process and the rest of the
Copyright 2004 by Marcel Dekker, Inc. All Rights Reserved.

TABLE 1.1 Energy Forms and Related Direct Measurements
Energy |
Measurement |
|
|
Mechanical |
|
length, position, and velocity |
muscle movement, cardiovascular pressures, |
|
muscle contractility |
force and pressure |
valve and other cardiac sounds |
Heat |
body temperature, thermography |
Electrical |
EEG, ECG, EMG, EOG, ERG, EGG, GSR |
Chemical |
ion concentrations |
|
|
system. The transducer establishes the risk, or noninvasiveness, of the overall system. For example, an imaging system based on differential absorption of x-rays, such as a CT (computed tomography) scanner is considered more invasive than an imagining system based on ultrasonic reflection since CT uses ionizing radiation that may have an associated risk. (The actual risk of ionizing radiation is still an open question and imaging systems based on x-ray absorption are considered minimally invasive.) Both ultrasound and x-ray imaging would be considered less invasive than, for example, monitoring internal cardiac pressures through cardiac catherization in which a small catheter is treaded into the heart chambers. Indeed many of the outstanding problems in biomedical measurement, such as noninvasive measurement of internal cardiac pressures, or the noninvasive measurement of intracranial pressure, await an appropriate (and undoubtedly clever) transducer mechanism.
Further Study: The Transducer
The transducer often establishes the major performance criterion of the system. In a later section, we list and define a number of criteria that apply to measurement systems; however, in practice, measurement resolution, and to a lesser extent bandwidth, are generally the two most important and troublesome measurement criteria. In fact, it is usually possible to trade-off between these two criteria. Both of these criteria are usually established by the transducer. Hence, although it is not the topic of this text, good system design usually calls for care in the choice or design of the transducer element(s). An efficient, low-noise transducer design can often reduce the need for extensive subsequent signal processing and still produce a better measurement.
Input transducers use one of two different fundamental approaches: the input energy causes the transducer element to generate a voltage or current, or the input energy creates a change in the electrical properties (i.e., the resistance, inductance, or capacitance) of the transducer element. Most optical transducers
Copyright 2004 by Marcel Dekker, Inc. All Rights Reserved.
use the first approach. Photons strike a photo sensitive material producing free electrons (or holes) that can then be detected as an external current flow. Piezoelectric devices used in ultrasound also generate a charge when under mechanical stress. Many examples can be found of the use of the second category, a change in some electrical property. For example, metals (and semiconductors) undergo a consistent change in resistance with changes in temperature, and most temperature transducers utilize this feature. Other examples include the strain gage, which measures mechanical deformation using the small change in resistance that occurs when the sensing material is stretched.
Many critical problems in medical diagnosis await the development of new approaches and new transducers. For example, coronary artery disease is a major cause of death in developed countries, and its treatment would greatly benefit from early detection. To facilitate early detection, a biomedical instrumentation system is required that is inexpensive and easy to operate so that it could be used for general screening. In coronary artery disease, blood flow to the arteries of the heart (i.e., coronaries) is reduced due to partial or complete blockage (i.e., stenoses). One conceptually simple and inexpensive approach is to detect the sounds generated by turbulent blood flow through partially included coronary arteries (called bruits when detected in other arteries such as the carotids). This approach requires a highly sensitive transducer(s), in this case a cardiac microphone, as well as advanced signal processing methods. Results of efforts based on this approach are ongoing, and the problem of noninvasive detection of coronary artery disease is not yet fully solved.
Other holy grails of diagnostic cardiology include noninvasive measurement of cardiac output (i.e., volume of blood flow pumped by the heart per unit time) and noninvasive measurement of internal cardiac pressures. The former has been approached using Doppler ultrasound, but this technique has not yet been accepted as reliable. Financial gain and modest fame awaits the biomedical engineer who develops instrumentation that adequately addresses any of these three outstanding measurement problems.
ANALOG SIGNAL PROCESSING
While the most extensive signal processing is usually performed on digitized data using algorithms implemented in software, some analog signal processing is usually necessary. The first analog stage depends on the basic transducer operation. If the transducer is based on a variation in electrical property, the first stage must convert that variation in electrical property into a variation in voltage. If the transducer element is single ended, i.e., only one element changes, then a constant current source can be used and the detector equation follows ohm’s law:
Copyright 2004 by Marcel Dekker, Inc. All Rights Reserved.
Vout = I(Z + ∆Z) |
where ∆Z = f(input energy). |
(1) |
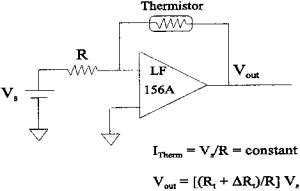
Figure 1.2 shows an example of a single transducer element used in operational amplifier circuit that provides constant current operation. The transducer element in this case is a thermistor, an element that changes its resistance with temperature. Using circuit analysis, it is easy to show that the thermistor is driven by a constant current of VS /R amps. The output, Vout, is [(RT + ∆RT)/R]VS. Alternatively, an approximate constant current source can be generated using a voltage source and a large series resistor, RS, where RS >> ∆R.
If the transducer can be configured differentially so that one element increases with increasing input energy while the other element decreases, the bridge circuit is commonly used as a detector. Figure 1.3 shows a device made to measure intestinal motility using strain gages. A bridge circuit detector is used in conjunction with a pair of differentially configured strain gages: when the intestine contracts, the end of the cantilever beam moves downward and the upper strain gage (visible) is stretched and increases in resistance while the lower strain gage (not visible) compresses and decreases in resistance. The output of the bridge circuit can be found from simple circuit analysis to be: Vout = VS∆R/2, where VS is the value of the source voltage. If the transducer operates based on a change in inductance or capacitance, the above techniques are still useful except a sinusoidal voltage source must be used.
If the transducer element is a voltage generator, the first stage is usually an amplifier. If the transducer produces a current output, as is the case in many electromagnetic detectors, then a current-to-voltage amplifier (also termed a transconductance amplifier) is used to produce a voltage output.
FIGURE 1.2 A thermistor (a semiconductor that changes resistance as a function of temperature) used in a constant current configuration.
Copyright 2004 by Marcel Dekker, Inc. All Rights Reserved.
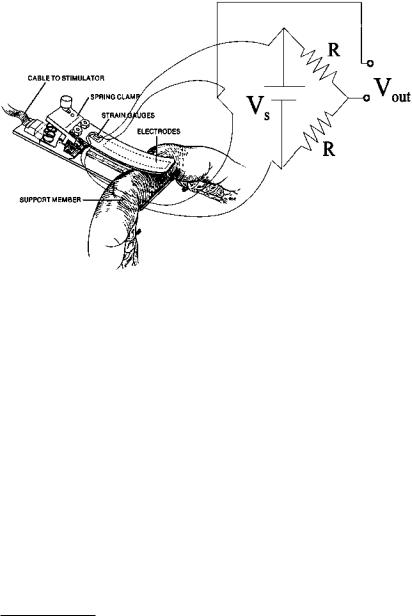
FIGURE 1.3 A strain gage probe used to measure motility of the intestine. The bridge circuit is used to convert differential change in resistance from a pair of strain gages into a change in voltage.
Figure 1.4 shows a photodiode transducer used with a transconductance amplifier. The output voltage is proportional to the current through the photodiode: Vout = RfIdiode. Bandwidth can be increased at the expense of added noise by reverse biasing the photodiode with a small voltage.* More sophisticated detection systems such as phase sensitive detectors (PSD) can be employed in some cases to improve noise rejection. A software implementation of PSD is described in Chapter 8. In a few circumstances, additional amplification beyond the first stage may be required.
SOURCES OF VARIABILITY: NOISE
In this text, noise is a very general and somewhat relative term: noise is what you do not want and signal is what you do want. Noise is inherent in most measurement systems and often the limiting factor in the performance of a medical instrument. Indeed, many signal processing techniques are motivated by the
*A bias voltage improves movement of charge through the diode decreasing the response time. From −10 to −50 volts are used, except in the case of avalanche photodiodes where a higher voltage is required.
Copyright 2004 by Marcel Dekker, Inc. All Rights Reserved.

FIGURE 1.4 Photodiode used in a transconductance amplifier.
desire to minimize the variability in the measurement. In biomedical measurements, variability has four different origins: (1) physiological variability; (2) environmental noise or interference; (3) transducer artifact; and (4) electronic noise. Physiological variability is due to the fact that the information you desire is based on a measurement subject to biological influences other than those of interest. For example, assessment of respiratory function based on the measurement of blood pO2 could be confounded by other physiological mechanisms that alter blood pO2. Physiological variability can be a very difficult problem to solve, sometimes requiring a totally different approach.
Environmental noise can come from sources external or internal to the body. A classic example is the measurement of fetal ECG where the desired signal is corrupted by the mother’s ECG. Since it is not possible to describe the specific characteristics of environmental noise, typical noise reduction techniques such as filtering are not usually successful. Sometimes environmental noise can be reduced using adaptive techniques such as those described in Chap- ter 8 since these techniques do not require prior knowledge of noise characteristics. Indeed, one of the approaches described in Chapter 8, adaptive noise cancellation, was initially developed to reduce the interference from the mother in the measurement of fetal ECG.
Transducer artifact is produced when the transducer responds to energy modalities other than that desired. For example, recordings of electrical potentials using electrodes placed on the skin are sensitive to motion artifact, where the electrodes respond to mechanical movement as well as the desired electrical signal. Transducer artifacts can sometimes be successfully addressed by modifications in transducer design. Aerospace research has led to the development of electrodes that are quite insensitive to motion artifact.
Copyright 2004 by Marcel Dekker, Inc. All Rights Reserved.
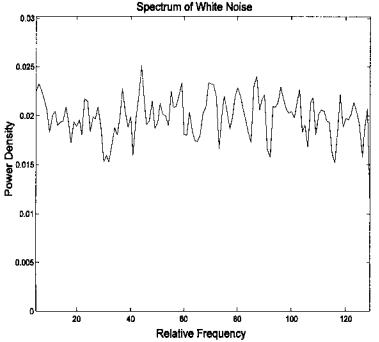
Unlike the other sources of variability, electronic noise has well-known sources and characteristics. Electronic noise falls into two broad classes: thermal or Johnson noise, and shot noise. The former is produced primarily in resistor or resistance materials while the latter is related to voltage barriers associated with semiconductors. Both sources produce noise with a broad range of frequencies often extending from DC to 1012–1013 Hz. Such a broad spectrum noise is referred to as white noise since it contains energy at all frequencies (or at least all the frequencies of interest to biomedical engineers). Figure 1.5 shows a plot of power density versus frequency for white noise calculated from a noise waveform (actually an array of random numbers) using the spectra analysis methods described in Chapter 3. Note that its energy is fairly constant across the spectral range.
The various sources of noise or variability along with their causes and possible remedies are presented in Table 1.2 below. Note that in three out of four instances, appropriate transducer design was useful in the reduction of the
FIGURE 1.5 Power density (power spectrum) of digitizied white noise showing a fairly constant value over frequency.
Copyright 2004 by Marcel Dekker, Inc. All Rights Reserved.