

Engineering and Manufacturing for Biotechnology - Marcel Hofman & Philippe Thonart
.pdfCrossflow ultrafiltration of B. licheniformis medium to separate protease enzymes
the enzyme concentration of the solution (Fig.l). Higher molecules than the MWCO of the membrane plug the pores leading to a decrease in membrane pore volumes, which cause an initial decrease in the permeate flux. The following cake layer formation, which results in concentration polarisation, continues the decrease in the permeate flux.
Since the cake layer is formed earlier and thicker in concentrated solutions, lower ultimate permeate fluxes were obtained in comparison with diluted solutions. The increase in the total resistance Rtot with enzyme concentration is given in Table 1. We separated more concentrated enzyme solutions (from 0.178 to 0.347 g dm-3 at v=0.32 m  and TMP=10 kPa) in our previous study and observed the similar trend in flux
declines (Takaç et al., 2000).
175
Serpil Takaç, Sema Elmas,  Tunçer H. Õzdamar
3.2. EFFECTS OF RECIRCULATION VELOCITY AND TRANSMEMBRANE PRESSURE
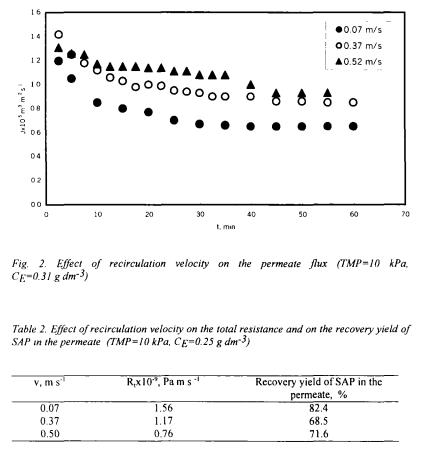
Hydrodynamic conditions such as recirculation velocity and TMP are among the major parameters that affect the ultrafiltration performance. The influence of recirculation velocity on the permeate flux was investigated at v=0.07, 0.37 and  values for 10±2.5 kPa TMP and
  initial total enzyme concentration. The increase in the recirculation velocity increased the permeate flux (Fig.2). The velocity directly affected the shear rate and increased the rate of removal of cake from the membrane surface. The initial decrease in the flux at high recirculation velocities was less than observed at low values since the cake layer formation delayed at high rates. The decrease in the total resistance
  with recirculation velocity is given in Table 2. The results obtained in this study are in accordance with those obtained in our previous study for 0.1, 0.2, 0.3 and
  velocities at
  enzyme concentration and for 0.38 and
  velocities at
  enzyme concentration (Takaç et al., 2000).
176

Crossflow ultrafiltration of B. licheniformis medium to separate protease enzymes
Transmembrane pressure serves as the driving force for ultrafiltration and increasing TMP results in increased flux at low pressures. However, above a limiting pressure the increase in flux decreases due to concentration polarisation (Lojkine et al., 1992). In our previous study, we investigated the effect of transmembrane pressure on the permeate
flux for |
and |
initial pressures at 0.38 and 0.50 |
recirculation |
velocities and 0.280 |
initial total enzyme concentration (Takaç et al., 2000). In |
||
each case, the permeate flux reached a constant value following an initial decrease and
20kPa TMP resulted in higher permeate fluxes. The cake layer resistance also decreased with increasing TMP. Throughout this study, however, initial TMP was kept constant at a low value i.e., at 10 kPa to reduce the rejection of molecules on the membrane surface; therefore, the effect of pressure on the ultrafiltration performance did not observe. Since not only increasing TPM but the values of recirculation velocity and enzyme concentration also affect the critical TMP value a detailed study is required to reduce the cake formation and to increase the permeate flux.
3.3. THE RECOVERED ACTIVITY OF SAP ENZYME AFTER SEPARATION
Ultrafiltration of enzymes differs from that of proteins in terms of loosing part or all of their catalytic activity in course of time during separation; and the conditions that give the highest permeate flux are not always optimum for the recovered enzyme activity after separation. We determined the activity of SAP by taking samples from the permeate tank in the end of experiments to compare it with the initial activity in the feed/retentate tank. The effects of enzyme concentration and recirculation velocity on the recovery yield of SAP in the permeate are given in Tables 1 and 2, respectively. Better separation of SAP from neutral protease and amylase enzymes with high recovery yield was achieved at low enzyme concentration and low recirculation velocity; where the increase in concentration decreased the recovery yield more drastically than the velocity caused. At the conditions used in the present study, SAP was best separated from high molecular weight enzymes with the recovery of 82% of its initial activity (Tables 1 and 2).
4. Conclusions
The present paper and first part of our previous paper (Takaç et al., 2000) describe the influences of crossflow ultrafiltration conditions for the separation of SAP from neutral protease and amylase enzymes of B. lichenifirmus fermentation medium. Although high permeate flux ascertains high performance of an ultrafiltration process, the catalytic stability is the crucial factor in enzyme separations. In our both studies, a decrease in the permeate flux with time in different quantities depending on operation conditions was observed. Faster filtration rates were obtained with lower enzyme concentrations due to lower cake growth rates. The increase in recirculation velocity, however, increased the flux since high velocity limits the cake growth or polarisation layer formation.
Accordingly, total resistance to flow in the ultrafiltration module calculated in this study increased with enzyme concentration and decreased with recirculation velocity. Due to possible shear inactivation, adsorption losses at the membrane surface or changes in the
177
Serpil Takaç, Sema Elmas,  Tunçer H. Özdamar
ionic environment during the ultrafiltration, the activity of the SAP enzyme decreased after each separation. The recovered SAP activity in the permeate decreased with recirculation velocity. Our results in the present study also show that initial total enzyme concentration more affected the recovered enzyme activity than recirculation velocity caused. This phenomenon may be explained by the complex structural interactions between enzyme molecules, which are more influenced by concentration.
Acknowledgements
The financial supports of The Scientific and Technical Research Center of Turkey  Contract No MISAG-61 and SPO (Turkey) Contract No 96K120400 are gratefully acknowledged. Cumhuriyet University is also acknowledged for giving S.Elmas a leave grant for her MSc studies in Ankara University.
References
Bohdziewich J. (1994) Ultrafiltration of technical proteolytic enzymes, Process Biochem., 29, 109-118. Boyd, R.F. and Zydney, A.L. (1998) Analysis of protein fouling during ultrafiltration using a two-layer
membrane model, Biotechnol. Bioeng., 59(4), 451-460.
Burns, D.B. and Zydney, A.L. (1999) Effect of solution pH on protein transport through ultrafiltration membrane, Biotechnol.Bioeng., 64(1), 27-37.

 G. and Özdamar, T.H (1998) Oxygen transfer effects in serine alkaline protease fermentation by Bacillus licheniformis: Use of citric acid as the carbon source, Enzyme Microb. Technol. 23,451-461
Elmas, S.(1997) Separation of protease enzymes from the reaction medium by ultrafiltration, M.S.Thesis, Ankara University, Ankara.
Flaschel, E., Wandrey, C. and Kula, M-R. (1983) Ultrafiltration for the separation of biocatalysts. Advances in Biochemical Engineering/ Biotechnology, 26, 73-82.
Gekas,V., Aimar,P., Lafaille,J-P. & Sanchez,V. (1993) A simulation study of the adsorption concentration polarisation interplay in protein ultrafiltration, Chem.Eng.Sci., 48(15), 2753-2765.
Gnosspelius, G. (1978) Purification and properties of an extracellular protease from Myxococcus virences, J.Bacterial., 133(1), 17-25.
Henriksen, P. and Hassager, O. (1993) Simulation of transport phenomena in ultrafiltration, Chem.Eng.Sci., 48(17), 2983-2999.
Kalisz, H.M. (1988) Microbial Proteinases, Advances in Biochemical Engineering/ Biotechnology, 36, 1-65. Lojkine,M.H., Field,R.W. and Howel, J.A. (1992) Crossflow microfiltration of cell suspensions: A review of
models with emphasis on particle size effects, TranslChemE C, 70, 149-164.
Lowry, O.H., Rosebrough, N.T., Fair, A.L., Randall, R.J. (1951) Protein measurement with folin phenol reagent. J .Biol Chem., 193,265-275.
Manachini, P.L., Fortina, M.G. and Parini, C.(1988) Thermostable alkaline protease produced by Bacillus thermoruber - a new species of Bacillus, Appl.Microbiol. Biotechnol., 28, 409-413.
Pradanos, P., Arribas, J.I. and Hernandez, A. (1992) Hydraulic permeability, mass transfer and retention of PEGs in cross-flow ultrafiltration through a symmetric microporous membrane. Sep.Sci.Tech., 27 (15), 2121-2142.
Pradanos, P., Arribas, J . I . and Hernandez, A. (1994) Retention of proteins in cross-flow UF through asymmetric inorganic membranes, AIChEJ, 40(11), 1901-1910.
Pradanos, P. and Hernandez, A. (1995). Cross-flow ultrafiltration of proteins through asymmetric polysulphonic membranes: I Retention curves and pore size distributions. Biotechnol. Bioeng., 47, 617-
625.
Pradanos, P. and Hernandez, A. (1996) Pore size distributions of polysulphonic UF membranes and protein adsorption. Sep.Sci.Tech., 31(17), 2419-2441.
178
Crossflow ultrafiltration of B. licheniformis medium to separate protease enzymes
Pradanos, P., Hernandez, A., Calvo, J.I. and Tejerina, F. (1996) Mechanism of protein fouling in cross-flow UF through an asymmetric inorganic membrane, J. Memb. Sci., 114, 115-126.
Reis, R., Gadam, S., Frautschy, L.N., Orlando, S., Goodrich, E.M., Saksena, S., Kuriyel, R., Simpson, C.M.,
Pearl, S. and Zydney, A.L. (1997) High performance tangential flow filtration, Biotechnol.Bioeng., 56(1), 71-82.
Roders, V.G. J. and Sparks, R.E. (1991) Reduction of membrane fouling in the ultrafiltration of binary protein mixture, AIChEJ., 37(10), 1517-1528.
Saksena, S. and Zydney, A.L. (1997), Influence of protein-protein interactions on bulk mass transport during ultrafiltration, J.Membrane Science, 125, 93-108.
Sheehan, J.J., Hamilton, B.K. and Levy, P.F. (1990) Pilot-scale membrane filtration process for the recovery of an extracellular bacterial protease. In: Downstream Processing and Bioseparations (Hamel, J-F.P., Hunter, J.B.& Sikdar, S.K, Eds.). ACS Symposium Series, Washington DC, 131-155.
Takaç, S., Elmas, S., Çalik, P., Özdamar, T.H. (2000), Separation of protease enzymes of Bacillus licheniformis from the fermentation medium by crossflow ultrafiltration, J.Chem.Tech. Biotechnol., 75, 491-499.
179
PART IV
MONITORING AND CONTROL
EVALUATING  DURING FERMENTATION USING MANY METHODS
SIMULTANEOUSLY
K. POULIOT1, J. THIBAULT2, A. GARNIER1, G. ACUNA LEIVA3
1 Department of Chemical Engineering, Laval University, Sainte-Foy
(Quebec), Canada G1K 7P4; 2Department of Chemical Engineering, University of Ottawa, Ottawa (Ontario) Canada KIN 6N5;
3Departamento de Ingenieria Informática, Universidad de Santiago de
Chile, Avda. Ecuador 3659, Casilla 10233, Santiago, Chile
Abstract
The oxygen mass transfer coefficient often serves to compare the efficiency of bioreactors and their mixing devices as well as being an important scale-up factor. In submerged fermentation, four methods are available to estimate the overall oxygen mass transfer coefficient  the dynamic method, the stationary method based on a previous determination of the oxygen uptake rate
  the gaseous oxygen balance and the carbon dioxide balance. Each method provides a distinct estimation of the value of
 Data reconciliation was used to obtain a more probable value of
  during the production of Saccharomyces cerevisiae, performed in 22.5-litre fed-batch bioreactor. The estimate of
  is obtained by minimising an objective function that includes measurement terms and oxygen conservation models, each being weighted according to their level of confidence. Weighting factors of measurement terms were taken as their respective inverse variance whereas weighting factors of oxygen conservation models were obtained using Monte Carlo simulations. Results show that more coherent and precise estimations of
  are obtained.
1. Introduction
The supply of oxygen is a critical factor in all aerobic fermentations. An insufficient oxygen transfer leads to a decrease of microbial growth and product formation. In order to assess if particular equipment would be able to supply oxygen at a non-limiting rate, it is essential to have a good estimate of the oxygen mass transfer coefficient  In
In
183
M. Hofman and P. Thonart (eds.), Engineering and Manufacturing for Biotechnology,183–201. © 2001 Kluwer Academic Publishers. Printed in the Netherlands.

K. Pouliot, J. Thibault, A. Garnier, G. Acuna Leiva
submerged fermentation, the oxygen mass transfer coefficient serves to compare the efficiency of bioreactors and their mixing devices. It is also one of the most important
scale-up factors [1,2]. |
|
Many methods for the determination of |
in submerged fermentation have been |
proposed. The majority of investigations have however been performed with water and other model fluids, in an attempt to mimic as closely as possible conditions encountered in fermentation systems. These investigations are very useful because conditions are well defined and can be rigorously controlled, and provide fairly good estimates of the oxygen mass transfer that can be used in design calculation. The determination of oxygen absorption from air into the fermentation broth should however be assessed under actual operating conditions of fermenters since the rate of oxygen absorption into a culture medium can be greatly affected by the presence of microorganisms, substrate, substances excreted by microorganisms and antifoam [3],  values in fermenters often differ substantially from values predicted for oxygen absorption into water or simple aqueous solutions even when differences in liquid physical properties such as viscosity and diffusivity are taken into account [4]. Methods for
  determination during the course of fermentation are normally classified as dynamic or steady state methods. The technique of dynamic measurements normally consists of following the dissolved oxygen concentration during a step change in the inlet gas concentration.
Only a fast response dissolved oxygen probe is required to obtain the necessary data.
The steady-state methods are based either on a global oxygen balance or a global carbon dioxide balance in the gas phase of the bioreactor. A fast response dissolved oxygen probe, and oxygen and carbon dioxide sensors are required. An additional steady-state method based on a prior estimation of the oxygen uptake rate  is also used to estimate
  . These methods are described with more details in the Materials and
Methods section.
In principle, the value of  obtained should be independent of the method employed and
  values estimated with the dynamic and steady state methods should indeed be identical. In fact, this ideal situation is rarely met and each method provides a distinct estimation of
  This may lead to some design problems in scaling-up fermenters if the scale-up method that is used is to maintain a constant oxygen mass transfer coefficient. Moreover, the accuracy of
  values obtained by those methods is based on the reliability of the measured data. Brown [5] indicates that even after a measuring device has been developed, there still remains problem of the reliability of the signal value. The calibration of the sensor and stability of the reading over a period of time are a part of the sensitivity problems that have to be taken into account. A large number of measured variables contain some degree of error. Therefore, data reconciliation techniques could be used with advantage to come up with the most probable value of
  In data reconciliation, both the reliability of data measurements and the accuracy of each estimation method are taken into consideration. Data reconciliation essentially consists of writing and minimising an objective function that considers the level of confidence on the various measurements and the oxygen conservation models.
In the present investigation,  has been evaluated by four different methods for the culture of Saccharomyces cerevisiae in a fedbatch bioreactor and data reconciliation
184

Evaluating  during fermentation using many methods simultaneously
has been used to determine a better estimate of the oxygen mass transfer coefficient. The objective function is composed of the weighted sum of 12 measurement terms and 6 terms for oxygen conservation models. The weight associated to each measurement term is the inverse of the measurement variance and the weights of conservation models have been estimated using a Monte Carlo method. The paper is divided as follow: after a description of the experimental system and a review of the methods for measuring
 the data reconciliation technique is presented and the main results are presented and discussed.
2. Materials and methods
2.1. ORGANISM AND MEDIUM
The strain used in this study was Saccharomyces cerevisiae. The culture medium composition was: 0.5 g peptone, 3 g yeast extract, 
 and 1.1 g glucose per litre of water. Two bags of 8 g of Fleischmann’s quick-rise yeast were used as inoculum and were added to an Erlenmeyer flask containing 750 ml of the medium given above. The cells were incubated on an orbital shaker at 25°C for 1.5 hours before being added to the fermenter.
Glucose was used as the carbon and energy source. The growth behaviour of
Saccharomyces cerevisiae is strongly influenced by glucose concentration. To avoid the Crabtree effect, glucose was fed in order to maintain a low concentration within the bioreactor. The Crabtree effect occurs at large glucose concentrations in an aerobic environment. The glucose is then predominantly fermented instead of being oxidised and ethanol and carbon dioxide are produced. Since one of the methods used to estimate
 value is based on the carbon dioxide production rate, this phenomenon would
induce a systematic error in the |
evaluation. Glucose oxidation can |
only be |
predominant in continuous cultures |
or fedbatch fermentations [6]. Thus, |
fed-batch |
fermentation has been performed under specific conditions. An optimisation procedure has been used to determine the glucose feeding rate as function of time. The objective was to maintain the respiratory quotient (RQ) around unity [7,8]. RQ corresponds to the ratio of the carbon dioxide evolution rate to the oxygen uptake rate. Therefore, a peristaltic pump (Masterflex Model 7521-50 with no. 13 C-Flex tubing) continuously fed a solution of 200 g/L glucose according to the rate determined by an optimisation routine. The cultivation medium, the Erlenmeyer flask containing the medium for the inoculum and the glucose solution were sterilised separately at 121°C and 200 kPa for 25 minutes. Antifoam agent (Dow Corning, Emulsion C for food grade) has been used whenever necessary.
2.2. EXPERIMENTAL SYSTEM
Fermentations were carried out in a baffled stirred tank reactor constructed in our laboratory. The fermenter is made of two concentric stainless steel columns. The
185
K. Pouliot, J. Thibault, A. Garnier, G. Acuna Leiva
annular section, in which water continuously circulates, is used as a heat exchanger to maintain a constant temperature inside the fermenter. The central column has an internal diameter of 228 mm and a height of 550 mm. The bioreactor has a total volume of
22.5 L.
The impeller was driven by a mechanical system composed of a motor (90 VDC, 1800 RPM, ½ HP, Frame 56C, Model 8293, Pacific-Scientific) and a ten-to-one speed reducer assembly (Model 201657, Doerr Electric). A speed controller (Multi-Drive
Model KBMD-240D, KB Electronics, Inc.) connected to the motor allows a variable speed in both clockwise and counter-clockwise rotation. Three Rushton turbines were mounted on the central shaft. Each turbine has 6 blades mounted on the periphery of a
50-mm diameter disk. Four baffles were placed inside the mixing vessel to favour turbulence and to prevent the formation of vortices.
Dissolved oxygen was measured with an amperometric oxygen electrode (Ingold, Model P/N 40179-02). The mass flow rate of compressed air or nitrogen, fed at the base of the column, was controlled with a mass flow meter (Matheson, Model 8272-0414). The gas sparger was a perforated plate that contains one hundred uniformly distributed holes, 1 mm in diameter. The concentration in the off gases was measured on-line. The  was detected by paramagnetism (Maihak, Multor 610) while
  was detected by infrared (Maihak, Multor 610). A silica gel column was used to dehumidify the exhaust air of the fermenter. Periodic measurements of the inlet air composition have also been performed. The data acquisition was done by a multiplexer connected to a personal computer.
In this investigation, the operating conditions have been kept constant throughout the fermentation. The stirring speed was 400 RPM and the airflow rate was 10 L/min. The volume of the medium in the fermenter varies from 15 L to 19.1 L since a glucose solution was continuously added.
2.3. REVIEW OF THE METHODS FOR MEASURING |
DURING THE COURSE |
OF FERMENTATION |
|
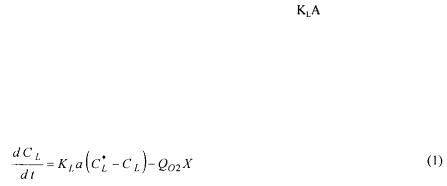
Two experimental on-line methods have been proposed to determine the value of  during the course of fermentation: the dynamic method and the overall gas balance. These two methods make use of the fate of the dissolved oxygen within the fermenter that is given by the following equation:
This equation states that the rate of change of the dissolved oxygen in the fermenter is equal to the rate of oxygen mass transfer from the gas to the liquid phase minus the rate of oxygen utilisation by the microorganisms.
186