

Engineering and Manufacturing for Biotechnology - Marcel Hofman & Philippe Thonart
.pdfEvaluating  during fermentation using many methods simultaneously
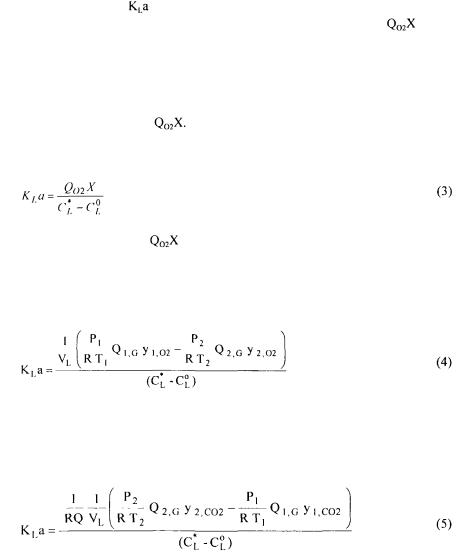
2.3.1. Dynamic method
In the dynamic method, first reported by Taguchi and Humphrey [9], the oxygen uptake rate (OUR or and
and  are determined in turn using the following procedure. The gas supply and the agitation are stopped momentarily to cut the oxygen supply to the liquid phase so that the rate of decrease of dissolved oxygen is caused entirely by the OUR. The decrease in dissolved oxygen is usually linear and the slope of the plot of
  as a function of time provides a direct estimate of the oxygen uptake rate (Figure 1).
The underlying hypothesis is that the rate of oxygen utilisation is unaffected by the absence of air bubbling and agitation, and lower dissolved oxygen concentration.
Before the dissolved oxygen concentration reaches its critical lower limit, aeration and agitation are resumed and the dissolved oxygen concentration normally returns to its initial level.  can be estimated using Equation (1), reformulated in terms of the dissolved oxygen concentration.
Equation (2) is the equation of a straight line and  can be readily obtained from the slope of this line. Estimations of
  and
and  using this method are somewhat dependent on the section of the curves that are used for their evaluation. In addition, the dynamics of the dissolved oxygen probe is not taken into account and could induce an important bias for higher values of
  .. The probe dynamics can be included by solving simultaneously the two differential equations (Equation 1 and a first order differential equation for the probe dynamics) to form an analytical solution or by solving the two dynamic differential equations using finite difference methods. It is important to point out that the estimate of
  using the dynamic method does not depend on the estimation of
  . Indeed, it can easily be shown that the dynamic response, after aeration and agitation are resumed, is independent of
  apart from having an influence on the final level of dissolved oxygen.
187
K. Pouliot, J. Thibault, A. Garnier, G. Acuna Leiva
In our experiments, a small variant of this method has been used. Aeration was cut momentarily whereas the agitation was reduced to 30 RPM in order to maintain cells in suspension. Indeed, if the agitation and the aeration are both stopped, cells decant and oxygen consumption is higher at the bottom of the fermenter. The probe cannot measure this consumption since it is located near the middle of the fermenter. With this
low agitation rate, both |
and surface aeration are negligible [10] so that the first term |
|
of the right hand side |
of Equation 1 can be safely put to zero and |
evaluated |
precisely. |
|
|
2.3.2. Steady-state methods
Three steady-state methods are available to determine  The gaseous oxygen mass balance method, the gaseous carbon dioxide mass balance technique and a method that
needs a prior estimation of |
Under pseudo-steady-state conditions, Equation (1) |
allows to readily calculate  using the following equation:
A previous estimation of |
is however needed and can be obtained from the |
dynamic method. This steady-state method will be referred as the stationary method. Under steady-state conditions, the oxygen deficit of the gas stream across the
fermenter must be equal to the oxygen uptake rate. Equation 4 allows determining  by the gaseous oxygen mass balance technique:
Finally, the gaseous carbon dioxide production rate can also be used as described by the following equation:
To use this method, an estimation of the respiratory quotient (RQ) must be available a priori. A good estimate of RQ is available for a large number of fermentations or can also be estimated from past fermentations.
188
Evaluating  during fermentation using many methods simultaneously
Since it is now more common for fermentation systems to be equipped with an  monitor or mass spectrometer [11], up to four methods are available to determine
  thereby leading to four different estimates. A simple average of the four values could be taken to give a unique and more precise value of
  However, as some methods are more accurate than others at different stages of fermentation, averaging
  is not the best method to achieve a more precise value. Instead, a data reconciliation technique could be used with advantage to resolve this problem. This technique, briefly described in the next section, considers the precision of each measurement and each estimation
method to provide the best estimate of the |
value. |
2.4. DATA RECONCILIATION METHOD |
|
The availability of accurate process data is no doubt the prerequisite condition to successful cost accounting, process control, statistical quality analysis, and performance evaluation. Unfortunately, measurements of variables in most processes are generally subject to significant random and non-random errors. It is therefore important that these measurement errors be corrected before using the measured variables for final process analysis and control. Data reconciliation, as an on-line optimisation method, is sometimes used in process industries to reduce these errors in order that the adjusted or reconciled values of the process measurements around a given system obey conservation laws as well as other physical and chemical constraints. Steady-state material and/or energy balances are commonly used as the constraints. It is important to point out that, to perform process data reconciliation, the measured data must be redundant; that is, there exist more measured data than are necessary to satisfy system balances.
A large amount of research work has been devoted to data reconciliation problems [12-18]. The measured data are generally contaminated with different types of system noises and, at the same time, system models are seldom a perfect representation of the underlying behaviour of the process so that data reconciliation has to be performed by taking into account both the measurement errors and the process modelling errors. To achieve this dual objective, general criteria for data reconciliation can be defined to take simultaneously into account all measured variables and all conservation models, each one being affected by a weight that corresponds to the level of confidence that one has in each measurement and each conservation model. This dual objective has been used successfully for mineral processing plants [14,18].
In the case of the fermentation system described earlier, a series of measured or estimated variables is required for the determination of the overall oxygen mass transfer coefficient  by at least one method. These variables are: the pressure (P), the
temperature (T), the time constant |
of the dissolved oxygen probe |
the |
saturated |
|
dissolved oxygen |
concentration |
the dissolved oxygen concentration |
the |
|
liquid volume |
the respiratory |
quotient (RQ), the gas flow rate |
the |
oxygen |
mole fraction in the inlet gas |
the oxygen mole fraction in the outlet gas |
|||
the carbon dioxide mole fraction in the inlet gas  and the carbon dioxide mole fraction in the outlet gas
  These represent a total of 12 variables that are either measured or estimated, and to each of them is associated a certain level of accuracy. In
189
K. Pouliot, J. Thibault, A. Garnier, G. Acuna Leiva
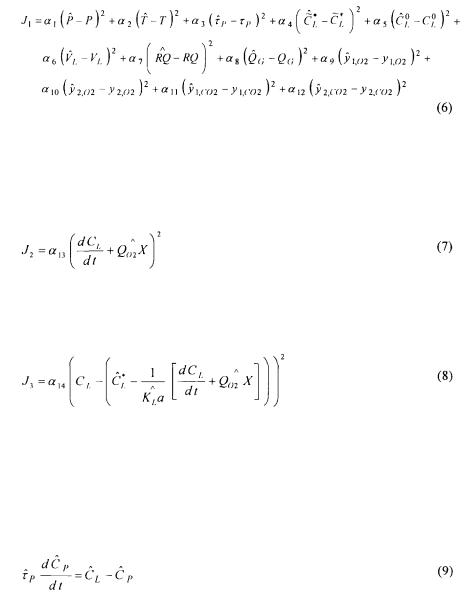
addition, six oxygen mass conservation equation models that make use of these variables are available. It is therefore possible to write an objective cost function that is comprised of the weighted sum of all 12 measurements or estimations, and all oxygen conservation models. To better understand the make up of the complete objective function, it has been divided into partial objective functions. The first partial objective function  considers all measurements or estimations that are involved in the determination of
 by one method or another:
The hat indicates the estimated values. This partial objective function implies that the estimated values should be kept as close as possible to their respective measured values.
The next partial objective function  considers the estimation of
  from the slope of the first portion of the curve associated to the dynamic method, that is where agitation has ceased, thereby rendering the supply of dissolved oxygen negligible.
The partial objective function  of the second portion of the curve associated with the dynamic method and which provides an estimate of
  is given by the following equation:
Partial objective functions  can simply be solved by evaluating respectively the slope of the rate of change in dissolved oxygen when aeration and agitation are stopped, and the slope of Equation (2) when aeration and agitation are resumed. In this investigation, Equation (1) was solved by finite differences simultaneously with the dynamics of the dissolved oxygen probe for both portions of the dynamic curve. For the decreasing portion of the curve,
  was set to zero. The dynamics of the dissolved oxygen probe was simulated using the following first order equation:
190
Evaluating  during fermentation using many methods simultaneously
The partial objective functions  and
and  were therefore set equal, for the two portions of the dynamic response curve, to the average difference between the predicted and experimental probe dissolved oxygen concentrations. The predicted dissolved oxygen concentration, as measured by the probe, was simulated by finite differences using the
most current estimates of
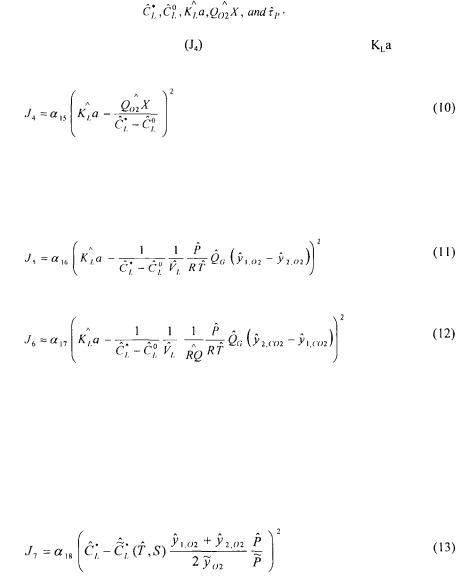
The partial objective function |
associated to the estimation of |
using Equation |
(3) is given by: |
|
|
The next two partial objective functions  and
and  are very similar to the previous partial objective function. The difference lies in the way the estimation of the oxygen uptake rate is performed. The two partial objective functions use the information provided by
  and
and  gas balances:
It is assumed that the gas flow rate, the pressure and the temperature were identical for the inlet and outlet gas streams. This is a reasonable assumption since the respiratory coefficient is close to unity, and the outlet stream is dehumidified before being analysed.
Since the saturated dissolved oxygen concentration depends on the average gaseous oxygen concentration within the fermenter, on the total pressure and the chemical components of the fermentation broth, an additional term  was added to the overall objective function to include its estimate:
The value of the saturation dissolved oxygen concentration  was evaluated at the temperature of the fermenter broth and corrected for its initial chemical composition [19].
191
K. Pouliot, J. Thibault, A. Garnier, G. Acuna Leiva
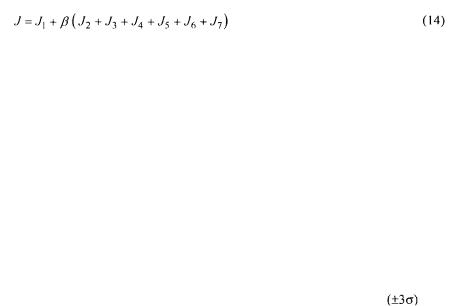
All the partial objective functions can now be joined together to form the overall data reconciliation objective function expressed by the following equation:
The parameter  is an additional weighing factor that is used to put more or less emphasis on the oxygen conservation models with respect to the measurements.
A net advantage of using data reconciliation methods is that the user is forced to examine the precision of all measured variables and conservation models, and the relative precision of all terms of the objective function are considered in estimating a unique value of 
2.4.1. Weighting factors
To solve the objective function and obtain the most probable value of  weighting factors
  must be specified according to the respective level of confidence on each measurement and oxygen conservation model. Assuming that measurement errors are normally distributed, the level of confidence of a process variable is related to its variance. The weighting factor for each measurement term was therefore set equal to its inverse variance. The estimation of the variance of each measurement considers the accuracy of the sensing device, calibration errors, stability of the signal over a period of
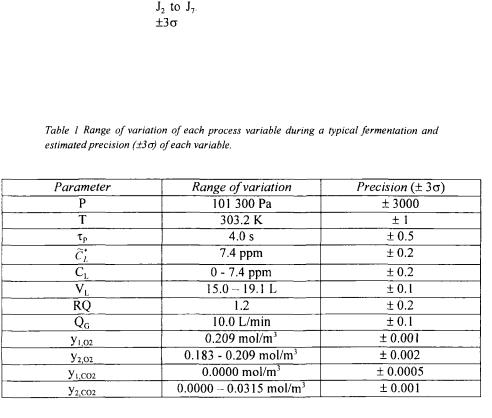
time, and measurement errors. Table 1 gives the estimated precision |
of each |
process variable that is used in oxygen conservation models to determine  Table 1 also gives the range of variation of each process variable during a typical fermentation performed in this investigation. The saturated dissolved oxygen concentration
  takes into account the concentration of nutrients, which affect the oxygen solubility [19]. The time constant of the dissolved oxygen probe
  was evaluated with separate experiments in water under identical conditions of agitation and aeration.
The estimation of  values using oxygen conservation models largely depends on the precision of measurements used in each conservation model. Weighting factors of conservation models must therefore be determined considering the individual precision of each measured variable. Since the precision of each conservation model varies during the course of fermentation, it is necessary to determine weighting factors for each individual experimental test performed at regular intervals. For instance, in the last portion of the exponential growth phase, provided that all other operating conditions remain identical, estimation of
  using the oxygen and carbon dioxide mass balance is more accurate because the differences between the input and the output concentrations are larger. To obtain the respective weighting factors for each individual experiment, a Monte Carlo simulation method was used. Monte Carlo simulation is a mathematical technique for numerically solving differential or algebraic equations. It is used extensively in science to solve many problems for which no other solutions exist.
It consists of using random numbers to generate a large number of possible scenarios and the results of the many scenarios are analysed statistically to obtain information on estimated average value and variability of possible results. The answers are always approximate, but with sufficient number of scenarios, tend to converge to the theoretical
192
Evaluating  during fermentation using many methods simultaneously
answers. In the present investigation, 1000 simulations were performed to evaluate
partial objective functions |
. In each simulation, the 12 process variables were |
generated in the range of |
of each variable measured at each fermentation time |
using random gaussian numbers. Then, the variance of each partial objective function was evaluated in order to provide the relative accuracy of each oxygen conservation term in the overall objective function. The inverse of the calculated variance of each partial objective function was used as the weighting factor.
3. Results and discussion
Data reconciliation methods are frequently used on-line to provide more coherent and accurate values of process variables that are subsequently used in control strategies and yield calculations. In the particular application of  estimation, an instantaneous value of
  can only be obtained from the gas stream analysis and a better and more coherent value can be determined only after the completion of the dynamic method, when an estimate of
  is available and the value of
  can be estimated using the four different methods.
To obtain an instantaneous value of  both the oxygen and carbon dioxide mass balance methods can be used. However, at the beginning of the fermentation, the differences of oxygen and carbon dioxide concentrations between the inlet and the outlet gas streams are generally low. The accurate estimation of
  by these two methods strongly relies on the precision of the
  and
and  sensors, and of the mass flow meter.
  estimation using the oxygen mass balance method can be directly
193
K. Pouliot, J. Thibault, A. Garnier, G. Acuna Leiva
calculated from experimental measurements whereas the estimation with carbon dioxide mass balance method requires the a priori knowledge of the respiratory quotient (RQ).
In this investigation, the purpose of using a fed-batch system to produce S. cerevisiae was to maintain the respiratory quotient as close as possible to unity during the course of the fermentation. A RQ of unity corresponds to the purely oxidative metabolism under which only carbon dioxide is formed, without ethanol formation.
During aerobic growth of S. cerevisiae, ethanol is formed when the glucose concentration exceeds a certain critical level. In practice, under stringent control of glucose concentration, the RQ slightly exceeds unity due to the anabolic process and it is approximately equal to 1.04 [20,21]. Because the value of RQ must be known a priori
in order to use the carbon dioxide mass balance method to estimate |
its value was |
estimated from prior experiments. The nominal value, used in the data reconciliation objective function, was 1.2 with a precision of  (Table 1). The RQ value remained in this range for the majority of the fermentation and it was therefore assumed constant.
Toward the end of fermentation, RQ values had the tendency to increase as high as 1.6. The influence of RQ will be discussed later.
The overall oxygen mass transfer coefficient has been estimated by the four methods at a time interval of approximately 1.5 h for a total fermentation time of 24 h. For each set of data, Monte Carlo simulations were performed to determine the respective weighting factors for each partial objective function. The overall objective function was minimised using a quasi-Newton optimisation routine in order to obtain estimated
values of the 12 measurements of Table |
1 as well as estimates of |
and |
for a |
||
total of 14 parameters. Initial estimates |
of |
and |
were |
obtained graphically |
|
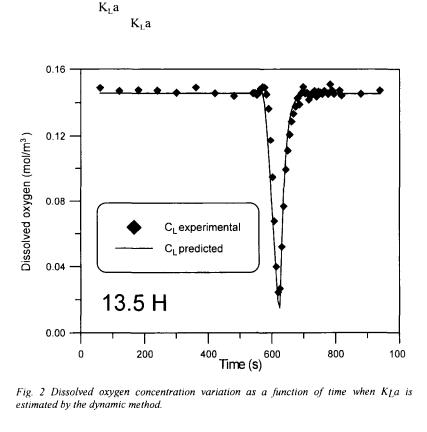
using the original method proposed by Taguchi and Humphrey [9]. In the present investigation, equations associated with the dynamic method were solved by finite differences in order to include the dynamics of the dissolved oxygen probe. The sequence of data associated with the dynamic method was split into two segments, and two partial objective functions  and
and  were defined to minimise the sum of squares of the differences between the experimental and predicted responses of the dissolved oxygen probe. Figure 2 compares the predicted response, using the converged values of
  and
and  , with the experimental data for the test performed at a fermentation time of 13.5 h. It is clear that the converged values lead to a good fit of the experimental
data. |
|
|
The estimation of |
with the three other steady-state methods |
depends on the |
converged values of the |
12 measurements and the converged value of |
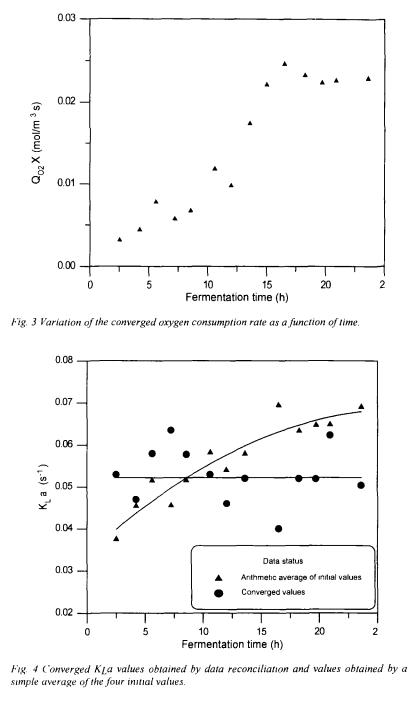
Figure 3 |
illustrates the variation of the converged oxygen consumption rate as a function of time. It shows that the maximum metabolic activity was reached at around 16 h. Given all the
weighting factors, the data reconciliation routine determines the best estimate of |
to |
|
minimise the overall objective function. Figure 4 compares |
values obtained by data |
|
reconciliation and values obtained by taking a simple arithmetic average of the four initial  values. The initial values correspond to the values estimated by each method
before applying data reconciliation. Results indicate that the average |
value |
increases with time whereas the converged  remains fairly constant. It is normally accepted that for a non viscous fermentation, such as the production of S. cerevisiae,
  remains relatively constant during the course of fermentation if the air flow rate, the
194
Evaluating  during fermentation using many methods simultaneously
agitation speed and all the other experimental conditions are kept constant. Small  changes could occur since it is slightly affected by cell concentration, metabolite production, and addition of antifoaming agent [3,22]. These changes could lead to slight
  variation but never to the extent depicted by the variation of the arithmetic average. Converged
  values obtained by data reconciliation also varied but swayed around 0.053
  with a standard deviation of
  . It is postulated that data reconciliation provides more precise
  values since it takes into account the possible errors of the various measurements and the relative accuracy of each oxygen conservation model.
For a fermentation time superior to 20 h, high estimated values of  obtained by the simple arithmetic average are partly due to the respiratory quotient estimation. After a fermentation time of 20 h, the average respiratory quotient is around 1.60 whereas it was assumed constant during the entire fermentation with a value of 1.20. This implies
an overestimation of |
values by the carbon dioxide method and, as a result, the |
|
arithmetic average value |
of |
is significantly biased. Data reconciliation has allowed |
taking into account this error.
195
K. Pouliot, J. Thibault, A. Garnier, G. Acuna Leiva
196