

Engineering and Manufacturing for Biotechnology - Marcel Hofman & Philippe Thonart
.pdfEvaluating KLa during fermentation using many methods simultaneously
Figure 5 presents the converged  a values and those obtained by each of the four methods at five different fermentation times. Values presented for the dynamic method are not reconciled. They were obtained using the original graphical method proposed by Taguchi and Humphrey [9]. The estimation of these
  a values does not take into account the measurement errors and the dynamics of the dissolved oxygen probe. As a result, variations of estimated
  a values are significantly larger than the reconciled values. The estimations of
 a with the other three methods were calculated using the converged values of the 12 parameters and of the value of
  The stationary method is the one that provides values that have the smallest variability and that are closer to final reconciled values. This good prediction is due to the excellent accuracy in evaluating the dissolved oxygen concentration and the oxygen utilisation rate that are used in the stationary oxygen conservation model (Eq. 3).
 a values estimated by the two gas mass balance methods tend to increase during the course of fermentation. The
increase is more pronounced for |
a values estimated with the difference in |
concentration. This overestimation |
is due to the RQ estimation. After 20 h of |
fermentation, the average respiratory quotient is in the vicinity of 1.60 instead of the assumed constant value of 1.20. The data reconciliation technique modifies slightly the
value of RQ to reduce the overestimation |
of |
a. Ways to improve the estimation of |
|
a by the |
gas balance method are: |
(1) |
to reduce the weighting factor of the |
estimated RQ term in the objective function, toward the end of fermentation, to allow
the optimisation routine to make greater changes in RQ, and (2) |
to estimate on-line the |
|
current value of RQ some time before a |
a estimation is |
performed instead of |
assuming a constant value during the entire fermentation. |
|
|
197

K. Pouliot, J. Thibault, A. Garnier, O. Acuna Leiva
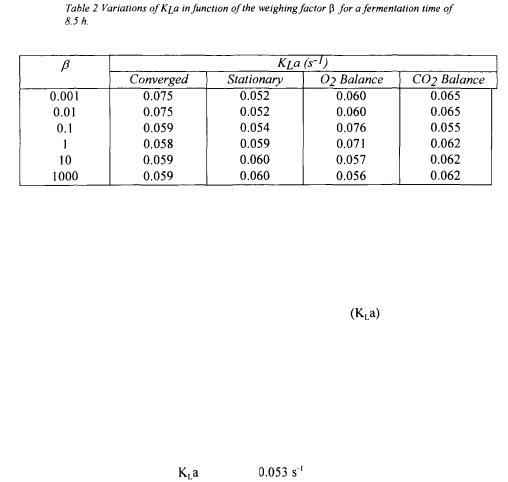
Since data reconciliation forces the user to examine the precision of all measured variables and conservation models, an additional weighting factor  (Eq.14) was incorporated in the model. This weighting factor serves to put more or less emphasis on the oxygen conservation models with respect to the measurements. Results presented previously were obtained for a weighing factor
  equal to 1. Table 2 presents
  values for a variation of
  between 0.001 and 1000 at a fermentation time of 8.5 h.
When more emphasis is put on models, a obtained by each method tends to be closer to the converged value. This however implies that the optimisation algorithm can make important changes in the values of the 12 parameters, and if the value of  is excessively high, unrealistic values of variables are obtained. On the other hand, when significantly less emphasis is put on the models, the objective function boils down in minimising the sum of squares between the estimated and measured values. A weighting factor smaller than 0.01 or greater than 1000 has no further impact on the outcome of the estimation of
 The selection of the value of
  is partly subjective but the results of Table 2 show that the range of variation of
  a with
  is not excessively large so that no serious damage would occur if a value of
  slightly different than the optimal would be used. Users can choose to put more or less importance on the variables or the models but, in general, it is recommended to use a weighting factor
  equal to the unity since Monte Carlo simulations determine the level of confidence for the oxygen conservation models and take into account the precision of each parameter.
Few additional considerations for the evaluation of  a using the technique presented in this paper need to be addressed. First, it was assumed that the fermentation broth had a uniform concentration of dissolved oxygen and cells, as well as a value of
  a independent of position within the fermenter. In the present investigation, these are reasonable assumptions because of the relatively high intensity of mixing and the low viscosity of the fermentation broth. For a highly viscous fermentation broth, where large variations of the concentration of dissolved oxygen and
  a normally occur, all four estimation methods would provide erroneous values of the overall oxygen mass transfer coefficient because they all rely on the measurement of the dissolved oxygen
concentration |
by the oxygen probe. For instance, if the probe is in a region |
of lower |
|||
dissolved oxygen concentration than the bulk average, |
a estimated |
by the |
two |
gas |
|
mass balance |
methods would be underestimated. Secondly, if the |
activity |
of |
the |
|
biochemical reaction is high enough to significantly reduce the level of dissolved oxygen in the fermentation broth, then the estimation with the dynamic method would be impossible and only the two methods based on the gas mass balances would be applicable. Under these circumstances, the value of  a would be estimated fairly accurately because of the
  and
and  concentration differences would be higher.
Thirdly, if the biochemical activity is slow as in the case of animal and vegetal cell
cultures, the stationary method and the methods based on |
and |
mass balances |
would greatly suffer in precision. In that case, the dynamic method would provide a more accurate estimate of However, the data reconciliation technique presented in this paper would automatically, through weighting factors found in a Monte Carlo simulation, put significantly more weight on the dynamic method terms (partial objective functions J2 and J3).
198
Evaluating KLa during fermentation using many methods simultaneously
4. Conclusion
In this investigation, data reconciliation was used to estimate a more probable value of KLa during the course of fermentation. Data reconciliation is based on statistical adjustment of redundant process data to obey laws of mass and energy conservation principles. In submerged fermentation, there are four possible methods available to
estimate the overall oxygen mass transfer coefficient |
in the course of |
fermentation: the dynamic method, the stationary method, the gaseous oxygen balance and carbon dioxide balance. Each method provides a distinct value of  Data reconciliation technique was therefore used to obtain the most probable
  value that takes into account both measurement and process modelling errors. An objective function, composed of the weighted sum of 12 measurement terms and 6 terms for oxygen conservation models, was minimised using a quasi-Newton optimisation routine. Weighting factors of each measurement term can be easily determined whereas Monte Carlo simulation was used to determine the relative weighting factors for each
oxygen conservation model. |
|
|
The converged estimated |
value was |
with a standard deviation of 15 %. |
Results clearly showed that a simple arithmetic average of the distinct values, obtained with the four methods, is not adequate to estimate the proper value of  A net advantage of using data reconciliation is that the user is forced to examine the precision of all measured variables and oxygen conservation models.
Acknowledgements
The Natural Science and Engineering Research Council of Canada, FONDECYT 1980667, and FONDECYT 7980028 have supported this work.
199
K. Pouliot, J. Thibault, A. Garnier, G. Acuna Leiva
References
1. Jarai, M: Factors Affecting the Scale-up of Aerated Fermentation Processes. Int. Chem. Eng. 19 (1979) 710.
2.Moo-Young, M.; Blanch, H.W.: Design of Biochemical Reactors – Mass transfer Criteria for Simple and Complex Systems. In: Advances in Biochemical Engineering Biotechnology Mineral Engineering. 8 (7) (1995) 753.
3.Yagi, H.; Yoshida, F.: Oxygen Absorption in Fermenters – Effects of Surfactants, Antifoaming Agents, and Sterilised Cells. J. Ferment. Technol. 52 (1974) 905.
4. |
L.; Thibault, J.; LeDuy A.: Measuring |
a with Randomly Pulsed Dynamic Method. |
|
Biotechnol. Bioeng., 37 (1991) 889. |
|
5.Brown, D.E.: Bioprocess Measurements and Control. Chem. Ind., 16 Sep. (1991) 678.
6.Yamane, T.; Shimizu S.: Adv. Bioch. Eng./Biotechnol. 30 (1984) 147.
7.Copella, S.J.; Dhurjati P.: A Detailed Analysis of Saccharomyces cerevisiae Growth Kinetics in Batch, Fed-batch, and Hollow-fibre Bioreactors. Chem. Eng. J. 41 (1989)827.
8.Wang, H.Y.; Cooney, C.L.; Wang D.I.C.: Computer-Aided Baker’s Yeast Fermentations. Biotechnol.
Bioeng. 19 (1977) 69.
9. H.; Humphrey, A.E.: Dynamic Measurement of the Volumetric Oxygen Transfer Coefficient in Fermentation Systems. J. Ferment. 44 (1966) 881.
10.Gagnon, H.; Lounes, M.; Thibault, J.: Power consumption and mass transfer in agitated gas-liquid columns: a comparative study. Can. J. Chem. Eng. 76 (1998) 379-389.
1 1 . Heinzle, E.: Present and Potential Applications of Mass Spectrometry for Bioprocess Research and Control. J. Biotechnol. 25 (1992) 81.
12.Crowe, C.M.: Observability and Redundancy of Process Data for Steady State Reconciliation. Chem.
Eng. Sci. 44 (1989) 2909.
13.Hodouin, D.; Everell, M.D.: A Hierarchical Procedure for Adjustment and Material Balancing of Mineral Process Data. Int. J. Mineral Processing. 7 (1980) 91.
14.Hodouin, D.; Bazin, C.; Makni, S.: On-Line Reconciliation of Mineral Processing Data. Proc. of the AIME/SME Symposium - Emerging Computer Techniques for the Mineral Industry," Reno, Nevada, Feb. 1993.
15.Hodouin, D.; Bazin, C.; Makni, S.: Dynamic Material Balance Algorithm: Application to Industrial
Flotation Circuits. SME / AIME Annual Meeting, Phoenix, Arizona, March 1996.
16.Liebman, M.J.; Edgar, T.F.; Lasdon, L.S.: Efficient Data Reconciliation and Estimation for Dynamic Processes Using Nonlinear Programming Techniques Computer Chem. Eng. 16 (1992) 963.
17.Mah, R.S.H.: Chemical Process Structures and Information Flows. Batterworths, Boston 1990.
18.Makni, S.; Hodouin, D.; Bazin, C.: A Recursive Node Imbalance Method Incorporating a Model of
Flowrate Dynamics for On-Line Material Balance of Complex Flowsheets. Mineral Eng. 8(7) (1995) 753.
19.Schumpe, A.; Adler, I.; Deckwer, W.D.: Solubility of Oxygen in Electrolyte Solutions. Biotechnol. Bioeng. 20 (1978) 145.
20.Shuler, M.L.; Kargi, F.: Bioprocess Engineering – Basic Principles. Prentice Hall PTR, Englewood Cliffs, New Jersey 1992.
21.Nielsen, J.; Villadsen, J.: Bioreaction Engineering Principles. Plenum Press, New York, 1994.
22.Lavery, M.; Nienow, A.W.: Oxygen Transfer in Animal Cells Culture Medium. Biotechnol. Bioeng. 30
(1986) 368.
Nomenclature
dissolved oxygen concentration 
pseudo-steady-state dissolved oxygen concentration recorded at the initiation of the dynamic method
dissolved oxygen concentration in equilibrium with mean gaseous oxygen concentration
200
Evaluating KLa during fermentation using many methods simultaneously
dissolved oxygen concentration recorded by the probe 
 overall oxygen mass transfer coefficient J objective function
Ppressure (Pa)
gas flow rate  oxygen uptake rate
Rgas constant 
Ssubstrate
RQ |
respiratory quotient |
T |
temperature (K) |
|
liquid volume in the fermenter |
ygaseous mole fraction
GREEK LETTERS
aweighting factor associated to each term in the objective function
relative weighting factor between measurements and conservation models time constant of the dissolved oxygen probe (s)
SUBSCRIPTS
1 inlet stream
2outlet stream
carbon dioxide oxygen
SYMBOLS
estimated values
corresponds to ideal or theoretical conditions
201
RESPIRATION QUOTIENT: ESTIMATION DURING BATCH CULTIVATION IN BICARBONATE BUFFERED MEDIA
RONALD NEELEMAN
Wageningen University, Systems and Control Group
Bomenweg 4, 6703 HD, Wageningen, The Netherlands.
Abstract
The Respiration Quotient (RQ) is a key metabolic parameter for cell cultures and is usually determined from gas analysis only. In bicarbonate buffered media the carbon dioxide balance is affected by accumulation and hence the RQ can not directly be calculated from gas measurements. A Kalman Filter as software sensor that estimates the CER can cope with these buffering capacities and thus is used for determining the RQ. The model used by the Kalman Filter lumps all carbonate in the liquid to one term in order to eliminate the role of a priori knowledge of cell and medium kinetics without affecting the performance.
1. Introduction
Animal cells, yeast cells and aerobic microbial cells oxidise organic compounds into water, carbon dioxide and other organic compounds to gain energy for their maintenance and growth. As such these organisms consume oxygen and produce carbon dioxide with rates called the oxygen uptake rate (OUR) and the carbon dioxide evolution rate (CER). These rates are direct indicators of metabolic activity. Their ratio called the respiration quotient (RQ = CER I OUR) varies with the nature of the substrates and products of the organism. Bonarius et al. (1995) and Royce (1992) argue that for cell cultures the RQ can be considered as a key metabolic parameter making it possible to detect on what medium substrate the organism grows.
Furthermore, stoichiometric coefficients, e.g. yields, are usually determined using elemental balancing (conservation of chemical elements). This set of balance equations can mostly not be solved since the number of unknown coefficients exceeds the number of balance equations. Additional information is required and with the right set of extra measurements the equations become solvable. Measuring the RQ introduces such information to solve the balance equations and calculate the stoichiometric coefficients.
203
M. Hofinan and P. Thonart (eds.). Engineering and Manufacturing for Biotechnology, 203–216.
© 2001 Kluwer Academic Publishers. Printed in the Netherlands.

Ronald Neeleman
By means of RQ measurements it has been possible to close mass balances and to determine metabolic flux distributions for yeast (Vallino, 1993). RQ data has also been used for on-line bioreactor control, for example to minimise glucose effects (Wang, 1979) or to optimise substrate consumption in yeast (Wu, 1993). Its accurate evaluation is hence of great importance.
The fig-value can be calculated using the oxygen and carbon dioxide concentrations in the gas stream into and from the reactor headspace (Bonarius et al., 1995). However, the effect of pH control action on carbon dioxide evolved from the medium troubles the measurement of the CER. Royce (1992) describes this phenomenon together with a solution to compensate for these so-called pH-effects. Besides these pH-effects, buffering capacity (e.g. bicarbonate) of the medium also troubles on-line determination of the CER. When the reactor is not in steady state (e.g. batch cultivation), direct measurement of carbon dioxide concentrations in the inlet and outlet of the reactor headspace does not satisfy. Dissociation and accumulation of carbon dioxide in the medium and headspace disturbs the steady state balance and results in an incorrect
CER- and thus
To manage such problems software-sensors based on standard measurements are combined with mathematical observers to derive the internal states of the system. Stephanopoulos and San (1984) gave an extensive discussion on such observer-based software-sensors for the reconstruction of the process states. For example the achieved amount of biomass and substrate concentrations are derived from oxygen and carbon dioxide measurements. Other important work in this area was produced by Bastin and Dochain (1990) and concerned observer-based software-sensors for adaptive control.
All the work in this area was focussed on biomass and substrate estimation and requires more or less detailed a priori knowledge of the system. However, for monitoring and control purposes it is not always necessary to know the states, in a lot of applications only an indicator is needed on what substrate is being used or is necessary to be added.
This chapter describes and discusses a Kalman Filtering algorithm as software-sensor for estimating the  for batch cell cultivation from carbon dioxide measurements as presented by Neeleman (1999). The sensor will take account for buffering capacities of the media for carbon dioxide.
2. Gas concentrations in batch-wise cell cultures
For the on-line calculation of the RQ, the OUR and CER have to be known (measured or estimated) on-line. Two different methods are applied in the determination of these rates. First the OUR will be deduced directly from gas analyses and liquid measurements. Since there are no satisfactory sensors for dissolved carbon dioxide and the accumulation of carbon dioxide can not be discarded an estimator is developed for the on-line estimation of the CER. Finally the ratio of these rates will give the fig-value.
2.1. OXYGEN UPTAKE RATE (OUR)
In their general form the mass balances for oxygen in the gas and liquid phases include accumulation terms for oxygen. However, oxygen is sparingly soluble in aqueous
204
Respiration quotient: estimation during batch cultivation in bicarbonate buffered media
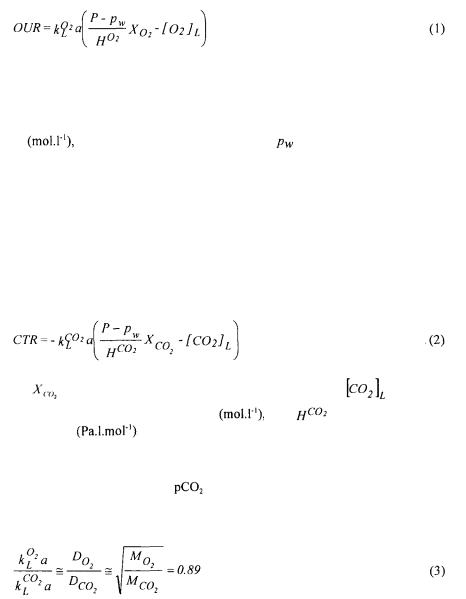
solutions and usually kept constant by a controller. Therefore accumulation of the dissolved oxygen concentration will be very small and makes the OUR practically equal to the transfer rate of oxygen over the gas-liquid interface. As a consequence the OUR can be deduced directly from gas and liquid analyses only:
For this expression it is assumed that the gas and the liquid phase are sufficiently mixed
and that the gas flow rate is high so that  represents the fraction of oxygen in the headspace of the bioreactor,
  the oxygen concentration in the liquid
phase |
P the headspace pressure (Pa) and |
the partial vapour pressure of |
water, which has to be taken into account because the oxygen fraction is expressed on a dry basis.  is Henry's constant for oxygen
  The mass transfer coefficient for oxygen transfer,
  is expressed in
  and can experimentally be determined using the dynamic method (van 't Riet, 1991).
2.2. CARBON DIOXIDE EQUILIBRIUM IN THE GAS PHASE
The transfer of carbon dioxide across the gas-liquid interface is a physical process (as for oxygen), which is liquid-film limited:
where |
is the fraction of carbon dioxide |
in the headspace, |
is the carbon |
||
dioxide concentration in the liquid phase |
, and |
the Henry's constant for |
|||
carbon dioxide |
. In this expression it is assumed that both the gas-phase and |
||||
the liquid-phase are well mixed. The mass transfer coefficient for carbon dioxide,  is difficult to determine by the dynamic method. Transfer kinetics could be
influenced by pH control and |
electrodes suffer from poor response times. |
However, the ratio of  values for
  and
and  is proportional to the ratio of their liquid phase diffusivities, and thus of the square root of their mole mass:
205
Ronald Neeleman
Since the  can be determined experimentally as mentioned in the previous paragraph and the mole masses are known, the
  a can be calculated. The total mass balance for the
  concentration in the headspace is given by
with |
the gas flow |
assuming absence of carbon dioxide in the incoming gas. |
|
Here R is the gas constant ( |
, T the temperature (K) and |
the headspace |
|
volume (1). |
|
|
|
2.3. CARBON DIOXIDE EQUILIBRIUM IN THE LIQUID PHASE
In contrast to the assumptions for the OUR there is a discrepancy between the carbon dioxide transfer rate (CTR) across the gas-liquid interface, available from gas analyses, and the carbon dioxide evolution rate (CER) of the biomass in the bioreactor. The CER cannot be measured directly as carbon dioxide has a much higher solubility than oxygen that is enhanced by its hydrolysis to bicarbonate. Changes in the concentrations of dissolved carbon dioxide and bicarbonate results in differences between the CTR and
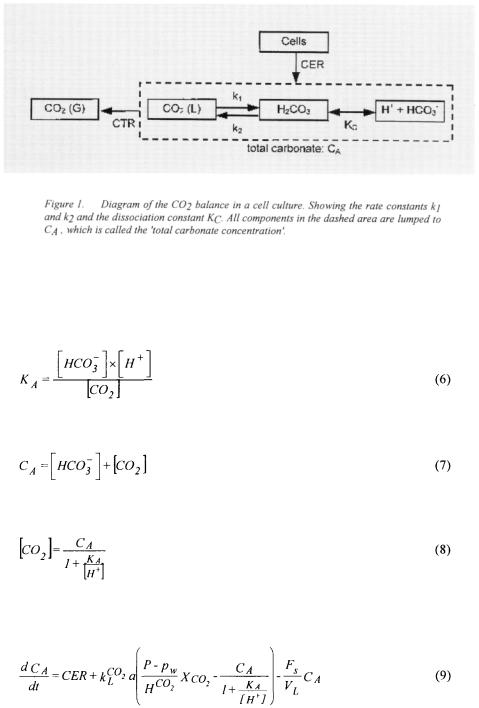
CER (Royce, 1992), which increase with the bicarbonate buffering capacity of the medium. By measuring carbon dioxide in the off-gas of the bioreactor, a substantial amount of carbon dioxide coming from the buffer system will inevitably be measured, and not only the carbon dioxide produced by the cells (Bonarius et al., 1995). Figure 1 shows the diffusion of carbon dioxide through the cell membrane and the subsequently following reactions with  as the rate constants for the indicated reactions
and |
is the carbonic acid dissociation constant |
Further dissociation, of |
bicarbonate into carbonate is negligible for the pH range used during standard cell cultures (pH < 7.8). The concentration of carbonic .acid is always very small in
comparison to that of dissolved carbon dioxide, |
.The mass balance for carbon |
dioxide and bicarbonate is:
with |
the |
concentration |
of carbon dioxide and |
the |
concentration |
bicarbonate both |
expressed in |
As there is no sink for bicarbonate |
ions other than |
||
by dehydration, the time scale of changes in cell culture is long enough to ensure that the reactions involved in the dehydration of bicarbonate are close to equilibrium. The rate constants associated with carbonic acid dissociation are so large that this reaction can be considered to be at equilibrium.
206
Respiration quotient: estimation during batch cultivation in bicarbonate buffered media
During batch cultivations the is controlled closely to the desired set-point. Therefore it is not necessary to model both the carbon dioxide and the bicarbonate concentration separately, because carbon dioxide and bicarbonate are in equilibrium; the dissociation constant for hydrolysis of bicarbonate
  is given by:
Now, a lumped variable  called 'total carbonate concentration', can be introduced:
and thus the carbon dioxide concentration in the liquid is given by:
The dashed area in Figure 1 represents the lumped concentration. Combining Equations 2, 5, 7 and 8 gives the mass balance for the 'total carbonate concentration':
207